Lesson 11
Variability and MAD
11.1: Shooting Hoops (Part 1) (5 minutes)
Warm-up
The purpose of this warm-up is for students to first reason about the mean of a data set without calculating and then practice calculating mean. The context will be used in an upcoming activity in this lesson so this warm-up familiarizes students with the context for talking about deviation from the mean.
In their predictions, students may think that Elena will have the highest mean, because she has a few very high scores (7, 8, and 9 points). They may also think that Lin and Jada will have very close means because they each have 5 higher scores than one another and their other scores are the same. Even though each player has the same mean, all of these ideas are reasonable things for students to consider when looking at the data. Record and display their predictions without further questions until they have calculated and compared the mean of their individual data sets.
Launch
Arrange students in groups of 3. Display the data sets for all to see. Ask students to predict which player has the largest mean and which has the smallest mean. Give students 1 minute of quiet think time and then poll students on the player who they think has the largest and smallest mean. Ask a few students to share their reasoning.
Tell each group member to calculate the mean of the data set for one player in the task, share their work in the small group, and complete the remaining questions.
Student Facing
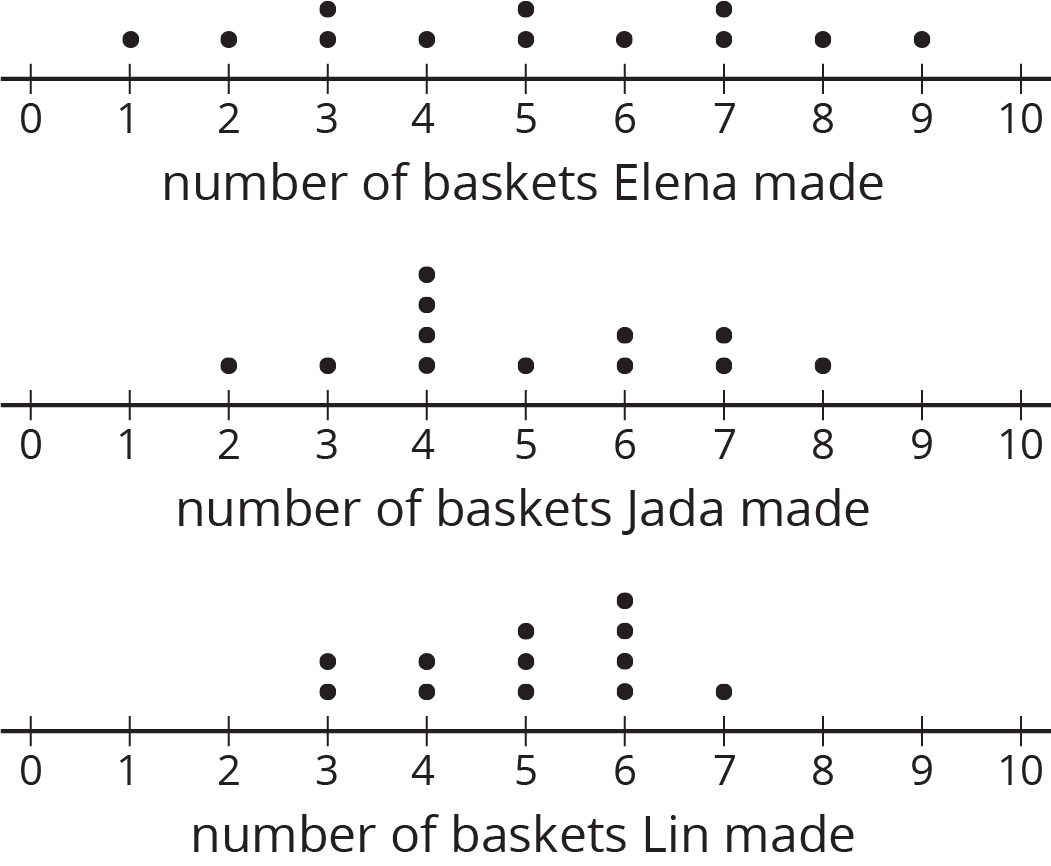
Elena, Jada, and Lin enjoy playing basketball during recess. Lately, they have been practicing free throws. They record the number of baskets they make out of 10 attempts. Here are their data sets for 12 school days.
Elena
4
5
1
6
9
7
2
8
3
3
5
7
Jada
2
4
5
4
6
6
4
7
3
4
8
7
Lin
3
6
6
4
5
5
3
5
4
6
6
7
- Calculate the mean number of baskets each player made, and compare the means. What do you notice?
- What do the means tell us in this context?
Student Response
For access, consult one of our IM Certified Partners.
Activity Synthesis
Ask students to share the mean for each player's data set. Record and display their responses for all to see. After each student shares, ask the class if they agree or disagree and what the mean tells us in this context. If the idea that the means show that all three students make, on average, half of the 10 attempts to get the basketball in the hoop does not arise, make that idea explicit.
If there is time, consider revisiting the predictions and asking how the mean of Elena's data set can be the same as the others when she more high scores?
11.2: Shooting Hoops (Part 2) (15 minutes)
Activity
In this activity, students continue to develop their understanding of what could be considered typical for a group as well as variability in a data set. Students compare distributions with the same mean but different spreads and interpret them in the context of a situation. The context given here (basketball score) prompts them to connect the mean to the notion of how “well” a player plays in general, and deviations from the mean to how “consistently” that player plays.
They encounter the idea of calculating the average absolute deviation from the mean as a way to describe variability in data.
Launch
Arrange students in groups of 3–4. Give groups 6–7 minutes to answer the questions and follow with a whole-class discussion.
Supports accessibility for: Memory; Conceptual processing
Design Principle(s): Support sense-making
Student Facing
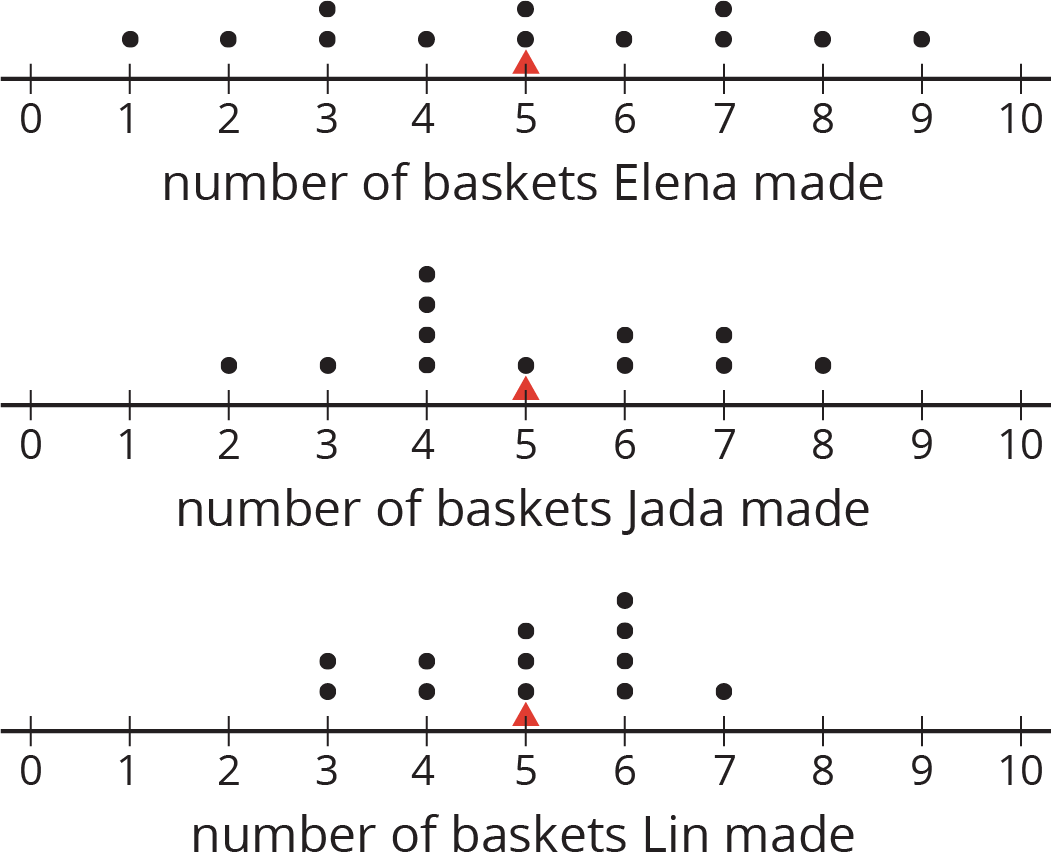
Here are the dot plots showing the number of baskets Elena, Jada, and Lin each made over 12 school days.
-
On each dot plot, mark the location of the mean with a triangle (\(\Delta\)). Then, contrast the dot plot distributions. Write 2–3 sentences to describe the shape and spread of each distribution.
-
Discuss the following questions with your group. Explain your reasoning.
- Would you say that all three students play equally well?
- Would you say that all three students play equally consistently?
- If you could choose one player to be on your basketball team based on their records, who would you choose?
Student Response
For access, consult one of our IM Certified Partners.
Activity Synthesis
The purpose of the discussion is to highlight that the center of the distribution is not always the only consideration when discussing data. The variability or spread can also influence how we understand the data.
There are many ways to answer the second set of questions. Invite students or groups who have different interpretations of “playing well” and “playing consistently” to share their thinking. Allow as many interpretations to be shared as time permits. Discuss:
- “How might we use the given data to quantify ‘playing well’ and ‘playing consistently?’”
- “Is there a way to describe variability and consistency in playing precisely and in an objective way (rather than using broad, verbal descriptions)?”
Explain that we can describe variability more formally and precisely—using a number to sum it up; we will look at how to do so in the next activity.
11.3: Shooting Hoops (Part 3) (15 minutes)
Activity
In the previous activity, students evaluated the performance of three students based on the mean and variability. Here they learn the term mean absolute deviation (MAD)as a way to quantify variability and calculate it by finding distances between the mean and each data value. Students compare data sets with the same mean but different MADs and interpret the variations in context.
While this process of calculating MAD involves taking the absolute value of the difference between each data point and the mean, this formal language is downplayed here. Instead, the idea of “finding the distance,” which is always positive, is used. This is done for a couple of reasons. One reason is to focus students' attention on the statistical work rather than on terminology or symbolic work. Another reason is that finding these differences may involve operations with signed numbers, which are not expected in grade 6.
Launch
Remind students in the last lesson they found distance between each data point and the mean, and found that the sum of those distances on the left and the sum on the right were equal, which allows us to think of the mean as the balancing point or the center of the data. Explain that the distance between each point and the mean can tell us something else about a distribution.
Arrange students in groups of 2. Give students 4–5 minutes to complete the first set of questions with their partner, and then 4–5 minutes of quiet time to complete the remaining questions. Follow with a whole-class discussion.
Student Facing
The tables show Elena, Jada, and Lin’s basketball data from an earlier activity. Recall that the mean of Elena’s data, as well as that of Jada and Lin’s data, was 5.
- Record the distance between each of Elena’s scores and the mean.
Elena 4 5 1 6 9 7 2 8 3 3 5 7 distance from 5 1 1 Now find the average of the distances in the table. Show your reasoning and round your answer to the nearest tenth.
This value is the mean absolute deviation (MAD) of Elena’s data.
Elena’s MAD: _________
- Find the mean absolute deviation of Jada’s data. Round it to the nearest tenth.
Jada 2 4 5 4 6 6 4 7 3 4 8 7 distance from 5 Jada’s MAD: _________
- Find the mean absolute deviation of Lin’s data. Round it to the nearest tenth.
Lin 3 6 6 4 5 5 3 5 4 6 6 7 distance from 5 Lin’s MAD: _________
-
Compare the MADs and dot plots of the three students’ data. Do you see a relationship between each student’s MAD and the distribution on her dot plot? Explain your reasoning.
Student Response
For access, consult one of our IM Certified Partners.
Student Facing
Are you ready for more?
Invent another data set that also has a mean of 5 but has a MAD greater than 2. Remember, the values in the data set must be whole numbers from 0 to 10.
Student Response
For access, consult one of our IM Certified Partners.
Anticipated Misconceptions
Students may recall the previous lesson about thinking of the mean as a balance point and think that the MAD should always be zero since the left and right distances should be equal. Remind them that distances are always positive, so finding the average of these distances to the mean can only be zero if all the data points are exactly at the mean.
Activity Synthesis
During discussion, highlight that finding how far away, on average, the data points are from the mean is a way to describe the variability of a distribution. Discuss:
- “What can we say about a data set whose data points have very small distances from the mean?”
- “What about a data set with points that show large distances from the mean?”
- “Does a data set with smaller distances (and therefore smaller average distances) show less or more variability?”
- “What do MAD values of 2, 1.5, and 1 mean in this context?”
Supports accessibility for: Memory; Language
Design Principle(s): Support sense-making
11.4: Game of 22 (15 minutes)
Optional activity
This optional activity uses a game to help students develop the idea of variability. Use this activity if students could benefit from more concrete experiences around the idea of distance from the mean. Students will draw from a standard deck of playing cards and find the sum. The player with the least mean distance from 22 wins the round.
Launch
Students in groups of 2–3. A deck of playing cards per group. Play 4–6 rounds.
Supports accessibility for: Conceptual processing; Visual-spatial processing
Student Facing
Your teacher will give your group a deck of cards. Shuffle the cards, and put the deck face down on the playing surface.
- To play: Draw 3 cards and add up the values. An ace is a 1. A jack, queen, and king are each worth 10. Cards 2–10 are each worth their face value. If your sum is anything other than 22 (either above or below 22), say: “My sum deviated from 22 by ____ ,” or “My sum was off from 22 by ____ .”
- To keep score: Record each sum and each distance from 22 in the table. After five rounds, calculate the average of the distances. The player with the lowest average distance from 22 wins the game.
| player A | round 1 | round 2 | round 3 | round 4 | round 5 |
|---|---|---|---|---|---|
| sum of cards | |||||
| distance from 22 |
Average distance from 22: ____________
| player B | round 1 | round 2 | round 3 | round 4 | round 5 |
|---|---|---|---|---|---|
| sum of cards | |||||
| distance from 22 |
Average distance from 22: ____________
| player C | round 1 | round 2 | round 3 | round 4 | round 5 |
|---|---|---|---|---|---|
| sum of cards | |||||
| distance from 22 |
Average distance from 22: ____________
Student Response
For access, consult one of our IM Certified Partners.
Activity Synthesis
Ask students to think about how average distance from a number can be used to summarize variability and invite a couple of students to share their thinking.
In the game, we can think of the player with the least average distance from 22 as having cards that are, on the whole, closest to 22 or the “least different” from 22. By the same token, a player with the greatest average distance from 22 can be seen as having cards that are, on the whole, farthest away from 22 or the “most different” from 22. Connect this to the idea that a data set with a large MAD means it has many values that vary from what we could consider a typical member of the group.
Design Principle(s): Optimize output (for explanation); Cultivate conversation
Lesson Synthesis
Lesson Synthesis
In an earlier lesson, we learned that the mean can tell us about what is typical for (or what is characteristic of) a data set because it measures the center of a distribution. In this lesson, we learn that we can also use a measure of spread to tell us about how much the values in a data set vary.
- “How did we measure spread?”
- “We learned about a measure called the mean absolute deviation (or MAD). What is the meaning of this term?”
- “What does the MAD tell us?” (The average distance between data points and the mean. It tells us how spread out the data values are.)
- “How do we find the MAD?”
- “How is MAD related to the variability of a data set?”
11.5: Cool-down - Text Messages, Again (5 minutes)
Cool-Down
For access, consult one of our IM Certified Partners.
Student Lesson Summary
Student Facing
We use the mean of a data set as a measure of center of its distribution, but two data sets with the same mean could have very different distributions.
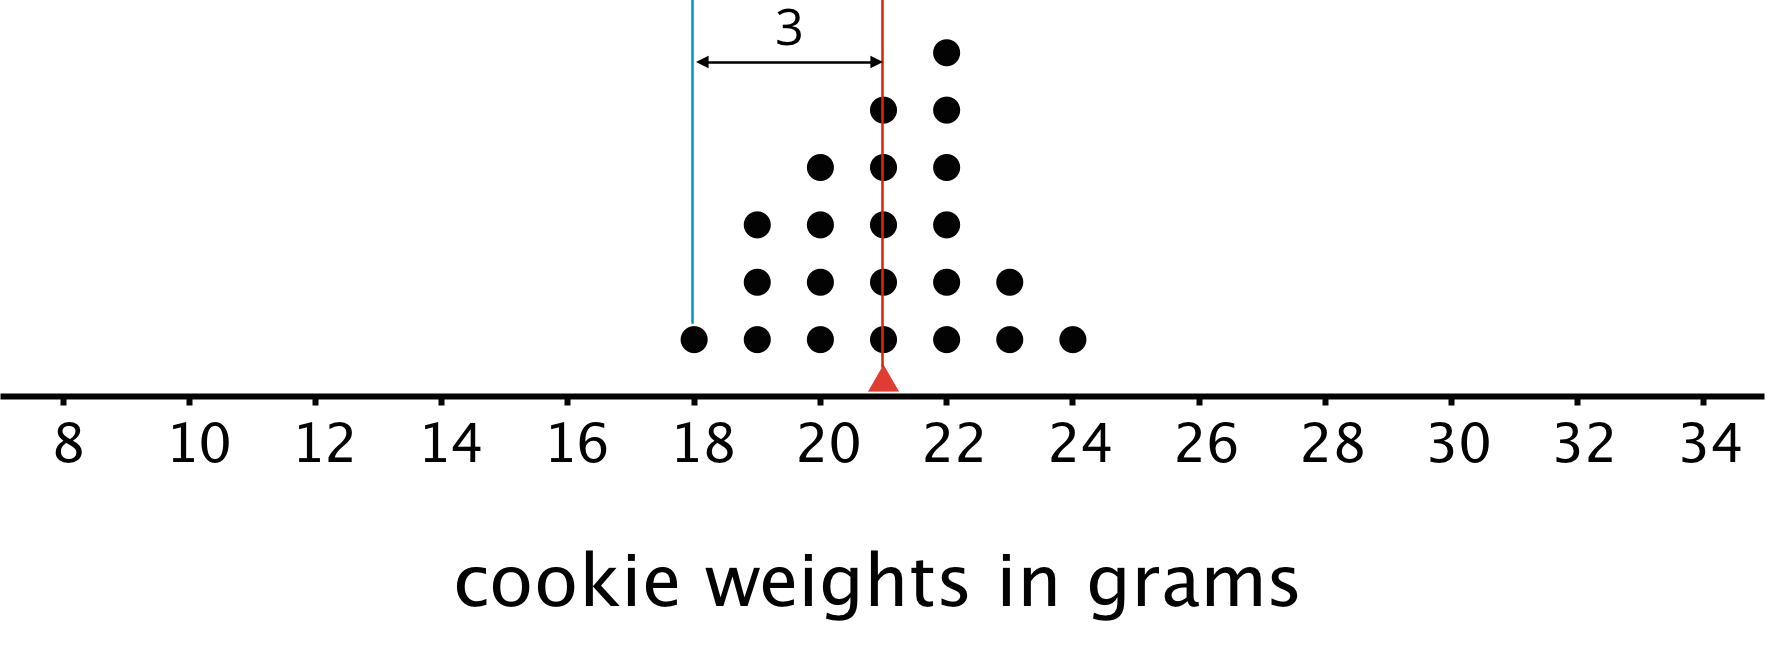
This dot plot shows the weights, in grams, of 22 cookies.

The mean weight is 21 grams. All the weights are within 3 grams of the mean, and most of them are even closer. These cookies are all fairly close in weight.
This dot plot shows the weights, in grams, of a different set of 30 cookies.

The mean weight for this set of cookies is also 21 grams, but some cookies are half that weight and others are one-and-a-half times that weight. There is a lot more variability in the weight.
There is a number we can use to describe how far away, or how spread out, data points generally are from the mean. This measure of spread is called the mean absolute deviation (MAD).
Here the MAD tells us how far cookie weights typically are from 21 grams. To find the MAD, we find the distance between each data value and the mean, and then calculate the mean of those distances.
For instance, the point that represents 18 grams is 3 units away from the mean of 21 grams. We can find the distance between each point and the mean of 21 grams and organize the distances into a table, as shown.
| weight in grams | 18 | 19 | 19 | 19 | 20 | 20 | 20 | 20 | 21 | 21 | 21 | 21 | 21 | 22 | 22 | 22 | 22 | 22 | 22 | 23 | 23 | 24 |
|---|---|---|---|---|---|---|---|---|---|---|---|---|---|---|---|---|---|---|---|---|---|---|
| distance from mean | 3 | 2 | 2 | 2 | 1 | 1 | 1 | 1 | 0 | 0 | 0 | 0 | 0 | 1 | 1 | 1 | 1 | 1 | 1 | 2 | 2 | 3 |
The values in the first row of the table are the cookie weights for the first set of cookies. Their mean, 21 grams, is the mean of the cookie weights.
The values in the second row of the table are the distances between the values in the first row and 21. The mean of these distances is the MAD of the cookie weights.
What can we learn from the averages of these distances once they are calculated?
- In the first set of cookies, the distances are all between 0 and 3. The MAD is 1.2 grams, which tells us that the cookie weights are typically within 1.2 grams of 21 grams. We could say that a typical cookie weighs between 19.8 and 22.2 grams.
-
In the second set of cookies, the distances are all between 0 and 13. The MAD is 5.6 grams, which tells us that the cookie weights are typically within 5.6 grams of 21 grams. We could say a typical cookie weighs between 15.4 and 26.6 grams.
The MAD is also called a measure of the variability of the distribution. In these examples, it is easy to see that a higher MAD suggests a distribution that is more spread out, showing more variability.