Lesson 12
Using Mean and MAD to Make Comparisons
12.1: Number Talk: Decimal Division (5 minutes)
Warm-up
This number talk helps students to review strategies for dividing a decimal number by a whole number and to build their fluency. It also prepares them to calculate mean and MAD more efficiently. While four problems are given, it may not be possible to share every strategy. Consider gathering only two or three different strategies per problem, saving most of the time for the final question.
Launch
Reveal one problem at a time. Give students 30 seconds of quiet think time for each problem and ask them to give a signal when they have an answer and a strategy. Keep all previous problems displayed throughout the task. Follow with a whole-class discussion.
Supports accessibility for: Memory; Organization
Student Facing
Find the value of each expression mentally.
\(42\div12\)
\(2.4\div12\)
\(44.4\div12\)
\(46.8\div12\)
Student Response
For access, consult one of our IM Certified Partners.
Activity Synthesis
Ask students to share their strategies for each problem. Record and display their explanations for all to see. To involve more students in the conversation, consider asking:
-
“Who can restate ___’s reasoning in a different way?”
-
“Did anyone have the same strategy but would explain it differently?”
-
“Did anyone solve the problem in a different way?”
-
“Does anyone want to add on to _____’s strategy?”
-
“Do you agree or disagree? Why?”
Design Principle(s): Optimize output (for explanation)
12.2: Which Player Would You Choose? (20 minutes)
Activity
This activity allows students to practice calculating MAD and build a better understanding of what it tells us. Students continue to compare data sets with the same mean but different MADs and interpret what these differences imply in the context of the situation.
Launch
Arrange students in groups of 3–4. Before students read the task statements, display the two dot plots in the task for all to see. Give students up to 1 minute to study the dot plots and share with their group what they notice and wonder about the plots.
Next, select a few students to share their observations and questions; it is not necessary to confirm or correct students' observations or answer their questions at this point. If no one noticed or wondered about what variable the data sets show, ask students what they think the context for the data sets might be or what quantities they show. Explain to students that they will find more information in the task statement to help them compare and interpret the dot plots.
Give students 3–4 minutes of quiet work time to complete the first set of questions, and then 8–10 minutes to complete the second set with their group. Allow at least a few minutes for a whole-class discussion.
Supports accessibility for: Memory; Conceptual processing
Student Facing
-
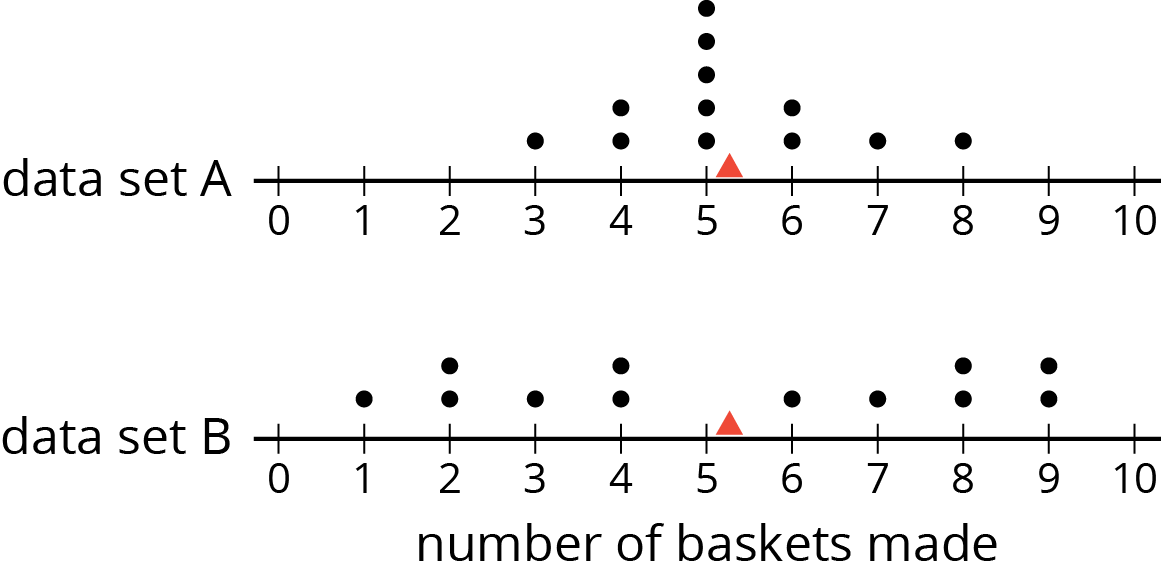
Andre and Noah joined Elena, Jada, and Lin in recording their basketball scores. They all recorded their scores in the same way: the number of baskets made out of 10 attempts. Each collected 12 data points.
- Andre’s mean number of baskets was 5.25, and his MAD was 2.6.
- Noah’s mean number of baskets was also 5.25, but his MAD was 1.
Here are two dot plots that represent the two data sets. The triangle indicates the location of the mean.- Without calculating, decide which dot plot represents Andre’s data and which represents Noah’s. Explain how you know.
- If you were the captain of a basketball team and could use one more player on your team, would you choose Andre or Noah? Explain your reasoning.
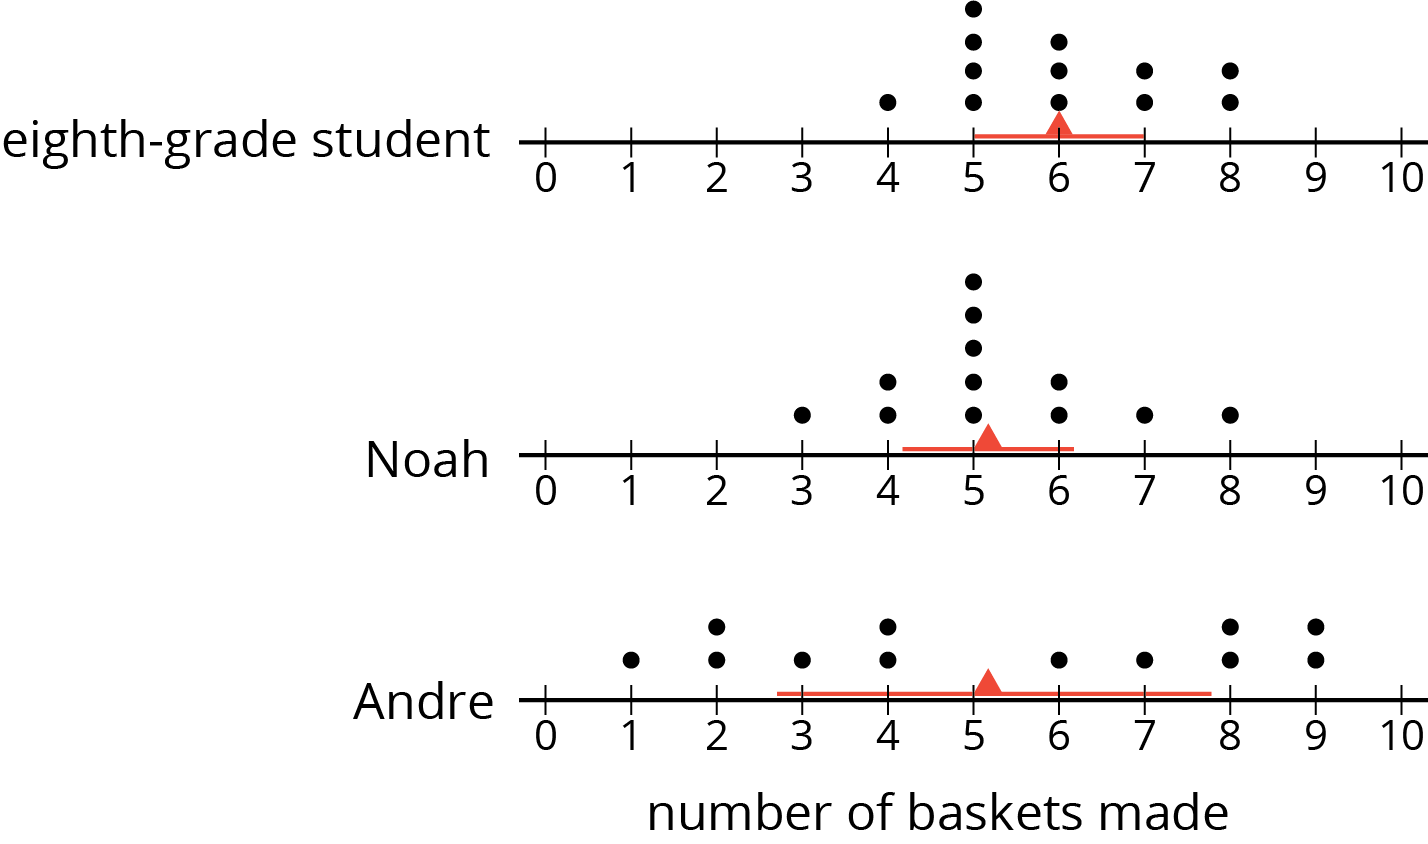
- An eighth-grade student decided to join Andre and Noah and kept track of his scores. His data set is shown here. The mean number of baskets he made is 6.
eighth‐grade student 6 5 4 7 6 5 7 8 5 6 5 8 distance from 6 - Calculate the MAD. Show your reasoning.
- Draw a dot plot to represent his data and mark the location of the mean with a triangle (\(\Delta\)).
- Compare the eighth-grade student’s mean and MAD to Noah’s mean and MAD. What do you notice?
- Compare their dot plots. What do you notice about the distributions?
- What can you say about the two players’ shooting accuracy and consistency?
Student Response
For access, consult one of our IM Certified Partners.
Student Facing
Are you ready for more?
Invent a data set with a mean of 7 and a MAD of 1.
Student Response
For access, consult one of our IM Certified Partners.
Activity Synthesis
Select a couple of students to share their responses to the first set of questions about how they matched the dot plots to the players (Andre and Noah) and how they knew.
Then, display a completed table and the MAD for the second set of questions. Give students a moment to check their work. To facilitate discussion, help students connect MAD and the spread of data, and enable them to make comparison, consider displaying all three dot plots at the same scale and using a line segment to represent the MAD on each dot plot, as shown here.
Invite a few students to share their observations about how the means and MADs of Noah and the eighth-grade student compare. Discuss:
- “How are the distributions of points related to the mean? How are they related to the MAD?”
- “Which might be more desirable for a basketball team: a lower mean or a higher mean? Why?”
- “Which might be more desirable: a lower MAD or a higher MAD? Why?”
- “Of the three students, which one would you want on your team? Why?”
Expect students to choose different players to be on their team, but be sure they support their preferences with a reasonable explanation (MP3). Students should walk away understanding that, in this context, a higher MAD indicates more variability and less consistency in the number of shots made.
Design Principle(s): Support sense-making
12.3: Swimmers Over the Years (10 minutes)
Activity
In this activity, students continue to practice interpreting the mean and the MAD and to use them to answer statistical questions. A new context is introduced, but students should continue to consider both the center and variability of the distribution as ways of thinking about what is typical for a set of data and how consistent the data tends to be.
Launch
Give students 5–7 minutes of quiet work time. Ask students to consider drawing a triangle and a line segment on each dot plot in the last question to represent the mean and MAD for each data set (as was done in an earlier lesson).
Student Facing
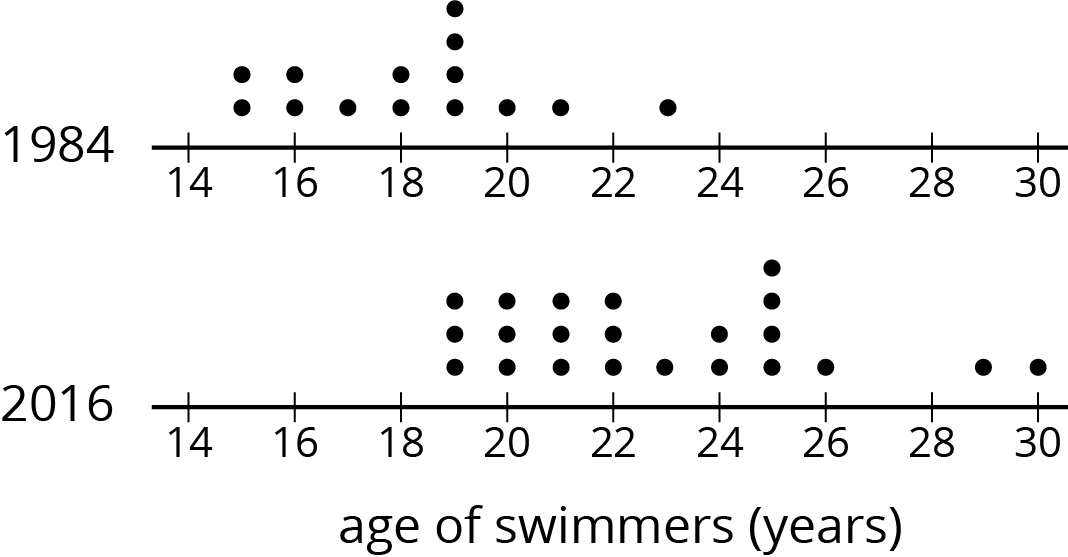
In 1984, the mean age of swimmers on the U.S. women’s swimming team was 18.2 years and the MAD was 2.2 years. In 2016, the mean age of the swimmers was 22.8 years, and the MAD was 3 years.
- How has the average age of the women on the U.S. swimming team changed from 1984 to 2016? Explain your reasoning.
- Are the swimmers on the 1984 team closer in age to one another than the swimmers on the 2016 team are to one another? Explain your reasoning.
-
Here are dot plots showing the ages of the women on the U.S. swimming team in 1984 and in 2016. Use them to make two other comments about how the women’s swimming team has changed over the years.
Student Response
For access, consult one of our IM Certified Partners.
Activity Synthesis
Have a student display dot plots with the means and MADs marked on them. Invite several students to share their comments about how the composition of the swimming team has changed over the three decades. Some discussion questions:
- “What can you say about the size of the team? Has it changed?”
- “Overall, has the team gotten older, younger, or stayed about the same? How do you know?”
- “Has the age of the youngest swimmer changed? What about the age of the oldest swimmer?”
- “Has the team become more diverse in ages, in general? Or have the swimmers become more alike in their age? How do you know?”
Students should recognize that the higher mean and MAD for the 2016 swimming team tell us that the team, on the whole, has gotten older and more diverse in ages. In 1984, 18.2 years was a typical age for the swimmers. A typical age for the 2016 swimmers was 22.8 years and there was a wider range of ages represented.
Design Principle(s): Support sense-making; Optimize output (for explanation)
Lesson Synthesis
Lesson Synthesis
In this lesson, we look at what different means and MADs tell us in situations.
- “Suppose the mean height of the students in a class is 60 inches and the MAD is 2.5 inches. How do the mean and the MAD tell us about what is typical for the students' heights?”
- “How do two distributions compare if they have the same means but different MADs?” (Same center, different variability or spread.)
- “How do two distributions compare if they have the same MADs but different means?” (Same variability or spread, different centers.)
12.4: Cool-down - Travel Times Across the World (5 minutes)
Cool-Down
For access, consult one of our IM Certified Partners.
Student Lesson Summary
Student Facing
Sometimes two distributions have different means but the same MAD.
Pugs and beagles are two different dog breeds. The dot plot shows two sets of weight data—one for pugs and the other for beagles.

- The mean weight for pugs is 7 kilograms, and the MAD is 0.5 kilogram.
- The mean weight for beagles is 10 kilograms, and the MAD is 0.5 kilogram.
We can say that, in general, the beagles are heavier than the pugs. A typical weight for the beagles in this group is about 3 kilograms heavier than a typical weight for the pugs.
The variability of pug weights, however, is about the same as the variability of beagle weights. In other words, the weights of pugs and the weights of beagles are equally spread out.