Lesson 6
Estimating Probabilities Using Simulation
Problem 1
The weather forecast says there is a 75% chance it will rain later today.
-
Draw a spinner you could use to simulate this probability.
- Describe another way you could simulate this probability.
Solution
For access, consult one of our IM Certified Partners.
Problem 2
An experiment will produce one of ten different outcomes with equal probability for each. Why would using a standard number cube to simulate the experiment be a bad choice?
Solution
For access, consult one of our IM Certified Partners.
Problem 3
An ice cream shop offers 40 different flavors. To simulate the most commonly chosen flavor, you could write the name of each flavor on a piece of paper and put it in a bag. Draw from the bag 100 times, and see which flavor is chosen the most. This simulation is not a good way to figure out the most-commonly chosen flavor. Explain why.
Solution
For access, consult one of our IM Certified Partners.
Problem 4
Each set of three numbers represents the lengths, in units, of the sides of a triangle. Which set can not be used to make a triangle?
7, 6, 14
4, 4, 4
6, 6, 2
7, 8,13
Solution
For access, consult one of our IM Certified Partners.
(From Unit 7, Lesson 7.)Problem 5
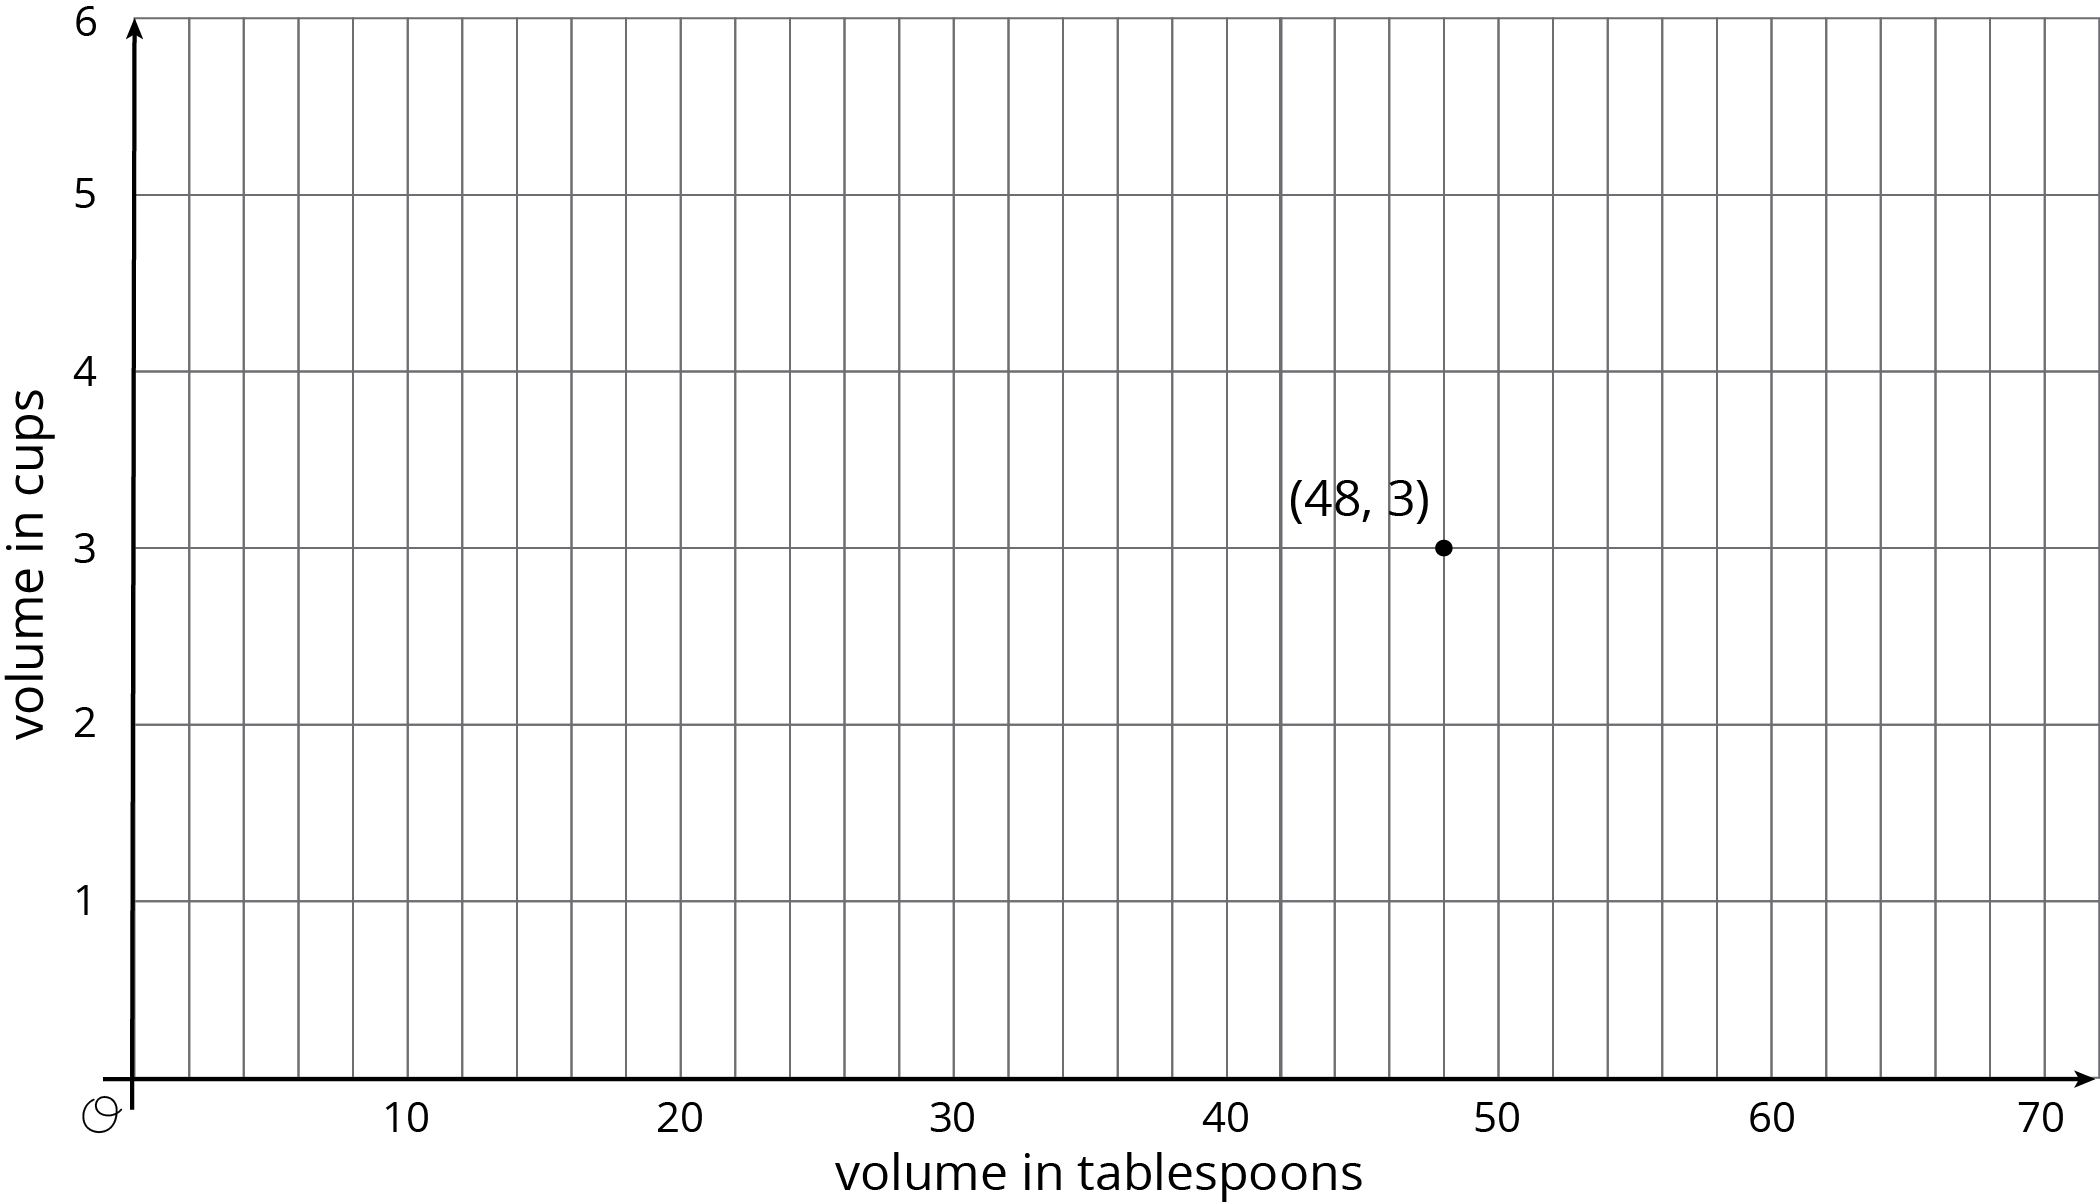
There is a proportional relationship between a volume measured in cups and the same volume measured in tablespoons. 48 tablespoons is equivalent to 3 cups, as shown in the graph.

- Plot and label some more points that represent the relationship.
- Use a straightedge to draw a line that represents this proportional relationship.
- For which value \(y\) is (\(1, y\)) on the line you just drew?
- What is the constant of proportionality for this relationship?
- Write an equation representing this relationship. Use \(c\) for cups and \(t\) for tablespoons.
Solution
For access, consult one of our IM Certified Partners.
(From Unit 2, Lesson 14.)