Lesson 18
Comparing Populations Using Samples
18.1: Same Mean? Same MAD? (5 minutes)
Warm-up
This warm-up reminds students of the meanings of mean and MAD by comparing two sets of data with similar but different values and asking whether they will have the same means or MADs or both.
Launch
Explain to students that the pairs of data sets are: A and B, X and Y, and P and Q.
Student Facing
Without calculating, tell whether each pair of data sets have the same mean and whether they have the same mean absolute deviation.
-
set A
1
3
3
5
6
8
10
14
set B
21
23
23
25
26
28
30
34
-
set X
1
2
3
4
5
set Y
1
2
3
4
5
6
-
set P
47
53
58
62
set Q
37
43
68
72
Student Response
For access, consult one of our IM Certified Partners.
Anticipated Misconceptions
For students who have a difficult time starting without calculating, help them to compare the values in the ones place for the first and third pairs of data.
Activity Synthesis
The purpose of the discussion is to bring out methods students used to notice whether the pairs of data sets had the same mean or MAD or both.
Poll the class for each pair of data sets as to whether they had the same mean, MAD, both, or neither.
After students have had a chance to register their vote, ask some students to explain their reasoning for their answer.
18.2: With a Heavy Load (10 minutes)
Activity
In a previous lesson, students compared heights of two teams of people when the entire populations were known. In this activity, students only have access to data from a sample of each population and are asked to determine if the populations are different based on the sample. Students construct informal arguments to explain why the different samples come from populations that are meaningfully different or not (MP3).
Launch
Arrange students in groups of 2. Allow students 3–5 minutes quiet work time followed by partner and whole-class discussions.
Design Principle(s): Optimize output; Cultivate conversation
Student Facing
Consider the question: Do tenth-grade students' backpacks generally weigh more than seventh-grade students' backpacks?
Here are dot plots showing the weights of backpacks for a random sample of students from these two grades:
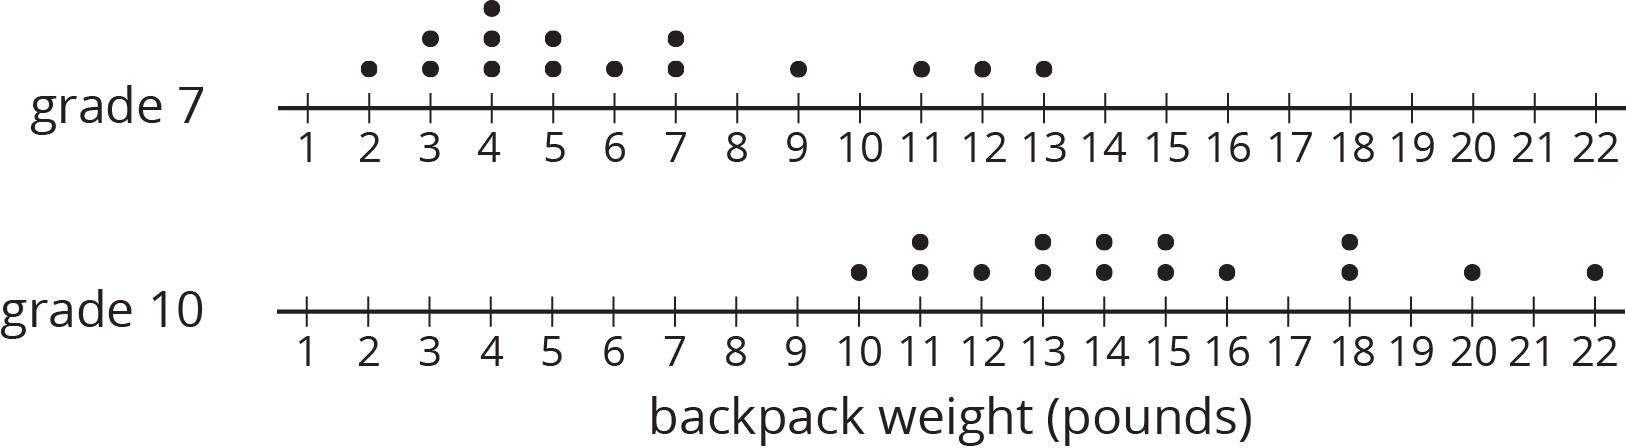
- Did any seventh-grade backpacks in this sample weigh more than a tenth-grade backpack?
-
The mean weight of this sample of seventh-grade backpacks is 6.3 pounds. Do you think the mean weight of backpacks for all seventh-grade students is exactly 6.3 pounds?
- The mean weight of this sample of tenth-grade backpacks is 14.8 pounds. Do you think there is a meaningful difference between the weight of all seventh-grade and tenth-grade students' backpacks? Explain or show your reasoning.
Student Response
For access, consult one of our IM Certified Partners.
Activity Synthesis
The purpose of the discussion is for students to think about how comparing groups by using data from samples differs from comparing groups when the population is known.
Ask partners to share their decision about whether the groups had a meaningful difference with the class.
Consider asking these questions for discussion:
- “Compare the information in this activity to the information about team heights given in an earlier lesson.” (In that lesson, we had data from the entire population and here it is only a sample.)
- “Is the overlap of the data more important when you only have a sample or when you have data from the population? Explain your reasoning.” (It is more important when you only have a sample. If there is overlap with only some of the data, it's possible there is more overlap when we include more data from the population.)
- “Is it possible that the data in the two samples were drawn from population data that is identical?” (It is unlikely, but possible.)
Supports accessibility for: Visual-spatial processing; Conceptual processing
18.3: Do They Carry More? (15 minutes)
Activity
The data in the previous activity came from only one sample for each grade. This may not be enough information to make a very good determination about the entire seventh and tenth grade populations. In this activity, students look at different samples from the same population to see that their means are relatively close based on the MADs of the samples. This concept can be reversed to say that if two samples have means that are not very close, then the samples likely came from populations that are quite different. A general rule is given to determine whether two populations are meaningfully different based on the mean and MAD from a sample of each (MP6).
Launch
Keep students in groups of 2. Allow students 5 minutes of partner work time, then pause the class to assign samples and explain the general rule.
Ask students to pause after the third question in order to explain the general rule and assign a sample to each group. After all students have paused, assign each group one of the 10 samples to work with for the last 2 questions. Further, explain to students:
- As a general rule, if two populations have the same mean (or median) and similar variability, the sample means (or medians) should be within 2 MADs (or IQRs) of one another.
- If the sample means (or medians) are more than 2 MADs (or IQRs) apart, it is very likely that the population means (or medians) are different. We will say that there is a meaningful difference between the two population means (or medians).
- If the sample means (or medians) are less than or equal to 2 MADs (or IQRs) apart, it is more difficult to say that the two population means (or medians) are very different. In this case we will say that the samples do not provide evidence that the population means (or medians) differ.
Give students 5 more minutes of partner work time followed by a whole-class discussion.
Student Facing
Here are 10 more random samples of seventh-grade students' backpack weights.

| sample number |
mean weight (pounds) |
|---|---|
| 1 | 5.8 |
| 2 | 9.2 |
| 3 | 5.5 |
| 4 | 7.3 |
| 5 | 7.2 |
| 6 | 6.6 |
| 7 | 5.2 |
| 8 | 5.3 |
| 9 | 6.3 |
| 10 | 6.4 |
-
- Which sample has the highest mean weight?
- Which sample has the lowest mean weight?
- What is the difference between these two sample means?
- All of the samples have a mean absolute deviation of about 2.8 pounds. Express the difference between the highest and lowest sample means as a multiple of the MAD.
- Are these samples very different? Explain or show your reasoning.
-
Remember our sample of tenth-grade students' backpacks had a mean weight of 14.8 pounds. The MAD for this sample is 2.7 pounds. Your teacher will assign you one of the samples of seventh-grade students' backpacks to use.
- What is the difference between the sample means for the the tenth-grade students' backpacks and the seventh-grade students' backpacks?
- Express the difference between these two sample means as a multiple of the larger of the MADs.
- Do you think there is a meaningful difference between the weights of all seventh-grade and tenth-grade students' backpacks? Explain or show your reasoning.
Student Response
For access, consult one of our IM Certified Partners.
Activity Synthesis
The purpose of the discussion is for students to understand the general rule for determining if two samples suggest a meaningful difference between their populations.
Select at least one group assigned to each of the samples to share their responses to the last 2 questions and record for all to see. Note that all 10 samples from the seventh-grade students have means that are within 2 MADs of one another, but the mean from the tenth-grade student sample is at least 2 MADs away from the mean of each of the seventh grade student samples.
Note that the general rule only has two possible outcomes: “There is a meaningful difference.” or “There is not enough information to say there is a meaningful difference.” If the means are less than 2 MADs apart, the general rule cannot say whether two samples were drawn from populations that contain identical data.
Ask students, “Based only on the dot plots for the 10 samples, would you have guessed that they all might have come from the same population? Explain your reasoning.” (Maybe. There is a lot of overlap among all of the samples.)
Supports accessibility for: Language; Conceptual processing
Design Principle(s): Optimize output (for representation); Maximize meta-awareness
18.4: Steel from Different Regions (15 minutes)
Activity
In previous lessons, students used sample data to estimate population means and proportions and determined if there is a meaningful difference in population means based on sample means. In this activity, students practice using the general rule developed in the previous activity by estimating the measure of center for a population and comparing populations based on those estimates as well as the associated measure of variability (MP3).
Launch
Keep students in groups of 2.
Explain to students that different regions had different raw materials and techniques for constructing metal. One way of testing ancient metal is by looking at the carbon content in the steel. In some cases, this content could determine the region where the metal was made.
Ask students how the general rule from the previous activity might be adapted to use median and interquartile range (IQR) rather than mean and MAD.
Allow students 10 minutes of partner work time followed by a whole-class discussion.
Supports accessibility for: Organization; Attention
Design Principle(s): Optimize output (for explanation); Cultivate conversation
Student Facing
When anthropologists find steel artifacts, they can test the amount of carbon in the steel to learn about the people that made the artifacts. Here are some box plots showing the percentage of carbon in samples of steel that were found in two different regions:

-
Was there any steel found in region 1 that had:
- more carbon than some of the steel found in region 2?
- less carbon than some of the steel found in region 2?
-
Do you think there is a meaningful difference between all the steel artifacts found in regions 1 and 2?
- Which sample has a distribution that is not approximately symmetric?
-
What is the difference between the sample medians for these two regions?
sample
median (%)IQR
(%)region 1 0.64 0.05 region 2 0.47 0.03 - Express the difference between these two sample medians as a multiple of the larger interquartile range.
-
The anthropologists who conducted the study concluded that there was a meaningful difference between the steel from these regions. Do you agree? Explain or show your reasoning.
Student Response
For access, consult one of our IM Certified Partners.
Activity Synthesis
The purpose of the discussion is for students to understand how to adapt the general rule for determining a meaningful difference between populations to median and IQR.
Consider asking these questions for discussion:
- “Why did this problem use median and IQR instead of mean and MAD?” (Since the distribution for region 1 is not symmetric, it makes more sense to use the median. Also the box plots will show the median and IQR, but there is not a good way to know the mean and MAD.)
- “Is there any overlap in the data from the two regions?” (Yes. The smallest percentage of carbon from the region 1 was well below the median from region 2 while the typical percentage of carbon from region 1 is much greater than from region 2.)
- “On the box plot in the activity, draw a dot two IQRs above the median for region 2. Then draw a star two IQRs below the median for region 1. How do these help you see that there is a meaningful difference in the medians?” (The dot is at 0.53 and the star is at 0.54. Since the median for region 1 is not below the dot nor is the median for region 1 above the star, there must be a meaningful difference.)
- “A piece of steel is found in a place between the two regions sampled. Would testing the percentage of carbon from this metal be useful in determining the region from which it came?” (Yes. Since there is a meaningful difference in the percentage of carbon in the steel from the two regions, it should give a good indication which region created the metal.)
Lesson Synthesis
Lesson Synthesis
Consider asking these discussion questions to emphasize the main ideas from this lesson:
- “When is it useful to use a median rather than a mean?” (It is useful when the distribution is not approximately symmetric.)
- “What values do you need to calculate from a sample to use the general rule for determining if the measures of center of two populations are meaningfully different?” (The measure of center and measure of variation for each sample should be calculated to compare the groups.)
- “What is the general rule used to determine if the means of two populations are meaningfully different?” (If the difference between the means for the two samples is greater than twice the greater of the MADs, then the means are meaningfully different.)
18.5: Cool-down - Teachers Watching Movies (5 minutes)
Cool-Down
For access, consult one of our IM Certified Partners.
Student Lesson Summary
Student Facing
Sometimes we want to compare two different populations. For example, is there a meaningful difference between the weights of pugs and beagles? Here are histograms showing the weights for a sample of dogs from each of these breeds:
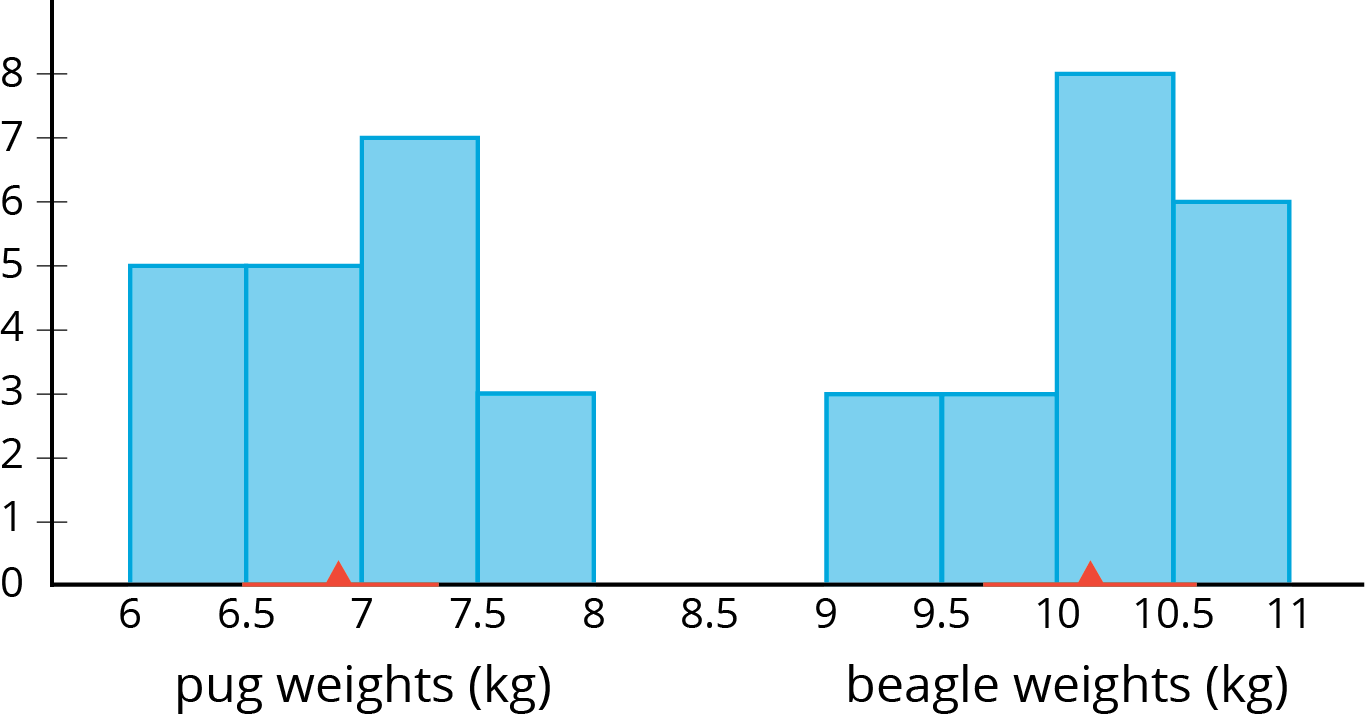
The red triangles show the mean weight of each sample, 6.9 kg for the pugs and 10.1 kg for the beagles. The red lines show the weights that are within 1 MAD of the mean. We can think of these as “typical” weights for the breed. These typical weights do not overlap. In fact, the distance between the means is \(10.1-6.9 \) or 3.2 kg, over 6 times the larger MAD! So we can say there is a meaningful difference between the weights of pugs and beagles.
Is there a meaningful difference between the weights of male pugs and female pugs? Here are box plots showing the weights for a sample of male and female pugs:
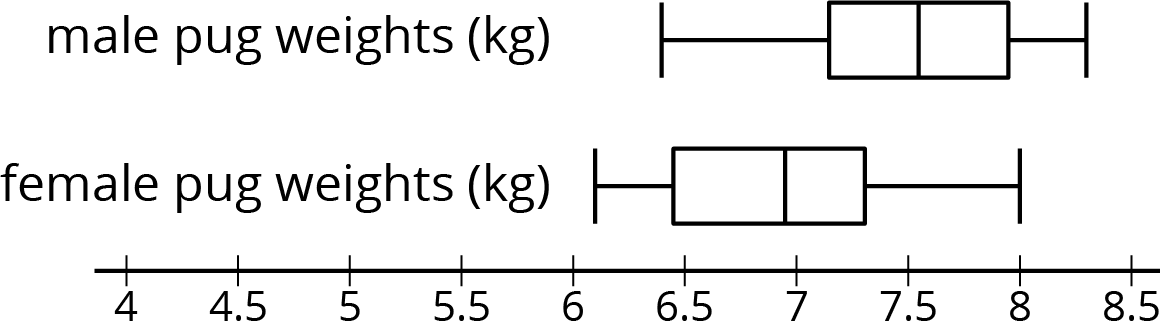
We can see that the medians are different, but the weights between the first and third quartiles overlap. Based on these samples, we would say there is not a meaningful difference between the weights of male pugs and female pugs.
In general, if the measures of center for two samples are at least two measures of variability apart, we say the difference in the measures of center is meaningful. Visually, this means the range of typical values does not overlap. If they are closer, then we don't consider the difference to be meaningful.