Lesson 15
Estimating Population Measures of Center
15.1: Describing the Center (5 minutes)
Warm-up
This warm-up asks students to decide whether to use the mean or median based on the distribution of the data. As students compare groups in this section, the choice of measure of center will be important.
Launch
Arrange students in groups of 2. Give students 1 minute quiet work time, followed by 2 minutes to discuss their work with a partner, followed by a whole-class discussion.
Student Facing
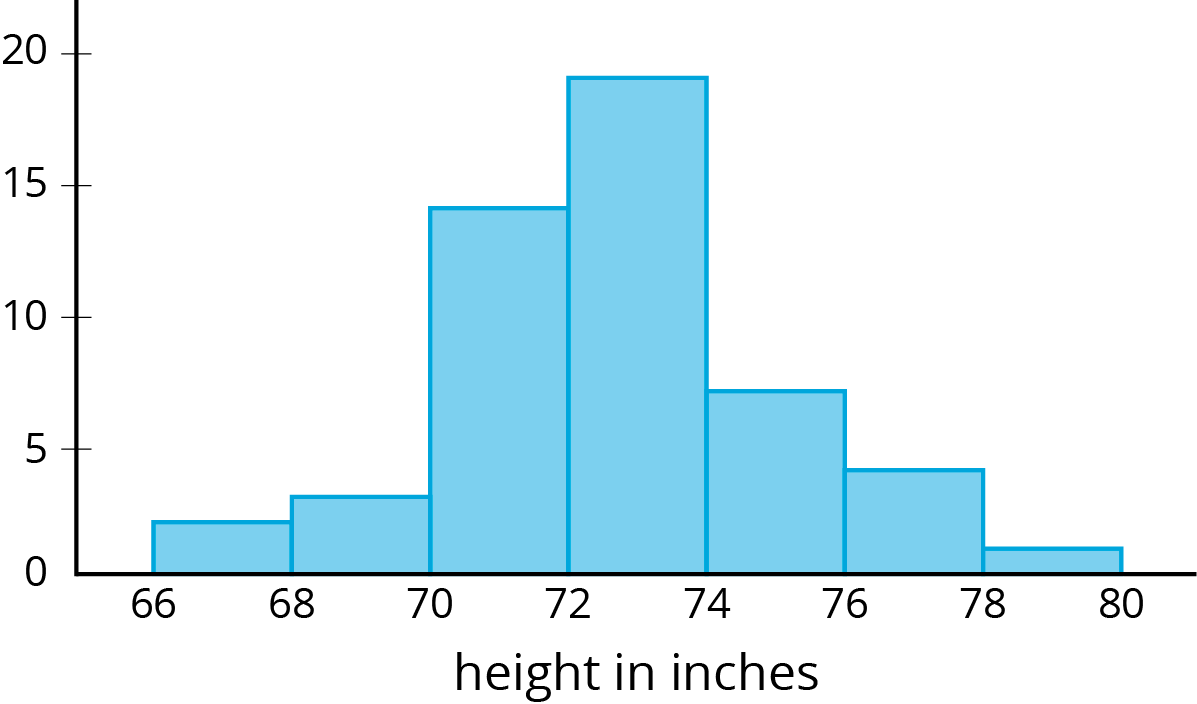
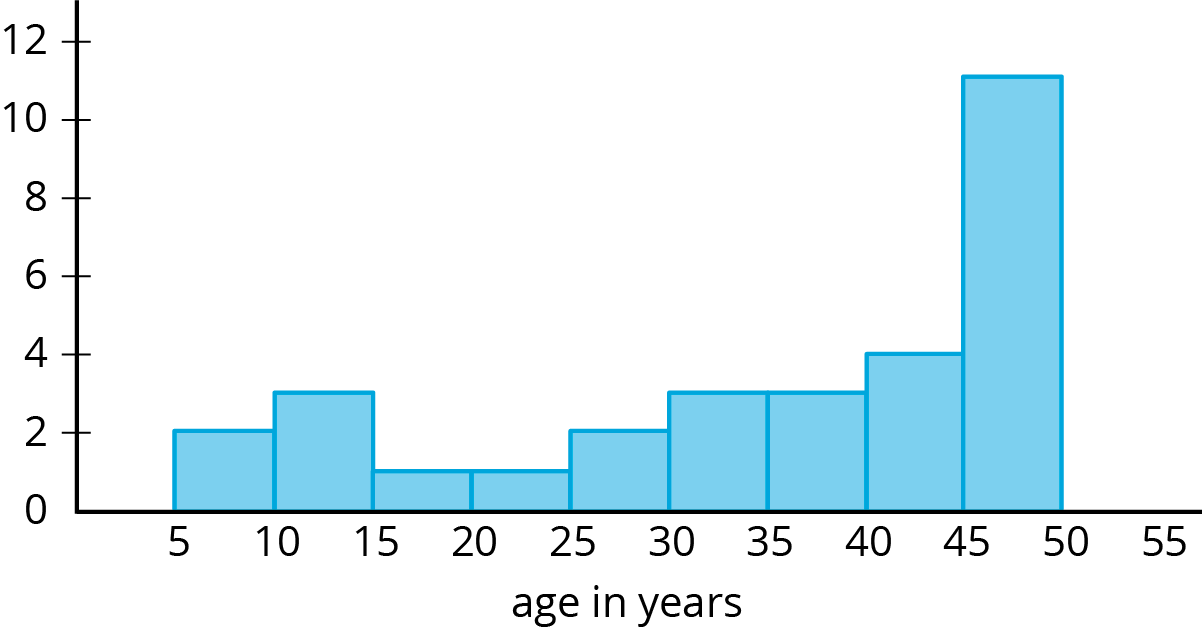
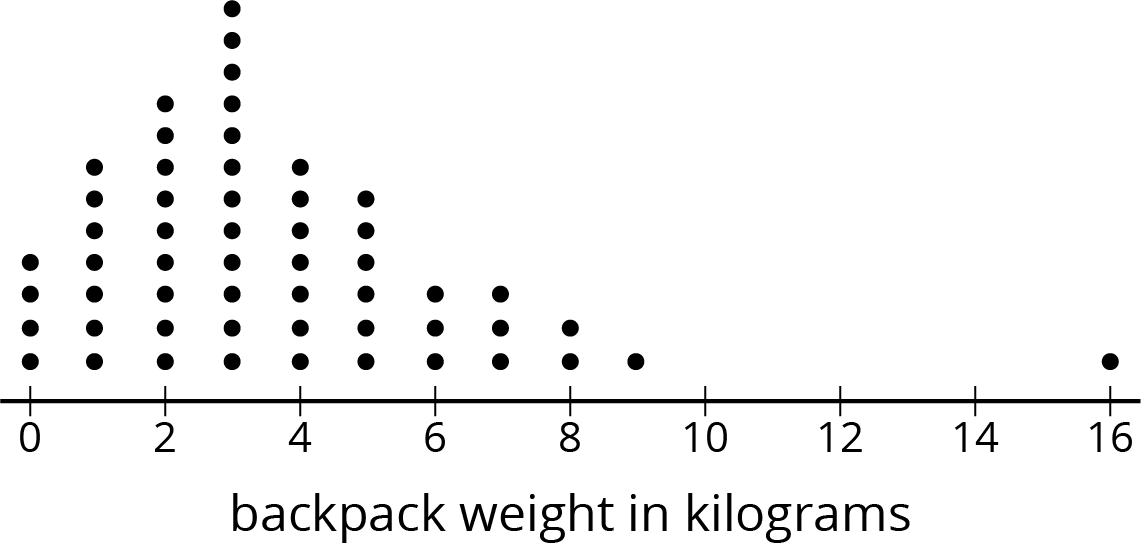
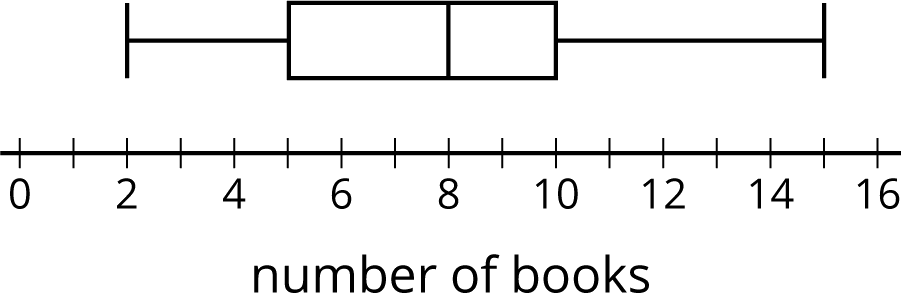
Would you use the median or mean to describe the center of each data set? Explain your reasoning.
Heights of 50 basketball players
Ages of 30 people at a family dinner party
Backpack weights of sixth-grade students
How many books students read over summer break
Student Response
For access, consult one of our IM Certified Partners.
Activity Synthesis
Select students to share their chosen measure of center and reasoning for their choice. Ask students what measures of variability should be used with each measure of center.
15.2: Three Different TV Shows (5 minutes)
Activity
In this activity, students analyze data from samples of viewers for different TV shows. The data in this activity is used to begin the analysis as well as to get students thinking about the different shows the sample could represent. The purpose of the activity is to get students thinking about how measures of center from a sample might be used to make decisions about the population of a group.
Launch
Arrange students in groups of 3. Tell students that each person in the group should work on a different sample then share their results with their group. Give students 1 minute quiet work time and then 1 minute to share their work with the group followed by a whole-class discussion.
Supports accessibility for: Memory; Conceptual processing
Design Principle(s): Support sense-making
Student Facing
Here are the ages (in years) of a random sample of 10 viewers for 3 different television shows. The shows are titled, “Science Experiments YOU Can Do,” “Learning to Read,” and “Trivia the Game Show.”
sample 1
6
6
5
4
8
5
7
8
6
6
sample 2
15
14
12
13
12
10
12
11
10
8
sample 3
43
60
50
36
58
50
73
59
69
51
- Calculate the mean for one of the samples. Make sure each person in your group works with a different sample. Record the answers for all three samples.
-
Which show do you think each sample represents? Explain your reasoning
.
Student Response
For access, consult one of our IM Certified Partners.
Activity Synthesis
Select students to share how they determined which shows matched with which data set. The purpose of the discussion is for students to notice that the shows are meant to appeal to different age groups.
15.3: Who’s Watching What? (15 minutes)
Activity
This activity continues the work begun in the previous activity for this lesson. Students compute the means for sample ages to determine what shows might be associated with each sample (MP2). They also consider the variability to assess the accuracy of population estimates. A sample from a population with less variability should provide a more accurate estimate than a sample that came from a population with more spread in the data. In the discussion, students think about why a sample is used and why an estimate of the mean is helpful, but it may miss some important aspects of the data. The discussion following the activity also asks students to think again about why different samples from the same population may produce different results.
Launch
Keep students in groups of 3.
Tell students that advertisers are interested in age groups for certain television shows so that they can try to sell appropriate items to the audience. For example, it does not make sense to advertise tricycles during a nighttime crime drama show nor to show an ad for an expensive sports car during a children’s cartoon.
The samples given in this activity are related to the shows mentioned in the previous activity for this lesson.
Tell students to divide samples 4 through 6 among the group members so that each person only needs to find one mean and share their answer with the group so that the group has access to all 3 answers.
Give students 3 minutes quiet work time for the first 3 problems, then pause the class after the third problem for a quick discussion and to assign items to groups before they continue.
After students have completed the first 3 problems, ask students to indicate which of the shows seem to go with each of the 6 samples (samples 1 through 3 from the previous activity as well as 4 through 6 in this activity). Discuss any disagreements until the class can agree on which samples correspond to which shows. Tell half of the groups that they will use samples 1 through 3 from the previous activity for the last 3 problems and the other half of the groups that they will use samples 4 through 6 for the last 3 problems.
Give students another 3 minutes of quiet work time to finish the activity followed by a whole-class discussion.
Supports accessibility for: Visual-spatial processing; Conceptual processing
Student Facing
Here are three more samples of viewer ages collected for these same 3 television shows.
sample 4
57
71
5
54
52
13
59
65
10
71
sample 5
15
5
4
5
4
3
25
2
8
3
sample 6
6
11
9
56
1
3
11
10
11
2
- Calculate the mean for one of these samples. Record all three answers.
- Which show do you think each of these samples represents? Explain your reasoning.
- For each show, estimate the mean age for all the show's viewers.
-
Calculate the mean absolute deviation for one of the shows' samples. Make sure each person in your group works with a different sample. Record all three answers.
Learning
to ReadScience
Experiments
YOU Can DoTrivia the
Game ShowWhich sample? MAD -
What do the different values for the MAD tell you about each group?
- An advertiser has a commercial that appeals to 15- to 16-year-olds. Based on these samples, are any of these shows a good fit for this commercial? Explain or show your reasoning.
Student Response
For access, consult one of our IM Certified Partners.
Activity Synthesis
The purpose of the discussion is to understand why it might be helpful to estimate the mean of a population based on a sample.
Some questions for discussion:
- “Why do you think a sample was used in this situation rather than data from the population?” (There are probably millions of people who watch these shows and it would be difficult to collect data about their ages from all of them.)
- “How could we improve the estimate of the mean for the populations?” (Include more viewers in the sample.)
- “If a sample has a large MAD, what does that imply about the population?” (That the data in the population is very spread out.)
- “If a sample has a small MAD, what is the relationship between the data and the mean?” (Most of the data is close to the mean.)
- “Which estimate of the mean for the population do you expect to be more accurate: the mean from a sample with a large MAD or the mean from a sample with a small MAD? Explain or show your reasoning.” (The mean from a sample with a small MAD. If the data in the sample is close to the mean, then most of the data from the population is also probably close to the mean. Therefore the data in the sample is probably close to the mean of the population and will provide a good estimate.)
- “What do you notice about the different answers for the same show, but the different samples?” (The means are close, but the MADs can be different by a lot.)
- “Why were the answers different for the same show, but different samples?” (Different people were included in the samples, so the numbers may change some, but if they are representative they should be close. In these examples, even though the MADs may seem very different, the relative size compared to the other shows is similar.)
Some students may wonder why they need to calculate the mean when it might be obvious how to match the titles by just looking at the data. This example included 10 ages in each sample so that the important information could be calculated quickly. In a more realistic scenario, the sample may include hundreds of ages. A computer could still calculate the mean quickly, but scanning through all of the data may not make the connection to the correct show as obvious.
- “Notice that there is a 56 year old in sample 6. What are some reasons you think they might be watching this show?” (Maybe a grandmother is watching with her grandchild. Maybe an older person is interested in how science is shown on TV.)
- “The questions asked you to consider means, but are there any data sets for which median might be a better measure of center? Explain your reasoning.” (Yes, sample 6 has a wide range of data ranging from a 1 year old to a 56 year old, but most of the data are around 10, so median might be better to use for that sample.)
- “A lot of families might be watching ‘Learning to Read’ with their children or older people may be using the show to learn English. How might this affect the mean? How could you recognize that there are two main age groups that watch this show?” (It would bring the mean up from just the kids who watch the show. The mean would not make the two age groups obvious, so looking at a dot plot or histogram might be more helpful with this group.)
15.4: Movie Reviews (10 minutes)
Activity
In this activity, students use data from a sample of movie reviews to estimate information about all the reviews for the movie. Based on the distribution of the data, students are asked to choose an appropriate measure of center and measure of variation then apply their calculations to the entire population. Finally, students gauge their trust in the measure of center they have chosen based on the associate measure of variation.
Launch
Keep students in groups of 3. Allow students 5 minutes work time in their groups followed by a whole-class discussion.
It may be helpful to use the warm-up for this lesson to review how to choose mean and median based on the distribution of data.
Design Principle(s): Optimize output (for justification); Maximize meta-awareness
Student Facing
A movie rating website has many people rate a new movie on a scale of 0 to 100. Here is a dot plot showing a random sample of 20 of these reviews.

- Would the mean or median be a better measure for the center of this data? Explain your reasoning.
- Use the sample to estimate the measure of center that you chose for all the reviews.
- For this sample, the mean absolute deviation is 19.6, and the interquartile range is 15. Which of these values is associated with the measure of center that you chose?
- Movies must have an average rating of 75 or more from all the reviews on the website to be considered for an award. Do you think this movie will be considered for the award? Use the measure of center and measure of variability that you chose to justify your answer.
Student Response
For access, consult one of our IM Certified Partners.
Student Facing
Are you ready for more?
Estimate typical temperatures in the United States today by looking up current temperatures in several places across the country. Use the data you collect to decide on the appropriate measure of center for the country, and calculate the related measure of variation for your sample.
Student Response
For access, consult one of our IM Certified Partners.
Activity Synthesis
The purpose of the discussion is for students to review how to choose a measure of center and its associated measure of variation. Additionally, students use the measure of variation to help them think about how much to trust their population characteristic estimate.
Consider asking these discussion questions:
- “Which measure of center did you choose and why?” (Median, since the distribution is not symmetric.)
- “Based on the context, do you think other movie reviews would have non-symmetric distributions as well?” (Yes, usually a lot of people will agree whether a movie is good or bad, but a few people will have strong opinions on the other end of the scale.)
- “A random sample of 20 reviews for another movie has a median of 90 as well, but its IQR is 30. Do you think this movie is more or less likely to be considered for the award?” (Less likely since there is more variability in the sample, so it is harder to estimate the median for all of the reviews.)
- “A random sample of 20 reviews for a third movie has a median of 50 and an IQR of 20. Is it possible this third movie will be considered for an award?” (It seems unlikely, but it is possible. The random sample may have randomly selected the 20 worst reviews and all the other reviews gave it a 100 rating.)
Supports accessibility for: Conceptual processing; Organization
Lesson Synthesis
Lesson Synthesis
Consider asking these discussion questions to review the main ideas from the lesson:
- “How do you determine which measure of center will best describe the data in a sample?” (Base it on the distribution of the data.)
- “When you have the data from a sample, how can you estimate the value of a measure of center for the population?” (If the sample is random, calculate the appropriate measure of center for the sample and use that to estimate the same characteristic for the population.)
- “What does the variability of the sample tell you about your estimate for the measure of center of the population?” (The greater the variability, the less certain I am of the estimate. If the data is spread widely in the sample, it might be spread even more widely in the population and this sample may not capture everything going on in the population, so the estimate may not be very accurate.)
15.5: Cool-down - More Accurate Estimate (5 minutes)
Cool-Down
For access, consult one of our IM Certified Partners.
Student Lesson Summary
Student Facing
Some populations have greater variability than others. For example, we would expect greater variability in the weights of dogs at a dog park than at a beagle meetup.
Dog park:
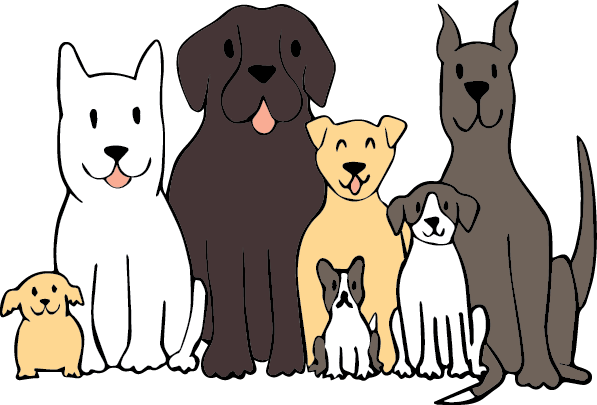
Mean weight: 12.8 kg MAD: 2.3 kg
Beagle meetup:
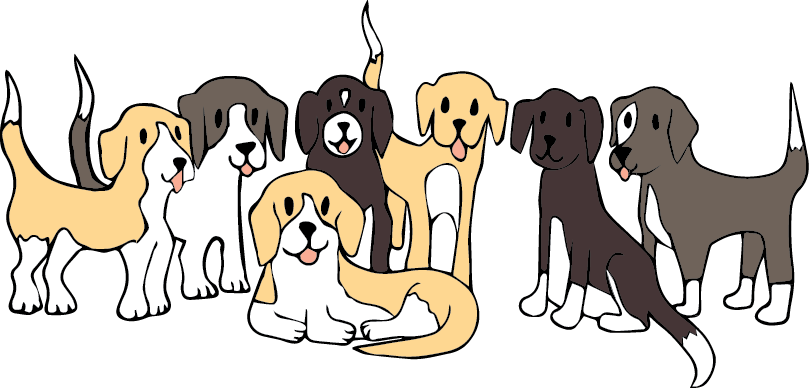
Mean weight: 10.1 kg MAD: 0.8 kg
The lower MAD indicates there is less variability in the weights of the beagles. We would expect that the mean weight from a sample that is randomly selected from a group of beagles will provide a more accurate estimate of the mean weight of all the beagles than a sample of the same size from the dogs at the dog park.
In general, a sample of a similar size from a population with less variability is more likely to have a mean that is close to the population mean.