Lesson 14
Sampling in a Fair Way
14.1: Ages of Moviegoers (5 minutes)
Warm-up
The purpose of this warm-up is for students to begin to see that different samples are more or less representative of the population from which they are drawn. Students are asked to look at a dot plot and reason about the context of the sample by matching it to their expectations about what the population should be.
Launch
Arrange students in groups of 2. Give students 1 minute of quiet think time, and then 1 minute to discuss the things they notice with their partner, followed by a whole-class discussion.
Student Facing
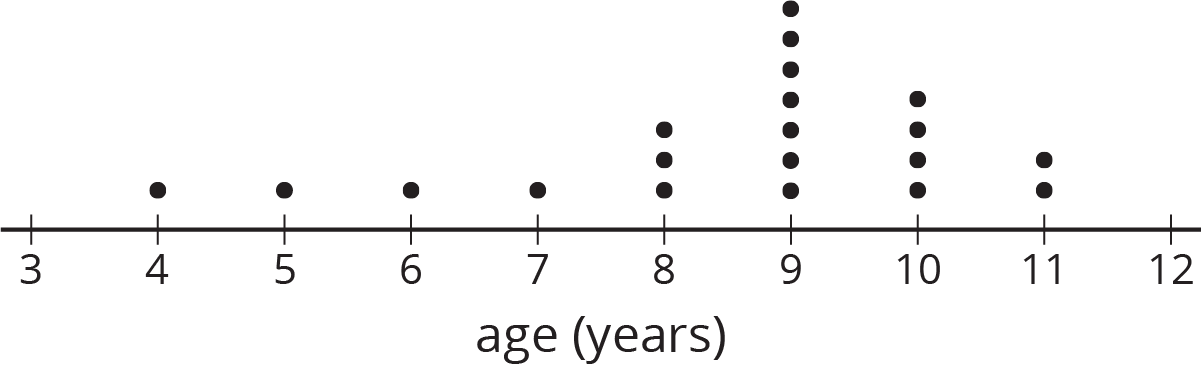
A survey was taken at a movie theater to estimate the average age of moviegoers.
Here is a dot plot showing the ages of the first 20 people surveyed.
- What questions do you have about the data from survey?
- What assumptions would you make based on these results?
Student Response
For access, consult one of our IM Certified Partners.
Activity Synthesis
The purpose of the discussion is for students to express their expectations for who would be at the movie theater and whether this group represents that expectation.
Ask several students to report any questions or assumptions they have about the information provided. If possible, display the dot plot so that students can refer to it while giving their answers.
14.2: Comparing Methods for Selecting Samples (10 minutes)
Activity
In the previous lesson, students learned that it is very difficult to select representative samples when the population data is unknown. In this lesson, students learn that often the best we can do to select a representative sample is to avoid sampling methods that will be inherently biased one way or another (MP7). A randomly selected sample is not guaranteed to be representative of the population, but other methods are often biased and thus tend to produce samples that are not representative of the population.
Launch
Arrange students in groups of 2. Give students 5 minutes of partner work time followed by a whole-class discussion.
Supports accessibility for: Organization; Attention
Student Facing
Take turns with your partner reading each option aloud. For each situation, discuss:
- Would the different methods for selecting a sample lead to different conclusions about the population?
- What are the benefits of each method?
- What might each method overlook?
- Which of the methods listed would be the most likely to produce samples that are representative of the population being studied?
- Can you think of a better way to select a sample for this situation?
-
Lin is running in an election to be president of the seventh grade. She wants to predict her chances of winning. She has the following ideas for surveying a sample of the students who will be voting:
-
Ask everyone on her basketball team who they are voting for.
-
Ask every third girl waiting in the lunch line who they are voting for.
-
Ask the first 15 students to arrive at school one morning who they are voting for.
-
-
A nutritionist wants to collect data on how much caffeine the average American drinks per day. She has the following ideas for how she could obtain a sample:
-
Ask the first 20 adults who arrive at a grocery store after 10:00 a.m. about the average amount of caffeine they consume each day.
-
Every 30 minutes, ask the first adult who comes into a coffee shop about the average amount of caffeine they consume each day.
-
Student Response
For access, consult one of our IM Certified Partners.
Activity Synthesis
The purpose of the discussion is for students to understand that some methods of sampling are better than others. Although there may be no way to guarantee that a sample is representative of the population, we can certainly avoid methods that will definitely result in some groups being over- or under-represented.
Poll the class on which of the given methods is best for each scenario. Record these answers for all to see.
Select several students to explain benefits and drawbacks of each of the sampling methods. After each method has been analyzed for a situation, ask if students have ideas for better ways to get a representative sample for the situation.
Ask students, “What are some important things to consider when getting a sample?” (Is there a group that this method will show preference for? Is there a group that will automatically be left out of my sample based on the method? If there are groups I didn’t even think about, does my method have a way of reaching them?)
Explain: People often have biases that may lead them to over- or under-represent some groups in their samples whether the biases are obvious or not. For example, if you want to send a survey out for people to respond to questions, you may not reach people who do not have email addresses. Due to the (sometimes hidden) biases, the best method for selecting samples is to remove as much of the personal selection as possible. In the rest of this lesson, we will explore methods for generating samples that avoid biases.
14.3: That’s the First Straw (10 minutes)
Activity
In the previous activity, students saw that some methods for taking samples are more likely to produce samples that are not representative of the population than others. In this activity, students see an example of a hidden bias. Although the method of selecting straws by taking out the first one in the bag touched appears fair and random, it produces samples that are not representative of the population (MP1). In the next activity, students explore ways to resolve the problem by finding other methods of selecting a sample that would be fair for this same context.
Launch
Arrange students in groups of 2.
In an opaque bag, include straws cut into 35 pieces according to the table.
| length of straw in inches | \(\frac{1}{2}\) | 1 | 2 | 3 | 4 | 5 |
|---|---|---|---|---|---|---|
| number of straws | 6 | 6 | 8 | 6 | 5 | 4 |
Select 5 students to help with a demonstration. One at a time, each student will reach into the bag and remove the first straw piece they touch. They should measure the straw piece to the nearest half inch and announce the value to the class for them to record. Return the straw to the bag and shake the bag. Give the bag to the next student to repeat these steps.
After the class has recorded the 5 lengths, repeat the demonstration and add the second set of 5 straw lengths to the second row of the table in this activity.
Note: Taking out the first one the student touches rather than reaching around in the bag is important for this task.
Following the demonstration, give students partner work time followed by a whole-class discussion.
Supports accessibility for: Memory; Conceptual processing
Student Facing
Your teacher will have some students draw straws from a bag.
- As each straw is taken out and measured, record its length (in inches) in the table.
straw 1 straw 2 straw 3 straw 4 straw 5 sample 1 sample 2 -
Estimate the mean length of all the straws in the bag based on:
-
the mean of the first sample.
-
the mean of the second sample.
-
- Were your two estimates the same? Did the mean length of all the straws in the bag change in between selecting the two samples? Explain your reasoning.
- The actual mean length of all of the straws in the bag is about 2.37 inches. How do your estimates compare to this mean length?
- If you repeated the same process again but you selected a larger sample (such as 10 or 20 straws, instead of just 5), would your estimate be more accurate? Explain your reasoning.
Student Response
For access, consult one of our IM Certified Partners.
Activity Synthesis
Ask students:
- “What would it mean for a process of selecting straws to be ‘fair?’” (There should be an equal chance for each item to be selected.)
- “Was this selection process fair?” (No, the shorter pieces probably fell to the bottom of the bag and were less likely to be touched first.)
Reveal the contents of the bag.
- “Were your samples representative of the contents of the bag? Explain your reasoning.”
- “Did every straw in the bag have an equal chance of being selected?” (Longer straws were probably touched first so they were probably over represented in our sample.)
- “If we increased the sample size to 10, would that make the sample more representative?” (No, in fact, it may increase the over-representation of the longer straws and be even more misleading.)
Tell students that a larger sample does not help the estimate if the selection process is flawed. For example, if someone uses the heights of 40 basketball players instead of only 20 basketball players to determine average height of everyone in the United States, the larger sample probably does not represent the population any better.
Explain: Although the process may seem random since we took out as much of the human element of the choosing process as possible, the longer straws were over-represented in our samples. It is important to try to anticipate all the different ways that the selection process might be biased to avoid it as much as possible.
Design Principle(s): Support sense-making; Cultivate conversation
14.4: That's the Last Straw (10 minutes)
Activity
In the previous activity, students selected straws using a method that might have seemed fair at first, but did not produce a representative sample since the method was flawed. In this activity, students determine whether alternate methods of selecting items for a sample from the same population are fair (MP3). For the methods that work, the physical objects are linked with numerical values to remove even more of the bias toward selecting certain objects more often than others.
Launch
Tell students that the straws from the previous task are ordered and numbered with 1 representing the shortest straw and 35 representing the longest. Display the table for all to see.
| straw number | length (inches) |
|---|---|
| 1 | 0.5 |
| 2 | 0.5 |
| 3 | 0.5 |
| 4 | 0.5 |
| 5 | 0.5 |
| 6 | 0.5 |
| 7 | 1.0 |
| 8 | 1.0 |
| 9 | 1.0 |
| 10 | 1.0 |
| 11 | 1.0 |
| 12 | 1.0 |
| 13 | 2.0 |
| 14 | 2.0 |
| 15 | 2.0 |
| 16 | 2.0 |
| 17 | 2.0 |
| 18 | 2.0 |
| 19 | 2.0 |
| 20 | 2.0 |
| 21 | 3.0 |
| 22 | 3.0 |
| 23 | 3.0 |
| 24 | 3.0 |
| 25 | 3.0 |
| 26 | 3.0 |
| 27 | 4.0 |
| 28 | 4.0 |
| 29 | 4.0 |
| 30 | 4.0 |
| 31 | 4.0 |
| 32 | 5.0 |
| 33 | 5.0 |
| 34 | 5.0 |
| 35 | 5.0 |
Before beginning the task, ask students:
- “What would it mean for the sampling method to be fair?” (Each item has an equal chance of being selected.)
- “Can you think of a way of sampling the straws that would be fair?” (It is OK for students to struggle with answering this question at this stage.)
Following the discussion, allow students quiet work time followed by a whole-class discussion.
Supports accessibility for: Visual-spatial processing; Conceptual processing
Design Principle(s): Support sense-making; Maximize meta-awareness
Student Facing
There were a total of 35 straws in the bag. Suppose we put the straws in order from shortest to longest and then assigned each straw a number from 1 to 35. For each of these methods, decide whether it would be fair way to select a sample of 5 straws. Explain your reasoning.
-
Select the straws numbered 1 through 5.
-
Write the numbers 1 through 35 on pieces of paper that are all the same size. Put the papers into a bag. Without looking, select five papers from the bag. Use the straws with those numbers for your sample.
-
Using the same bag as the previous question, select one paper from the bag. Use the number on that paper to select the first straw for your sample. Then use the next 4 numbers in order to complete your sample. (For example, if you select number 17, then you also use straws 18, 19, 20, and 21 for your sample.)
- Create a spinner with 35 sections that are all the same size, and number them 1 through 35. Spin the spinner 5 times and use the straws with those numbers for your sample.
Student Response
For access, consult one of our IM Certified Partners.
Student Facing
Are you ready for more?
Computers accept inputs, follow instructions, and produce outputs, so they cannot produce truly random numbers. If you knew the input, you could predict the output by following the same instructions the computer is following. When truly random numbers are needed, scientists measure natural phenomena such as radioactive decay or temperature variations. Before such measurements were possible, statisticians used random number tables, like this:

Use this table to select a sample of 5 straws. Pick a starting point at random in the table. If the number is between 01 and 35, include that number straw in your sample. If the number has already been selected, or is not between 01 and 35, ignore it, and move on to the next number.
Student Response
For access, consult one of our IM Certified Partners.
Activity Synthesis
Define random sample: A random sample from a population is a sample that is selected in a way that gives every different possible sample of the same size an equal chance of being the sample selected.
- “Which of the four methods proposed would be a random sample?” (Putting the papers in the bag or using the spinner.)
- “Would the techniques described here work for other situations in which you wanted a sample? For example, to select 50 people in a large city to represent the views of the city residents.” (Although they would work in theory for large populations, it would be too time consuming to write over a million numbers (or names) on pieces of paper and put them in a bag. Similarly, a spinner that is divided into a million sections would be difficult to manage. Computers can be used to generate random numbers for larger populations.)
- “The most common straw in the bag was the 2 inch straw. When selecting one of the straw numbers (not lengths) at random, what is the probability of selecting a 2 inch straw?” (\(\frac{8}{35}\) since there are 8 straws that are 2 inches long and 35 total straws.)
Explain:
- A representative sample would have more of the more common lengths, and there is also a higher probability of selecting these lengths, so a random selection should be a good way to select a representative sample.
- A random sample does not guarantee a representative sample, but it avoids methods that might over- or under-represent items of the population. Since we do not know the data for the population, a random sample usually provides the best opportunity to get a representative sample.
- While it is the most ideal method, it is not always possible to generate a random sample. For example, if you wanted to know the average size of salmon in the wild, it is impossible to know how many there are, much less identify them individually, select a few at random from the list, then capture and measure those exact individuals. In these cases, it is important to try to intentionally reduce bias as much as possible when selecting the sample.
Lesson Synthesis
Lesson Synthesis
Consider asking these discussion questions:
- “What makes a sample selected at random the best way to select individuals for a sample?” (It avoids biases that might be introduced using other methods.)
- “As part of an English project, you want to look at the length of lines in Shakespeare’s plays. What are some methods of selecting a random sample of lines from these plays?” (Assign each line in the plays a number and use a computer to select several random numbers that correspond to the lines.)
14.5: Cool-down - Sampling Spinach (5 minutes)
Cool-Down
For access, consult one of our IM Certified Partners.
Student Lesson Summary
Student Facing
A sample is selected at random from a population if it has an equal chance of being selected as every other sample of the same size. For example, if there are 25 students in a class, then we can write each of the students' names on a slip of paper and select 5 papers from a bag to get a sample of 5 students selected at random from the class.
Other methods of selecting a sample from a population are likely to be biased. This means that it is less likely that the sample will be representative of the population as a whole. For example, if we select the first 5 students who walk in the door, that will not give us a random sample because students who typically come late are not likely to be selected. A sample that is selected at random may not always be a representative sample, but it is more likely to be representative than using other methods.
It is not always possible to select a sample at random. For example, if we want to know the average length of wild salmon, it is not possible to identify each one individually, select a few at random from the list, and then capture and measure those exact fish. When a sample cannot be selected at random, it is important to try to reduce bias as much as possible when selecting the sample.