Lesson 18
Comparing Populations Using Samples
Let’s compare different populations using samples.
18.1: Same Mean? Same MAD?
Without calculating, tell whether each pair of data sets have the same mean and whether they have the same mean absolute deviation.
-
set A
1
3
3
5
6
8
10
14
set B
21
23
23
25
26
28
30
34
-
set X
1
2
3
4
5
set Y
1
2
3
4
5
6
-
set P
47
53
58
62
set Q
37
43
68
72
18.2: With a Heavy Load
Consider the question: Do tenth-grade students' backpacks generally weigh more than seventh-grade students' backpacks?
Here are dot plots showing the weights of backpacks for a random sample of students from these two grades:
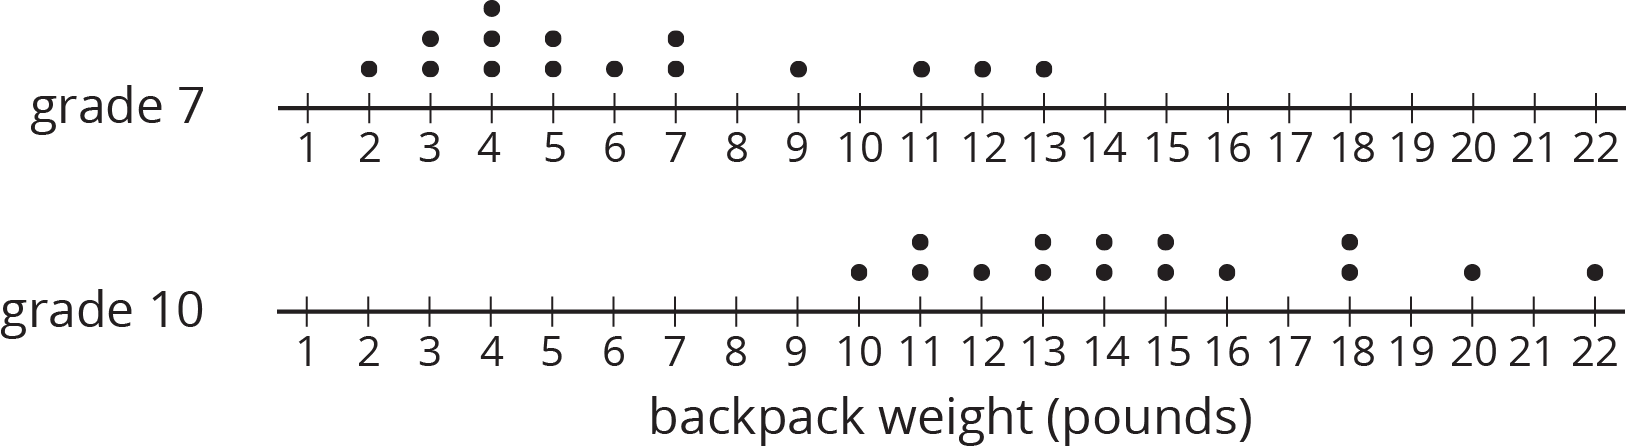
- Did any seventh-grade backpacks in this sample weigh more than a tenth-grade backpack?
-
The mean weight of this sample of seventh-grade backpacks is 6.3 pounds. Do you think the mean weight of backpacks for all seventh-grade students is exactly 6.3 pounds?
- The mean weight of this sample of tenth-grade backpacks is 14.8 pounds. Do you think there is a meaningful difference between the weight of all seventh-grade and tenth-grade students' backpacks? Explain or show your reasoning.
18.3: Do They Carry More?
Here are 10 more random samples of seventh-grade students' backpack weights.

| sample number |
mean weight (pounds) |
|---|---|
| 1 | 5.8 |
| 2 | 9.2 |
| 3 | 5.5 |
| 4 | 7.3 |
| 5 | 7.2 |
| 6 | 6.6 |
| 7 | 5.2 |
| 8 | 5.3 |
| 9 | 6.3 |
| 10 | 6.4 |
-
- Which sample has the highest mean weight?
- Which sample has the lowest mean weight?
- What is the difference between these two sample means?
- All of the samples have a mean absolute deviation of about 2.8 pounds. Express the difference between the highest and lowest sample means as a multiple of the MAD.
- Are these samples very different? Explain or show your reasoning.
-
Remember our sample of tenth-grade students' backpacks had a mean weight of 14.8 pounds. The MAD for this sample is 2.7 pounds. Your teacher will assign you one of the samples of seventh-grade students' backpacks to use.
- What is the difference between the sample means for the the tenth-grade students' backpacks and the seventh-grade students' backpacks?
- Express the difference between these two sample means as a multiple of the larger of the MADs.
- Do you think there is a meaningful difference between the weights of all seventh-grade and tenth-grade students' backpacks? Explain or show your reasoning.
18.4: Steel from Different Regions
When anthropologists find steel artifacts, they can test the amount of carbon in the steel to learn about the people that made the artifacts. Here are some box plots showing the percentage of carbon in samples of steel that were found in two different regions:

-
Was there any steel found in region 1 that had:
- more carbon than some of the steel found in region 2?
- less carbon than some of the steel found in region 2?
-
Do you think there is a meaningful difference between all the steel artifacts found in regions 1 and 2?
- Which sample has a distribution that is not approximately symmetric?
-
What is the difference between the sample medians for these two regions?
sample
median (%)IQR
(%)region 1 0.64 0.05 region 2 0.47 0.03 - Express the difference between these two sample medians as a multiple of the larger interquartile range.
-
The anthropologists who conducted the study concluded that there was a meaningful difference between the steel from these regions. Do you agree? Explain or show your reasoning.
Summary
Sometimes we want to compare two different populations. For example, is there a meaningful difference between the weights of pugs and beagles? Here are histograms showing the weights for a sample of dogs from each of these breeds:
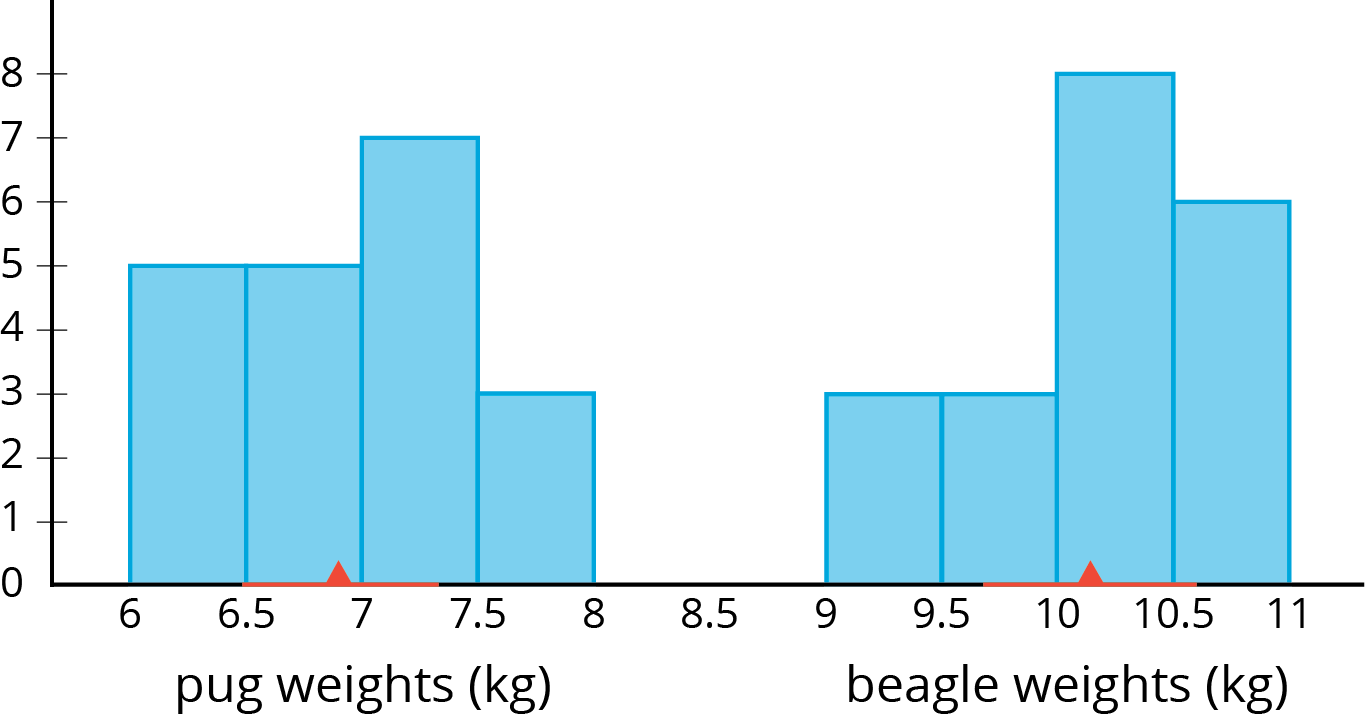
The red triangles show the mean weight of each sample, 6.9 kg for the pugs and 10.1 kg for the beagles. The red lines show the weights that are within 1 MAD of the mean. We can think of these as “typical” weights for the breed. These typical weights do not overlap. In fact, the distance between the means is \(10.1-6.9 \) or 3.2 kg, over 6 times the larger MAD! So we can say there is a meaningful difference between the weights of pugs and beagles.
Is there a meaningful difference between the weights of male pugs and female pugs? Here are box plots showing the weights for a sample of male and female pugs:
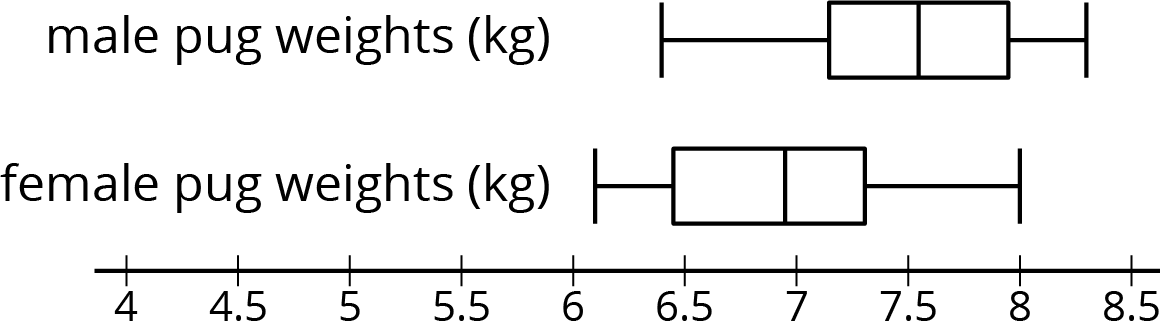
We can see that the medians are different, but the weights between the first and third quartiles overlap. Based on these samples, we would say there is not a meaningful difference between the weights of male pugs and female pugs.
In general, if the measures of center for two samples are at least two measures of variability apart, we say the difference in the measures of center is meaningful. Visually, this means the range of typical values does not overlap. If they are closer, then we don't consider the difference to be meaningful.
Glossary Entries
- interquartile range (IQR)
The interquartile range is one way to measure how spread out a data set is. We sometimes call this the IQR. To find the interquartile range we subtract the first quartile from the third quartile.
For example, the IQR of this data set is 20 because \(50-30=20\).
22 29 30 31 32 43 44 45 50 50 59 Q1 Q2 Q3 - proportion
A proportion of a data set is the fraction of the data in a given category.
For example, a class has 20 students. There are 2 left-handed students and 18 right-handed students in the class. The proportion of students who are left-handed is \(\frac{2}{20}\), or 0.1.