Lesson 14
Sampling in a Fair Way
Let’s explore ways to get representative samples.
14.1: Ages of Moviegoers
A survey was taken at a movie theater to estimate the average age of moviegoers.
Here is a dot plot showing the ages of the first 20 people surveyed.
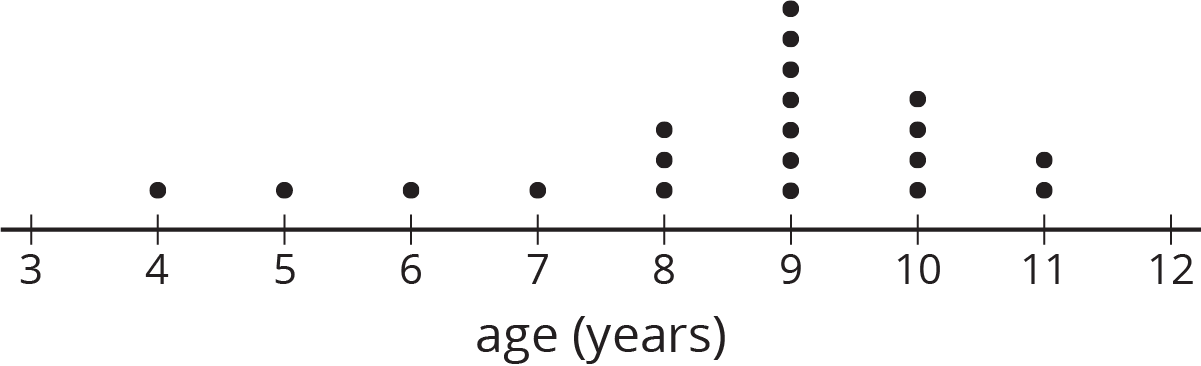
- What questions do you have about the data from survey?
- What assumptions would you make based on these results?
14.2: Comparing Methods for Selecting Samples
Take turns with your partner reading each option aloud. For each situation, discuss:
- Would the different methods for selecting a sample lead to different conclusions about the population?
- What are the benefits of each method?
- What might each method overlook?
- Which of the methods listed would be the most likely to produce samples that are representative of the population being studied?
- Can you think of a better way to select a sample for this situation?
-
Lin is running in an election to be president of the seventh grade. She wants to predict her chances of winning. She has the following ideas for surveying a sample of the students who will be voting:
-
Ask everyone on her basketball team who they are voting for.
-
Ask every third girl waiting in the lunch line who they are voting for.
-
Ask the first 15 students to arrive at school one morning who they are voting for.
-
-
A nutritionist wants to collect data on how much caffeine the average American drinks per day. She has the following ideas for how she could obtain a sample:
-
Ask the first 20 adults who arrive at a grocery store after 10:00 a.m. about the average amount of caffeine they consume each day.
-
Every 30 minutes, ask the first adult who comes into a coffee shop about the average amount of caffeine they consume each day.
-
14.3: That’s the First Straw
Your teacher will have some students draw straws from a bag.
- As each straw is taken out and measured, record its length (in inches) in the table.
straw 1 straw 2 straw 3 straw 4 straw 5 sample 1 sample 2 -
Estimate the mean length of all the straws in the bag based on:
-
the mean of the first sample.
-
the mean of the second sample.
-
- Were your two estimates the same? Did the mean length of all the straws in the bag change in between selecting the two samples? Explain your reasoning.
- The actual mean length of all of the straws in the bag is about 2.37 inches. How do your estimates compare to this mean length?
- If you repeated the same process again but you selected a larger sample (such as 10 or 20 straws, instead of just 5), would your estimate be more accurate? Explain your reasoning.
14.4: That's the Last Straw
There were a total of 35 straws in the bag. Suppose we put the straws in order from shortest to longest and then assigned each straw a number from 1 to 35. For each of these methods, decide whether it would be fair way to select a sample of 5 straws. Explain your reasoning.
-
Select the straws numbered 1 through 5.
-
Write the numbers 1 through 35 on pieces of paper that are all the same size. Put the papers into a bag. Without looking, select five papers from the bag. Use the straws with those numbers for your sample.
-
Using the same bag as the previous question, select one paper from the bag. Use the number on that paper to select the first straw for your sample. Then use the next 4 numbers in order to complete your sample. (For example, if you select number 17, then you also use straws 18, 19, 20, and 21 for your sample.)
- Create a spinner with 35 sections that are all the same size, and number them 1 through 35. Spin the spinner 5 times and use the straws with those numbers for your sample.
Computers accept inputs, follow instructions, and produce outputs, so they cannot produce truly random numbers. If you knew the input, you could predict the output by following the same instructions the computer is following. When truly random numbers are needed, scientists measure natural phenomena such as radioactive decay or temperature variations. Before such measurements were possible, statisticians used random number tables, like this:

Use this table to select a sample of 5 straws. Pick a starting point at random in the table. If the number is between 01 and 35, include that number straw in your sample. If the number has already been selected, or is not between 01 and 35, ignore it, and move on to the next number.
Summary
A sample is selected at random from a population if it has an equal chance of being selected as every other sample of the same size. For example, if there are 25 students in a class, then we can write each of the students' names on a slip of paper and select 5 papers from a bag to get a sample of 5 students selected at random from the class.
Other methods of selecting a sample from a population are likely to be biased. This means that it is less likely that the sample will be representative of the population as a whole. For example, if we select the first 5 students who walk in the door, that will not give us a random sample because students who typically come late are not likely to be selected. A sample that is selected at random may not always be a representative sample, but it is more likely to be representative than using other methods.
It is not always possible to select a sample at random. For example, if we want to know the average length of wild salmon, it is not possible to identify each one individually, select a few at random from the list, and then capture and measure those exact fish. When a sample cannot be selected at random, it is important to try to reduce bias as much as possible when selecting the sample.
Video Summary
Glossary Entries
- mean
The mean is one way to measure the center of a data set. We can think of it as a balance point. For example, for the data set 7, 9, 12, 13, 14, the mean is 11.

To find the mean, add up all the numbers in the data set. Then, divide by how many numbers there are. \(7+9+12+13+14=55\) and \(55 \div 5 = 11\).
- mean absolute deviation (MAD)
The mean absolute deviation is one way to measure how spread out a data set is. Sometimes we call this the MAD. For example, for the data set 7, 9, 12, 13, 14, the MAD is 2.4. This tells us that these travel times are typically 2.4 minutes away from the mean, which is 11.

To find the MAD, add up the distance between each data point and the mean. Then, divide by how many numbers there are.
\(4+2+1+2+3=12\) and \(12 \div 5 = 2.4\)
- median
The median is one way to measure the center of a data set. It is the middle number when the data set is listed in order.
For the data set 7, 9, 12, 13, 14, the median is 12.
For the data set 3, 5, 6, 8, 11, 12, there are two numbers in the middle. The median is the average of these two numbers. \(6+8=14\) and \(14 \div 2 = 7\).
- population
A population is a set of people or things that we want to study.
For example, if we want to study the heights of people on different sports teams, the population would be all the people on the teams.
- representative
A sample is representative of a population if its distribution resembles the population's distribution in center, shape, and spread.
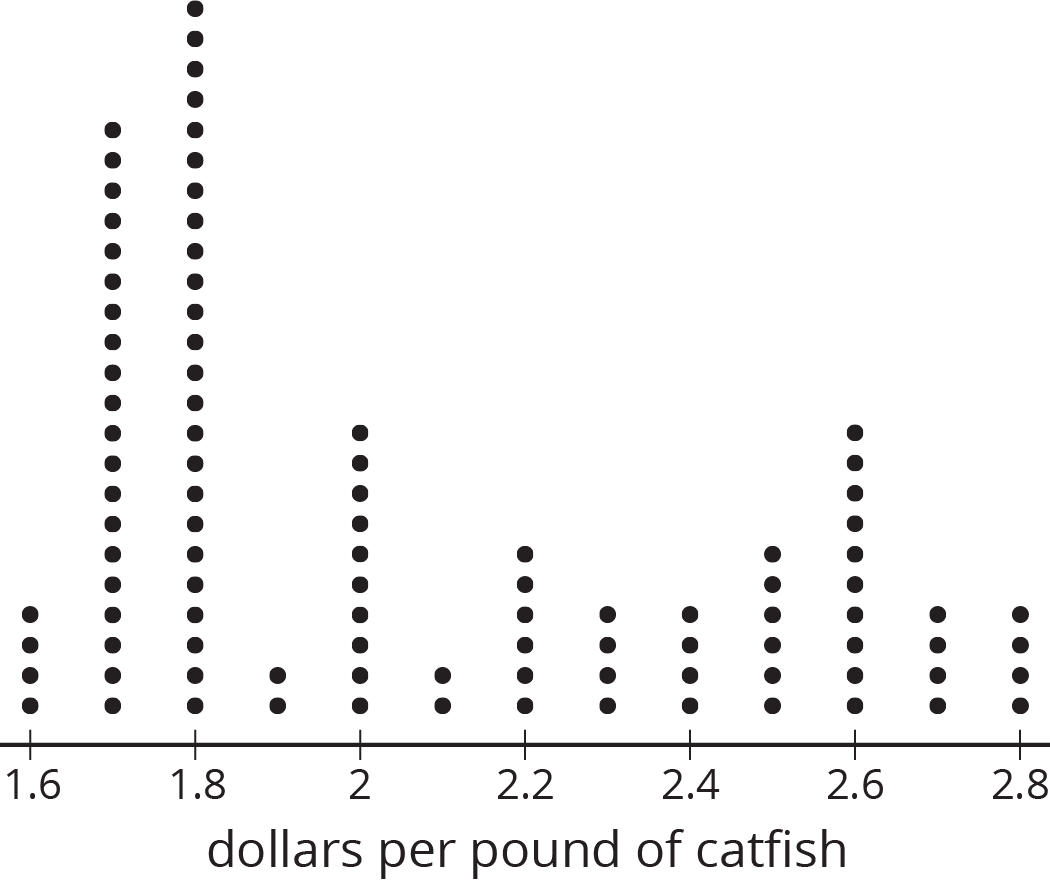
For example, this dot plot represents a population.
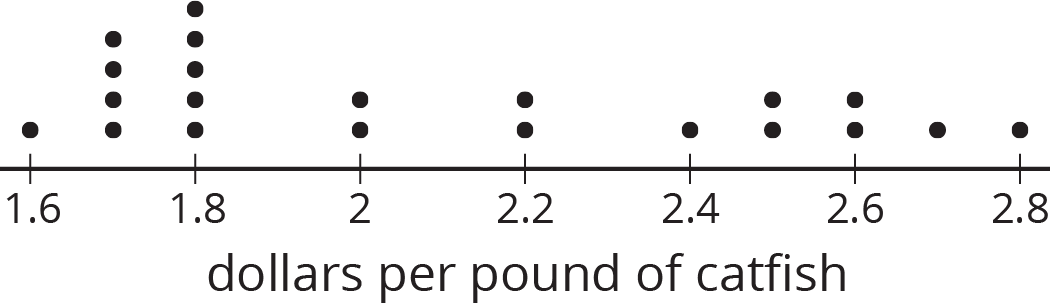
This dot plot shows a sample that is representative of the population.
- sample
A sample is part of a population. For example, a population could be all the seventh grade students at one school. One sample of that population is all the seventh grade students who are in band.