Lesson 8
Writing and Graphing Inequalities
8.1: Estimate Heights of People (5 minutes)
Warm-up
The purpose of this warm-up is for students to estimate heights and discuss their estimates using the language of inequalities.As students discuss their estimates with a partner, monitor the discussions and identify students who use different estimation strategies to share during the whole-class discussion.
Launch
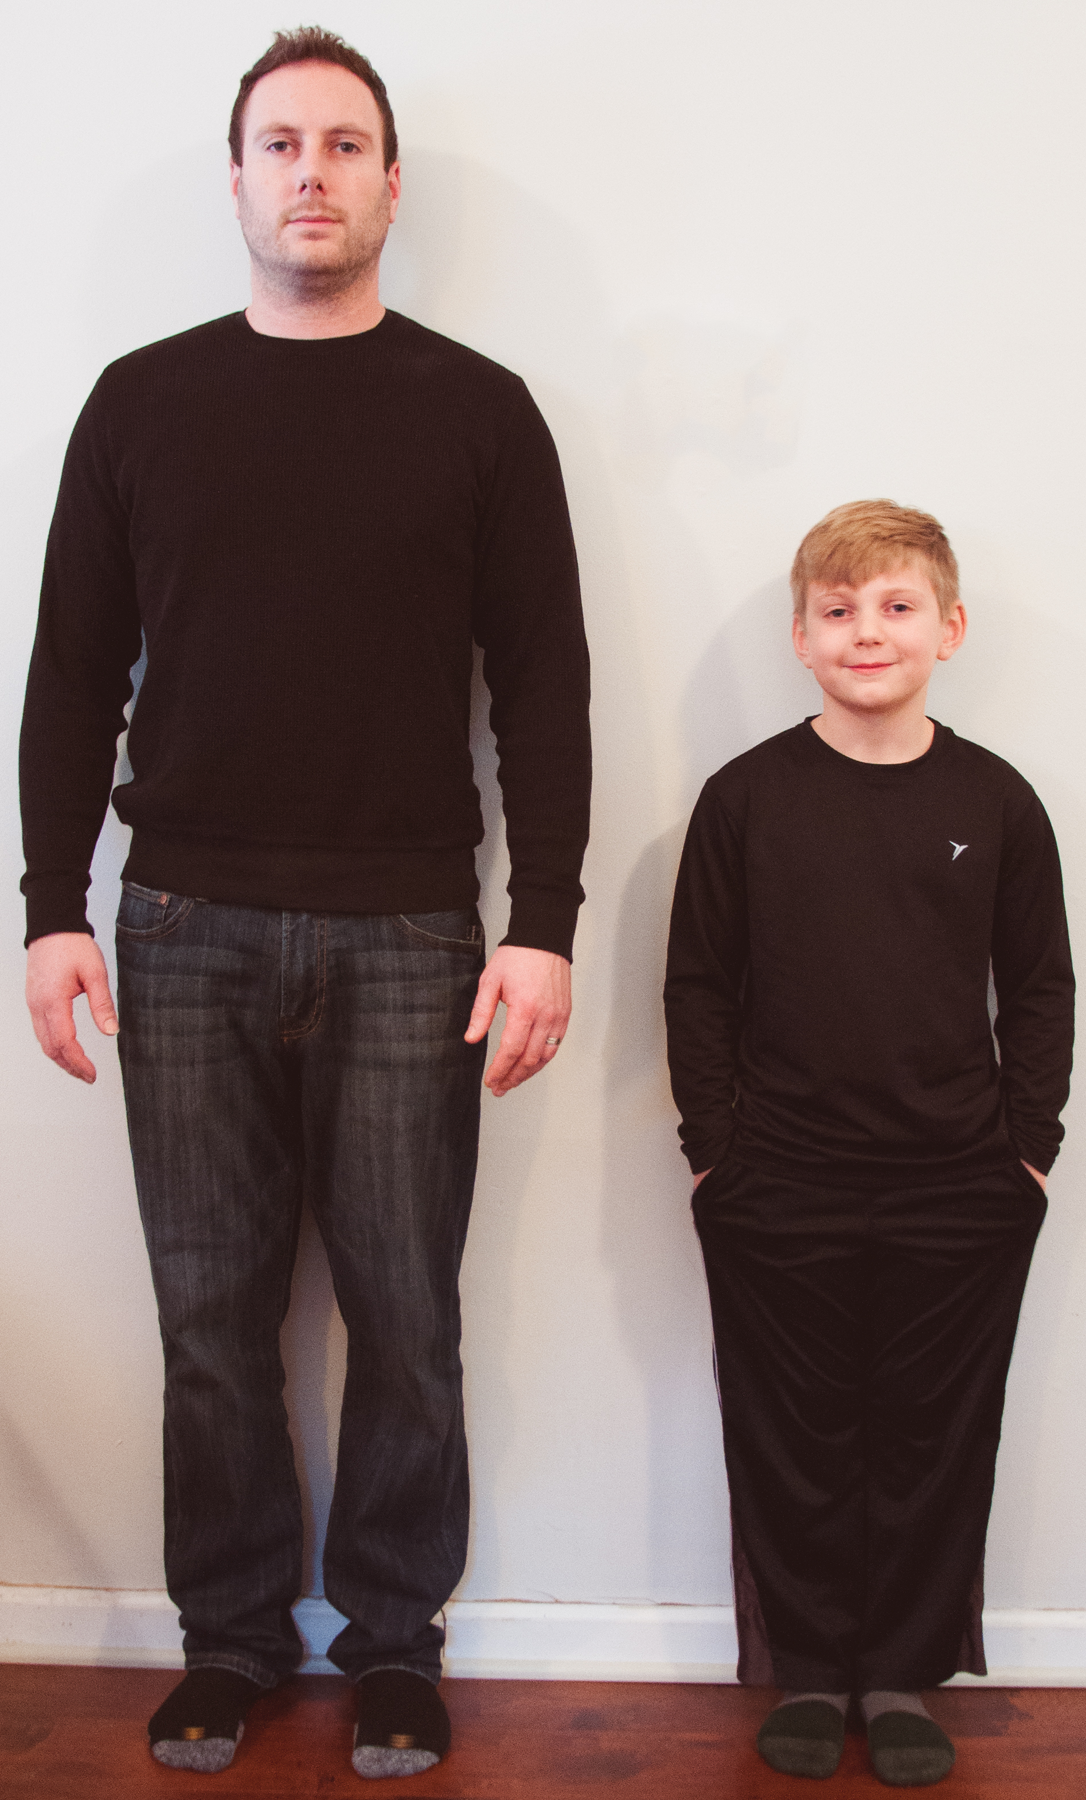
Arrange students in groups of 2. Give students 1 minute of quiet work time to complete the first question. Pause after the first question and ask students to share their responses. Record and display them for all to see. Tell students the height of the man in the pictures is 5 feet 10 inches and give them 1 minute to discuss the second question with their partner. Follow with a whole-class discussion focused on the second question.
Student Facing
-
Here is a picture of a man.

- Name a number, in feet, that is clearly too high for this man’s height.
- Name a number, in feet, that is clearly too low for his height.
- Make an estimate of his height.
Pause here for a class discussion.
-
Here is a picture of the same man standing next to a child.

If the man’s actual height is 5 feet 10 inches, what can you say about the height of the child in this picture?
Be prepared to explain your reasoning.
Student Response
For access, consult one of our IM Certified Partners.
Activity Synthesis
During the whole-class discussion, encourage students to use language such as “his height is more than . . . ” and “her height is less than . . . ” instead of “taller than . . .” and “shorter than . . . ” so they become familiar with the more precise language of inequalities.
Ask students to share their responses to the second question. As students share, ask them how to write their explanation as a sentence and inequality. For example, if students say, “The child is shorter than 5'10",” ask them how we could write that statement using “greater” or “less” and using an inequality. Record and display their responses for all to see. If students do not say, “The child’s height is less than 5'10" and \(h<5\text '10\text "\),” where \(h\) represents the child’s height, then make these statements explicit.
If there is time, ask students for the difference between their estimates and the actual heights.
8.2: Stories about 9 (15 minutes)
Activity
In this activity, students extend their understanding of inequality statements by considering an unknown quantity with one or more constraints in a real-world situation. Students represent situations with inequality statements and reason about possible values that make them true, showing the possibilities on a number line. They realize that these situations often have many values that make the inequality true, and often even an infinite number, making the number line representation of possible values very useful (MP7). Students examine the difference between solutions that are continuous (can take on any value, usually involving measurement of an amount) and those that are discrete (require whole number solutions because of the context, usually involving a count of people or objects) (MP2). They also consider when to include or exclude the endpoints. They learn how to represent this on the number line with a closed (include) or open (exclude) circle at the boundary of the constraint. Note that these materials don’t introduce \(\geq\) or \(\leq\) symbols until grade 7, but some individual teachers prefer to introduce them earlier.
Launch
Copy and cut up the blackline master. Make enough for each group of 2 students to have a set. Arrange students in groups of 2. Give each group 16 pre-cut slips and 6–8 minutes to complete the first question, which is to match each story and question to three ways to represent the solutions: a list or description, a number line, or an inequality statement. Ask each group to compare their matching decisions with another group and come to an agreement before recording their sorted representations.
Classes using the digital materials have an applet to match the story and question to two ways to represent the solutions: a list or description and a number line. Representation with an inequality is left to class discussion.
Supports accessibility for: Conceptual processing; Organization
Student Facing
- Drag the green and red open points over the blue points. Match each story with a numberline and a description.
- Think about how you would represent each set of numbers with an inequality statement, talk about it with your partner, and be prepared to discuss your ideas with the class. Then, record your final matching decisions here.
- A fishing boat can hold fewer than 9 people. How many people (\(x\)) can it hold?
-
Description or list:
- Number line:

-
Inequality:
-
- Lin needs more than 9 ounces of butter to make cookies for her party. How many ounces of butter (\(x\)) would be enough?
-
Description or list:
- Number line:

-
Inequality:
-
- A magician will perform her magic tricks only if there are at least 9 people in the audience. For how many people (\(x\)) will she perform her magic tricks?
-
Description or list:
- Number line:

-
Inequality:
-
- A food scale can measure up to 9 kilograms of weight. What weights (\(x\)) can the scale measure?
-
Description or list:
- Number line:

-
Inequality:
-
- A fishing boat can hold fewer than 9 people. How many people (\(x\)) can it hold?
Student Response
For access, consult one of our IM Certified Partners.
Launch
Copy and cut up the blackline master. Make enough for each group of 2 students to have a set. Arrange students in groups of 2. Give each group 16 pre-cut slips and 6–8 minutes to complete the first question, which is to match each story and question to three ways to represent the solutions: a list or description, a number line, or an inequality statement. Ask each group to compare their matching decisions with another group and come to an agreement before recording their sorted representations.
Classes using the digital materials have an applet to match the story and question to two ways to represent the solutions: a list or description and a number line. Representation with an inequality is left to class discussion.
Supports accessibility for: Conceptual processing; Organization
Student Facing
- Your teacher will give you a set of paper slips with four stories and questions involving the number 9. Match each question to three representations of the solution: a description or a list, a number line, or an inequality statement.
- Compare your matching decisions with another group's. If there are disagreements, discuss until both groups come to an agreement. Then, record your final matching decisions here.
-
A fishing boat can hold fewer than 9 people. How many people (\(x\)) can it hold?
-
Description or list:
- Number line:

- Inequality:
-
-
Lin needs more than 9 ounces of butter to make cookies for her party. How many ounces of butter (\(x\)) would be enough?
-
Description or list:
- Number line:

- Inequality:
-
-
A magician will perform her magic tricks only if there are at least 9 people in the audience. For how many people (\(x\)) will she perform her magic tricks?
-
Description or list:
- Number line:

- Inequality:
-
-
A food scale can measure up to 9 kilograms of weight. What weights (\(x\)) can the scale measure?
-
Description or list:
- Number line:

- Inequality:
-
-
Student Response
For access, consult one of our IM Certified Partners.
Activity Synthesis
Here are some topics for discussion:
- Differences between solutions to the people problem and the weight problem (continuous v. discrete).
- Inclusion and exclusion of 9 and how to distinguish them on the number line (including open and closed circle).
- The idea that there are many values that make these inequalities true. At times, there are an infinite number of values that make the inequality true.
- Advantages of using inequality statements or graphs instead of listing or describing the solutions.
There are some additional restrictions in some of the scenarios. For example, when counting people in a boat or measuring weight, zero is the least value that makes sense. For the people at the magic show and the amount of butter, very large numbers satisfy the inequalities; however, they don’t necessarily make sense in the contexts presented. These restrictions are not a focus for this activity, but they are likely to come up during the discussion.
Toward the end of the discussion, display the statement “Jada built a robot that pushes small boxes from one place to another. The robot is able to push up to 3 pounds. For what box weights (\(w\)) can the robot push the box?” Ask students to represent all possible answers in three ways:
- By listing or describing all numbers that answer the question. (Any weight that is equal to or less than 3 pounds.)
- By plotting or graphing the values that work on a number line. (Closed circle at 3 and shaded to the left.)
- By writing an inequality. (Using the given variable) (\(w<3\) and \(w=3\).)
Design Principle(s): Maximize meta-awareness
8.3: How High and How Low Can It Be? (15 minutes)
Activity
The purpose of this task is to extend the use of inequalities to describe maximum and minimum possible values, using symbols and determining whether or not a particular value makes an inequality true. Though students are thinking about whether or not a particular value makes an inequality true, the term “solution” will not be formally introduced until a future lesson.
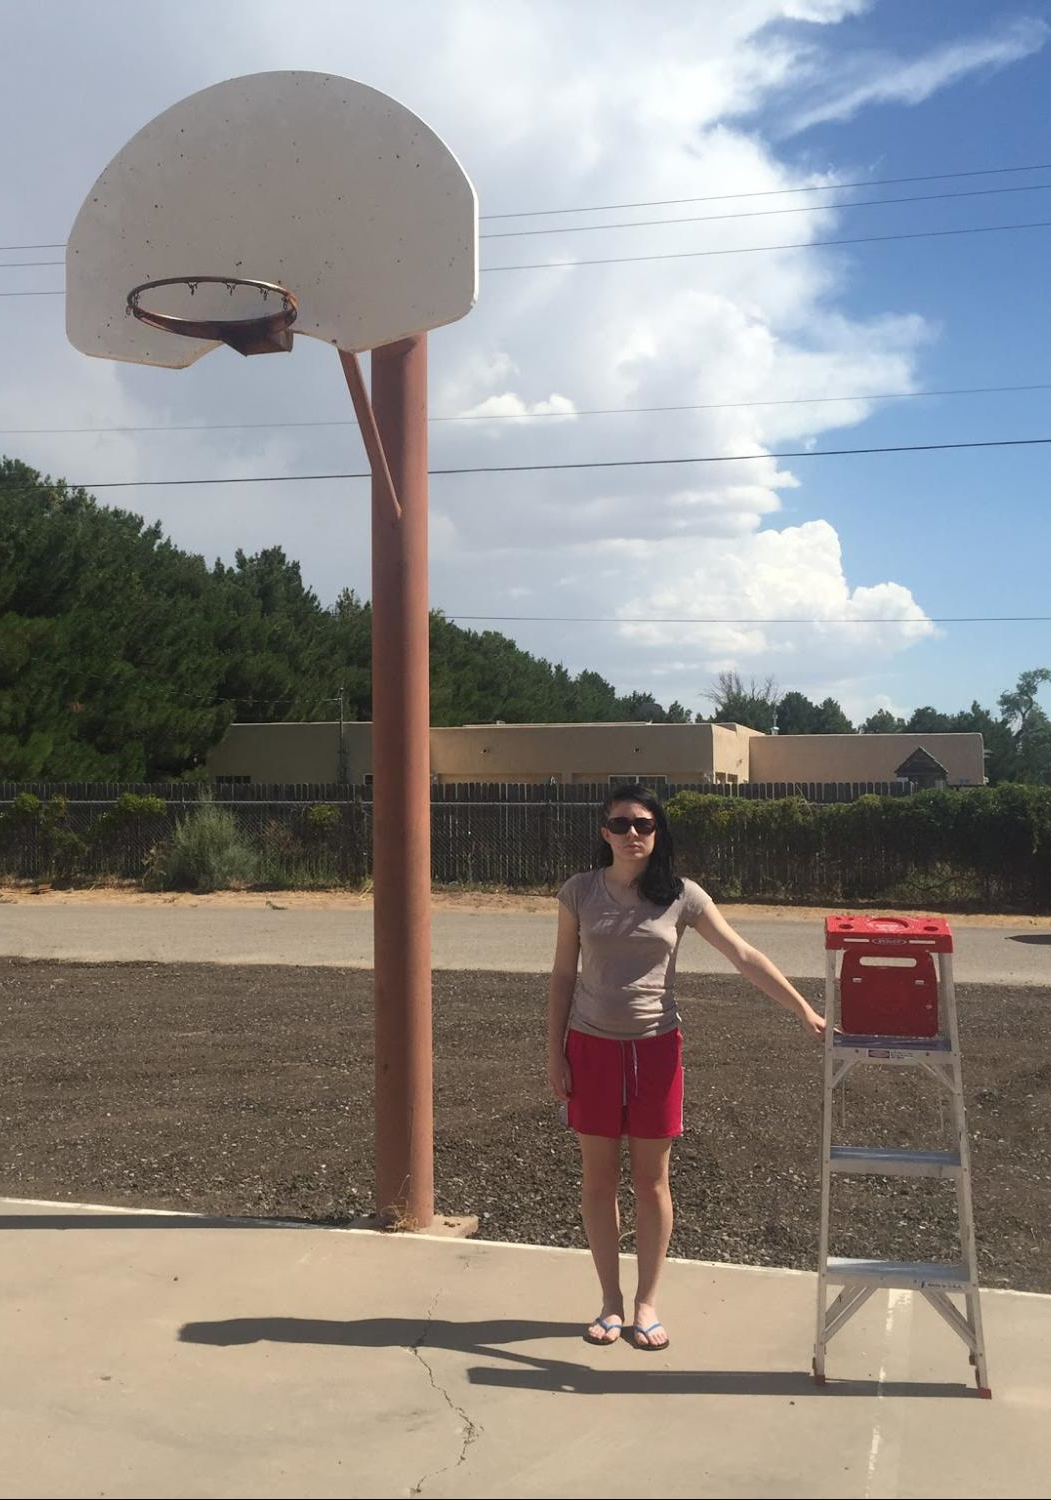
Students will estimate the maximum and minimum height of a basketball hoop in a given picture. They will then explore how inequalities with these 2 values, the maximum and minimum, can describe the restrictions and possible heights for the hoop. The inequalities are represented as symbolic statements as well as on number lines.
Once they have created inequalities, students will decide if a given value could be a possible height for the hoop. For the last question, students work with a partner so each will have a chance to check a possible solution to an inequality that they didn’t estimate and write themselves.
Launch
Arrange students in groups of 2. Give students 8 minutes of quiet work time to complete questions 1 through 4 followed by 2 minutes partner discussion for question 5. Follow with whole-class discussion.
Supports accessibility for: Memory; Organization
Design Principle(s): Supporting sense-making
Student Facing
Here is a picture of a person and a basketball hoop. Based on the picture, what do you think are reasonable estimates for the maximum and minimum heights of the basketball hoop?
-
Complete the first blank in each sentence with an estimate, and the second blank with “taller” or “shorter.”

- I estimate the minimum height of the basketball hoop to be _________ feet; this means the hoop cannot be _____________ than this height.
- I estimate the maximum height of the basketball hoop to be _________ feet; this means the hoop cannot be _____________ than this height.
-
Write two inequalities—one to show your estimate for the minimum height of the basketball hoop, and another for the maximum height. Use an inequality symbol and the variable \(h\) to represent the unknown height.
-
Plot each estimate for minimum or maximum value on a number line.
- Minimum:

- Maximum:

- Minimum:
- Suppose a classmate estimated the value of \(h\) to be 19 feet. Does this estimate agree with your inequality for the maximum height? Does it agree with your inequality for the minimum height? Explain or show how you know.
- Ask a partner for an estimate of \(h\). Record the estimate and check if it agrees with your inequalities for maximum and minimum heights.
Student Response
For access, consult one of our IM Certified Partners.
Student Facing
Are you ready for more?
- Find 3 different numbers that \(a\) could be if \(|a| < 5\). Plot these points on the number line. Then plot as many other possibilities for \(a\) as you can.

- Find 3 different numbers that \(b\) could be if \(|b| > 3\). Plot these points on the number line. Then plot as many other possibilities for \(b\) as you can.

Student Response
For access, consult one of our IM Certified Partners.
Anticipated Misconceptions
Students may understand that maximum means the largest value but may have trouble with the concept that all other values are therefore less than the maximum. A similar misunderstanding may occur with the concept of minimum value. For these students, have a short conversation about their maximum and minimum height estimates and how those values restrict the possible heights of the hoop.
Activity Synthesis
The discussion should focus on the concepts of minimum and maximum. While students are not yet using the formal definition of “solutions to an inequality,” they are reasoning about whether a value makes an inequality statement true. A student’s estimated minimum is the least value that makes their inequality true. Similarly, their maximum is the greatest value that makes their inequality true.
Ask students to share their responses to question 5. Select one group to share an estimate that makes a particular inequality true and an estimate that makes the same inequality false. Ask students to describe the values that make both inequalities true at the same time. Record their responses and display for all to see. Include both inequality symbols and number line representations.
Lesson Synthesis
Lesson Synthesis
Ask students to think about situations where a quantity might have a maximum or minimum value (for example, the number of students in a class, the pounds of fruit purchased by the school cafeteria, the budget for a trip). Ask students to create a variable and represent the situation with an inequality statement using their variable. Ask them whether the maximum or minimum is included in the range of possible values of the variable (for example, does the number of students in a class have to be less than 30, or can it also be equal to 30?). Then ask them to graph the possible values on a number line. Invite selected students to share their situations, inequalities, and graphs.
8.4: Cool-down - A Box of Paper Clips (5 minutes)
Cool-Down
For access, consult one of our IM Certified Partners.
Student Lesson Summary
Student Facing
An inequality tells us that one value is less than or greater than another value.
Suppose we knew the temperature is less than \(3^\circ \text{F}\), but we don’t know exactly what it is. To represent what we know about the temperature \(t\) in \(^\circ \text{F}\) we can write the inequality: \(\displaystyle t< 3\)
The temperature can also be graphed on a number line. Any point to the left of 3 is a possible value for \(t\). The open circle at 3 means that \(t\) cannot be equal to 3, because the temperature is less than 3.

Here is another example. Suppose a young traveler has to be at least 16 years old to fly on an airplane without an accompanying adult.
If \(a\) represents the age of the traveler, any number greater than 16 is a possible value for \(a\), and 16 itself is also a possible value of \(a\). We can show this on a number line by drawing a closed circle at 16 to show that it meets the requirement (a 16-year-old person can travel alone). From there, we draw a line that points to the right.

We can also write an inequality and equation to show possible values for \(a\): \(\displaystyle a>16\) \(\displaystyle a=16\)