Lesson 19
Drawing on the Coordinate Plane
19.1: Cat Pictures (15 minutes)
Optional activity
This activity introduces students to using graphing technology to plot ordered pairs and create images.
Launch
Demonstrate how to use the technology available in the classroom to plot coordinate pairs. If using the applet or using Desmos in a web browser, consider using these instructions:
- On a blank graph, add a new table by clicking on the “+” icon in the upper left and select “table” from the drop-down menu.
- Enter pairs of \(x\)- and \(y\)-values in the table. Corresponding points should appear on the graph.
- Click on the wheel icon on the upper right corner of left sidebar. The circle next to the \(y\) label in the table will turn into a solid circle.
- Click on the circle next to \(y\) and turn on the “Lines” option in the drop-down menu. Consecutive points on the graph will now be connected by line segments.
Provide access to graphing technology. Give students 10–12 minutes of quiet work time followed by a whole-class discussion.
Supports accessibility for: Organization; Attention
Student Facing
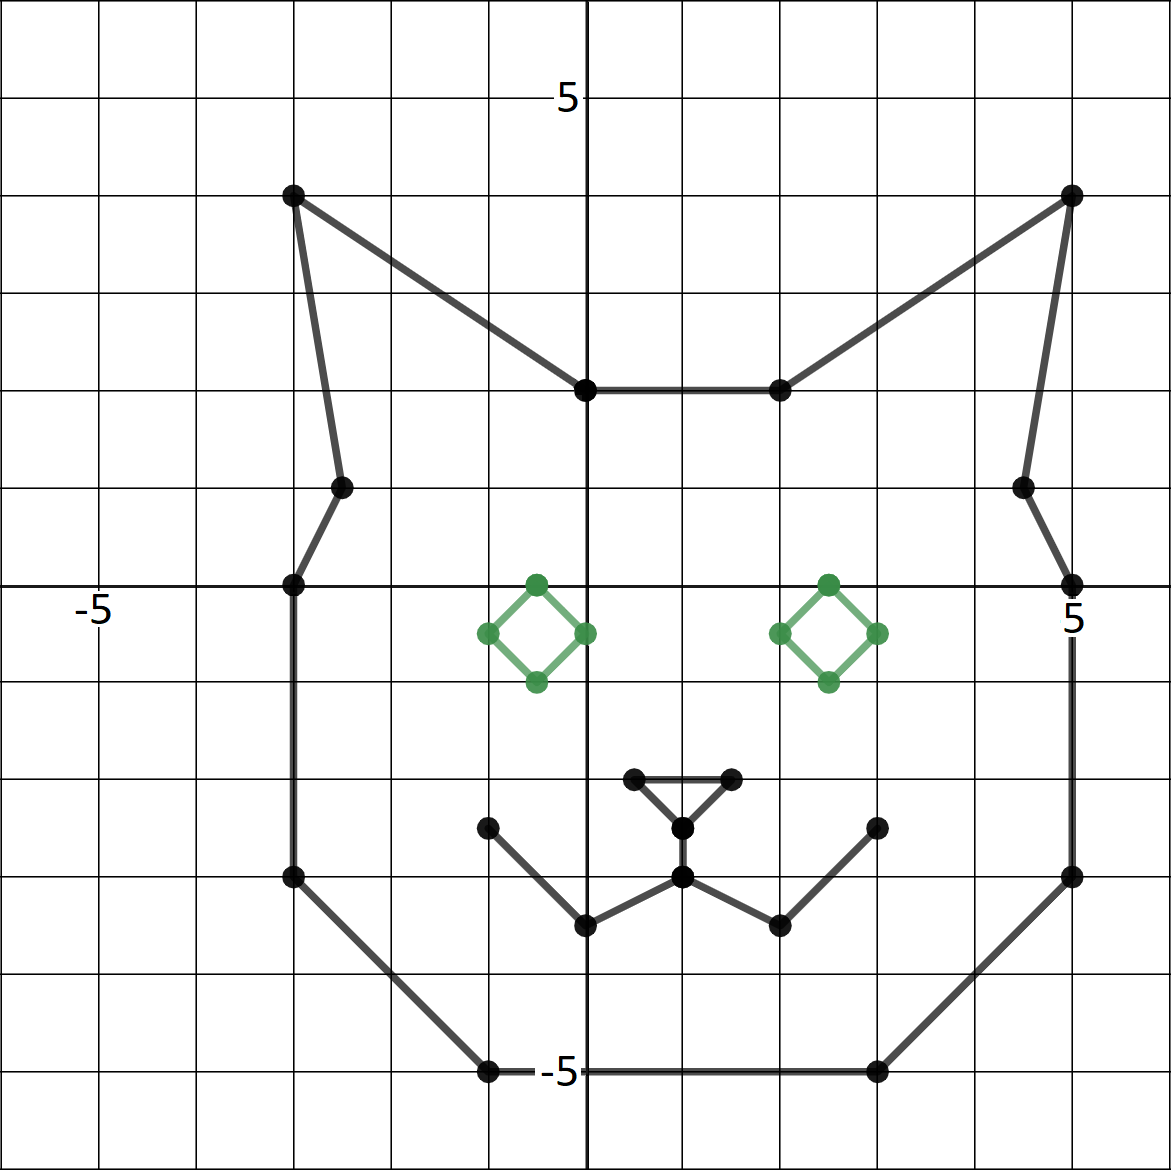
Recreate this image in the applet by entering ordered pairs.

If you have time, consider adding more details to your image such as whiskers, the inside of the ears, a bow, or a body.
Student Response
For access, consult one of our IM Certified Partners.
Student Facing
Are you ready for more?
Add these statements to the list of things being graphed.
\(x > 6\)
\(y > 5\)
\(x < -4\)
\(y < -6\)
Describe the result. Why do you think that happened?
Student Response
For access, consult one of our IM Certified Partners.
Launch
Demonstrate how to use the technology available in the classroom to plot coordinate pairs. If using the applet or using Desmos in a web browser, consider using these instructions:
- On a blank graph, add a new table by clicking on the “+” icon in the upper left and select “table” from the drop-down menu.
- Enter pairs of \(x\)- and \(y\)-values in the table. Corresponding points should appear on the graph.
- Click on the wheel icon on the upper right corner of left sidebar. The circle next to the \(y\) label in the table will turn into a solid circle.
- Click on the circle next to \(y\) and turn on the “Lines” option in the drop-down menu. Consecutive points on the graph will now be connected by line segments.
Provide access to graphing technology. Give students 10–12 minutes of quiet work time followed by a whole-class discussion.
Supports accessibility for: Organization; Attention
Student Facing
Use graphing technology to recreate this image. If graphing technology is not available, list the ordered pairs that make up this image. Then compare your list with a partner.

If you have time, consider adding more details to your image such as whiskers, the inside of the ears, a bow, or a body.
Student Response
For access, consult one of our IM Certified Partners.
Student Facing
Are you ready for more?
If you are using graphing technology, add these statements to the list of things being graphed:
\(x > 6\)
\(y > 5\)
\(x < -4\)
\(y < -6\)
Describe the result. Why do you think that happened?
Student Response
For access, consult one of our IM Certified Partners.
Anticipated Misconceptions
Some students may struggle with getting the graphing technology to do what they want. Consider having a peer show them how to use it or help them identify their mistakes.
Students who are doing the activity on paper may not realize that they should continue listing ordered pairs when they get to the part about adding more details. Encourage them to list the ordered pairs as appropriate.
Activity Synthesis
Briefly invite students to share what challenges they experienced while graphing the image and how they overcame them. If not brought up by students, highlight the fact that the image’s line of symmetry was not on the axis and ask them to share how this affected the coordinates.
19.2: Design Your Own Image (30 minutes)
Optional activity
In this activity, students use graphing technology to create an image of their own design. While determining the ordered pairs needed to make their image, they have opportunities to think about distances on the coordinate plane, signs in ordered pairs, reflections across an axis, and distance from zero. Students make use of structure as they adjust their ordered pairs until the image looks just the way they want it (MP7).
Launch
If needed, review how to use the graphing technology to make sure every student feels capable of plotting points and connecting them.
Student Facing
Create an image of your own design by listing the ordered pairs in the applet. You could draw a different animal, a vehicle, a building, or something else. Make sure your image includes at least 4 points in each quadrant of the coordinate plane.
Student Response
For access, consult one of our IM Certified Partners.
Launch
If needed, review how to use the graphing technology to make sure every student feels capable of plotting points and connecting them.
Student Facing
Use graphing technology to create an image of your own design. You could draw a different animal, a vehicle, a building, or something else. Make sure your image includes at least 4 points in each quadrant of the coordinate plane.
If graphing technology is not available, create your image on graph paper, and then list the ordered pairs that make up your image. Trade lists with a partner but do not show them your image. Graph your partner’s ordered pairs and see if your images match.
Student Response
For access, consult one of our IM Certified Partners.
Activity Synthesis
Invite students to share what they thought about while they were figuring out the ordered pairs for their image. Consider doing a gallery walk so students can see each other’s designs.
Design Principle(s): Support sense-making; Optimize output