Lesson 13
Interpreting Points on a Coordinate Plane
13.1: Unlabeled Points (5 minutes)
Warm-up
In this warm-up, students practice skills that they have developed for plotting points in all 4 quadrants of the coordinate plane. This warm-up also gives students the opportunity to describe points that do not fall nicely on the intersection of grid lines. In the next few activities, students apply these skills to answer questions in context.
Launch
Give students 3 minutes of quiet work time followed by whole-class discussion.
Student Facing
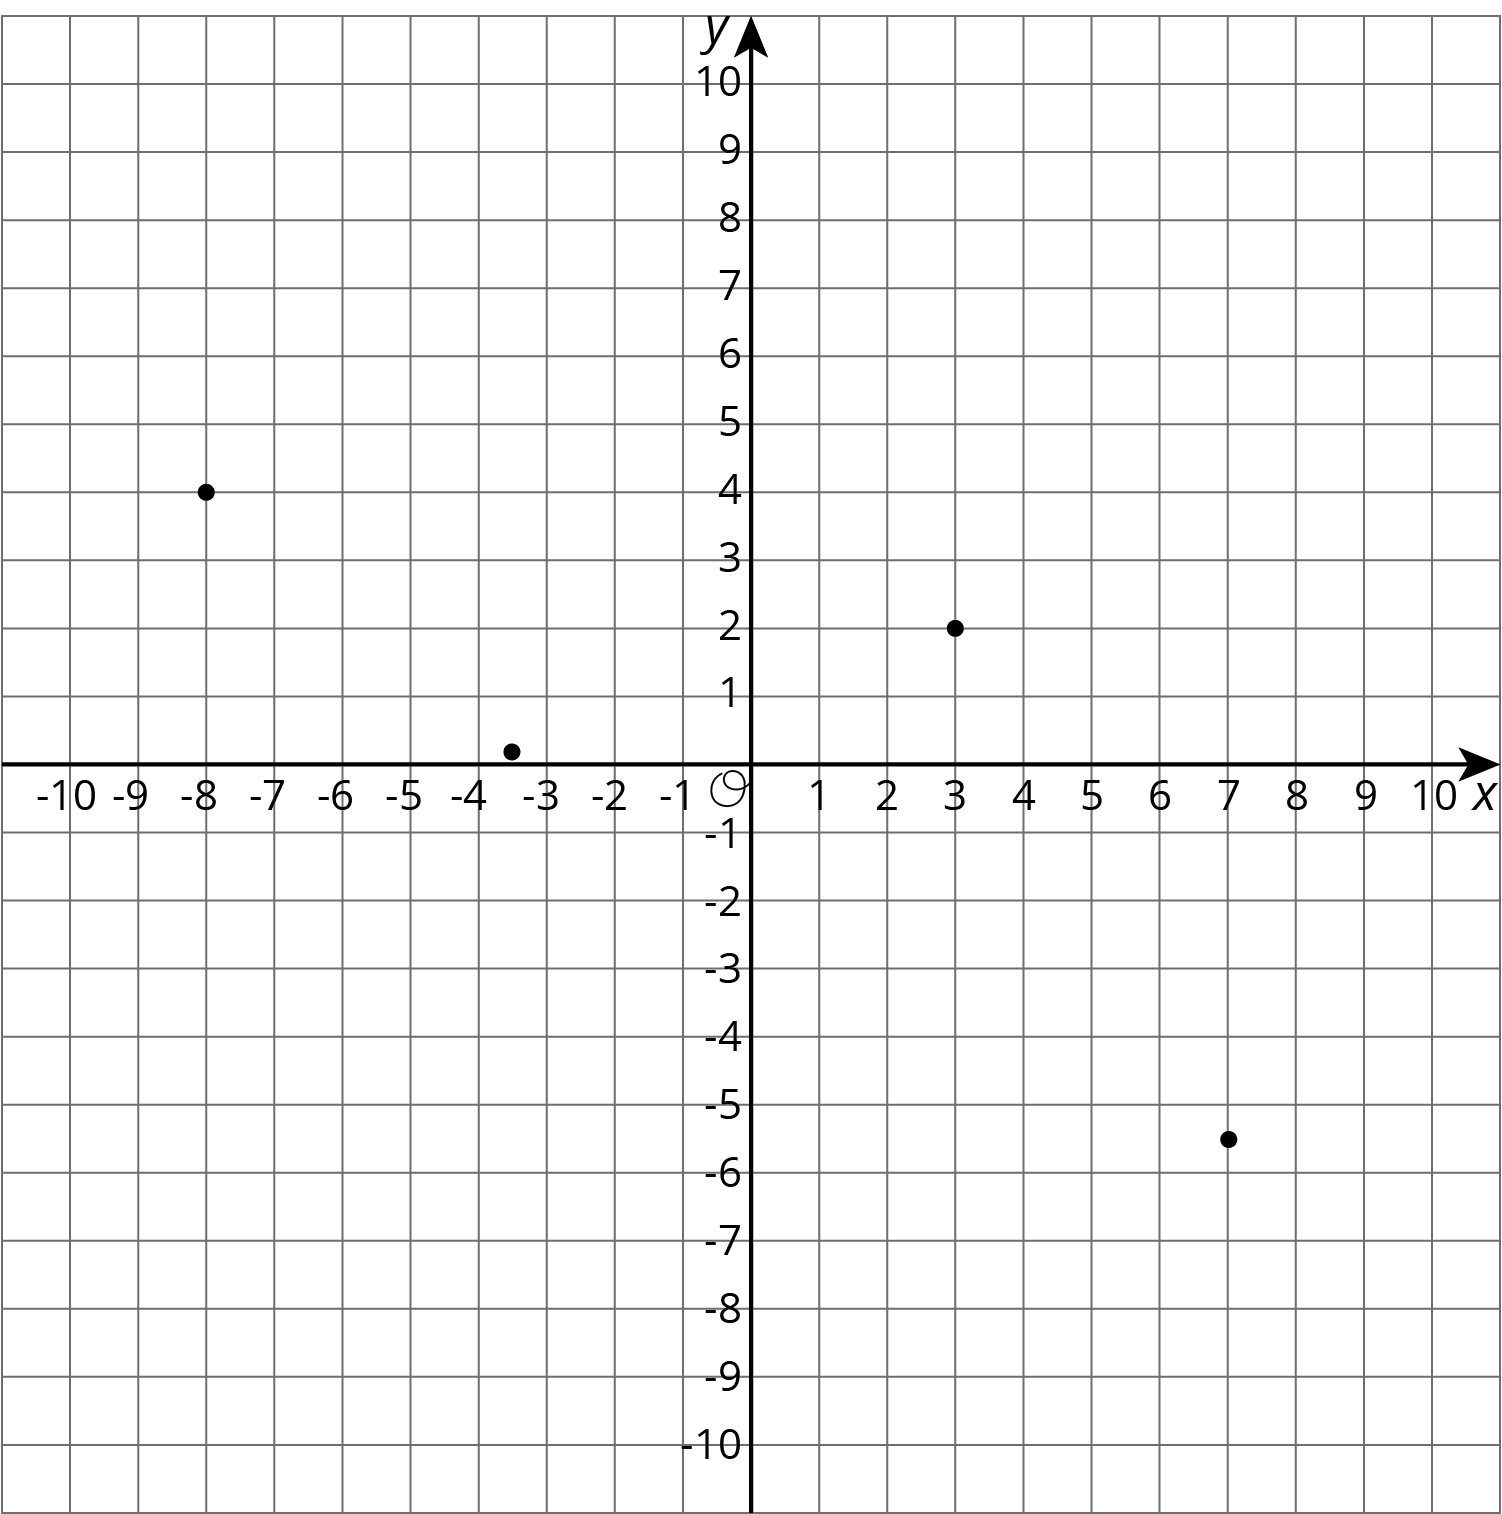
Label each point on the coordinate plane with the appropriate letter and ordered pair.

\(A = (7, \text-5.5)\)
\(B = (\text-8, 4)\)
\(C = (3, 2)\)
\(D = (\text-3.5, 0.2)\)
Student Response
For access, consult one of our IM Certified Partners.
Anticipated Misconceptions
Some students may have trouble locating decimal values on a coordinate plane. (They have placed decimals on horizontal number lines before, but up to this point have mostly seen coordinates that are integers or 0.5's.) Demonstrate how point \(B\) is 4 units above the \(x\)-axis by tracing a pencil 4 units vertically to land on point \(B\). Then ask, "What if the point was only 0.2 units above the \(x\)-axis? Where would it go?"
Activity Synthesis
The main goal of discussion is to review the order of ordered pairs and make sense of points that don't fall on the intersection of grid lines. Invite students to explain how they knew which points matched with which coordinates. Ask students how they would make sense of point \(D\), since it doesn't fall nicely where grid lines cross.
13.2: Account Balance (15 minutes)
Activity
In this activity, students interpret points in the coordinate plane that correspond to the balance in a bank account (MP2). Since bank accounts are not likely to be familiar to students in grade 6, they will need to be oriented to the context.
Launch
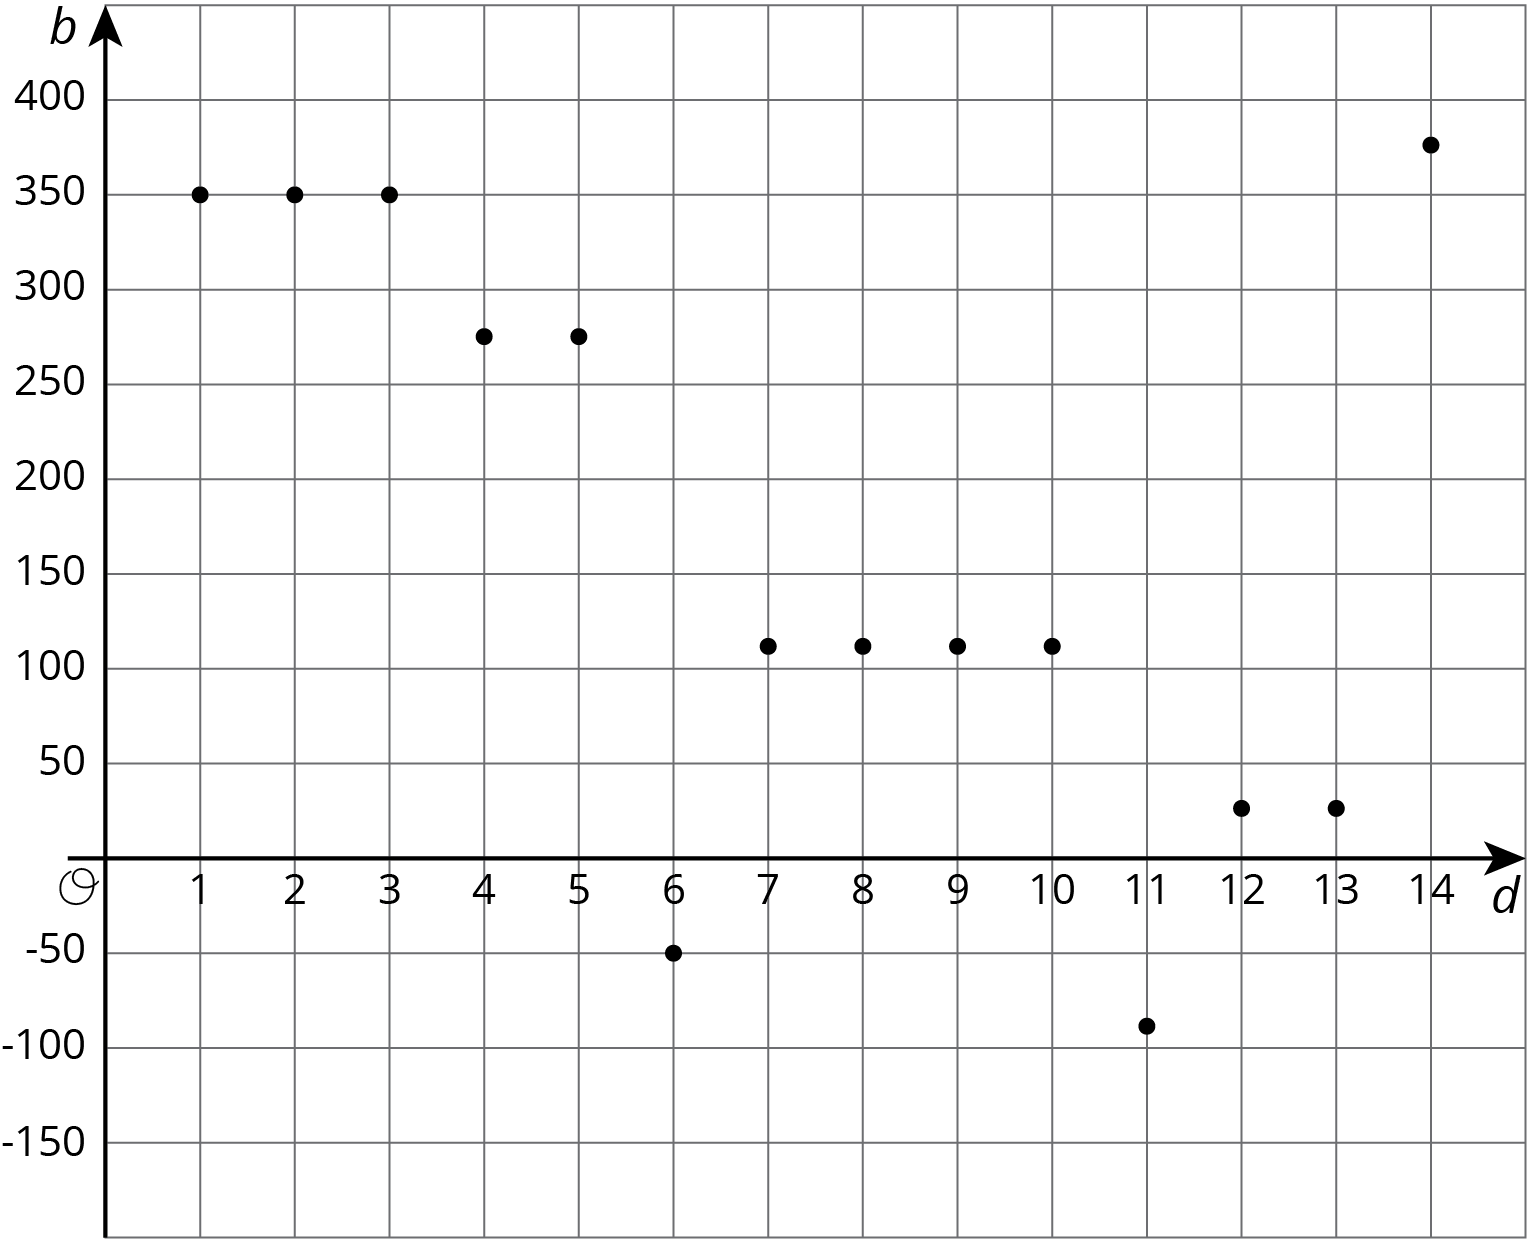
Arrange students in groups of 2. Tell students that when someone opens a bank account, they have to put money into the account. The "account balance" is the amount of money in the account at any given time. For example, they might put $350 into the account when they open it, and then the account balance will be 350. However, sometimes they have to borrow money from the bank and then their account balance is a negative value. For instance, if they have no money in the account and borrow $200, then the account balance is -200. The graph they see shows the account balance for a person's account at the start of each day for two weeks.
Give students 10 minutes of work time. Encourage students to check in with their partner after each problem and work to reach agreement if they disagree. Follow with whole-class discussion.
Supports accessibility for: Language; Organization
Design Principle(s): Cultivate conversation
Student Facing
The graph shows the balance in a bank account over a period of 14 days. The axis labeled \(b\) represents account balance in dollars. The axis labeled \(d\) represents the day.

- Estimate the greatest account balance. On which day did it occur?
- Estimate the least account balance. On which day did it occur?
- What does the point \((6, \text-50)\) tell you about the account balance?
- How can we interpret \(| \text- 50|\) in the context?
Student Response
For access, consult one of our IM Certified Partners.
Activity Synthesis
The purpose of the discussion is to check how comfortable students are with the concept of an account balance that included negative numbers and how to interpret the coordinate plane in this context. Ask for students to explain their responses to each question. To include more students in the discussion, consider asking:
- "Do you agree or disagree? Why?"
- "Who can restate ___’s reasoning in a different way?"
- "Does anyone want to add on to _____’s reasoning?"
Bring attention to the days when the account balance changed. Ask students to come up with a story of what might have happened on those days.
13.3: High and Low Temperatures (15 minutes)
Activity
Students reason abstractly and quantitatively about temperatures over time graphed on coordinate axes (MP2). The goal of this activity is for students to use inequalities to describe the location of points on a coordinate grid in one direction. This activity also introduces the idea of vertical difference on the coordinate plane using a familiar context. Students may use previous strategies such as counting squares, but are not expected to explicitly add or subtract using negative numbers.
Launch
Arrange students in groups of 2. Allow students 3–4 minutes of quiet work time and 1–2 minutes to check results with their partner. Follow with a whole-class discussion.
Supports accessibility for: Social-emotional skills; Conceptual processing
Student Facing
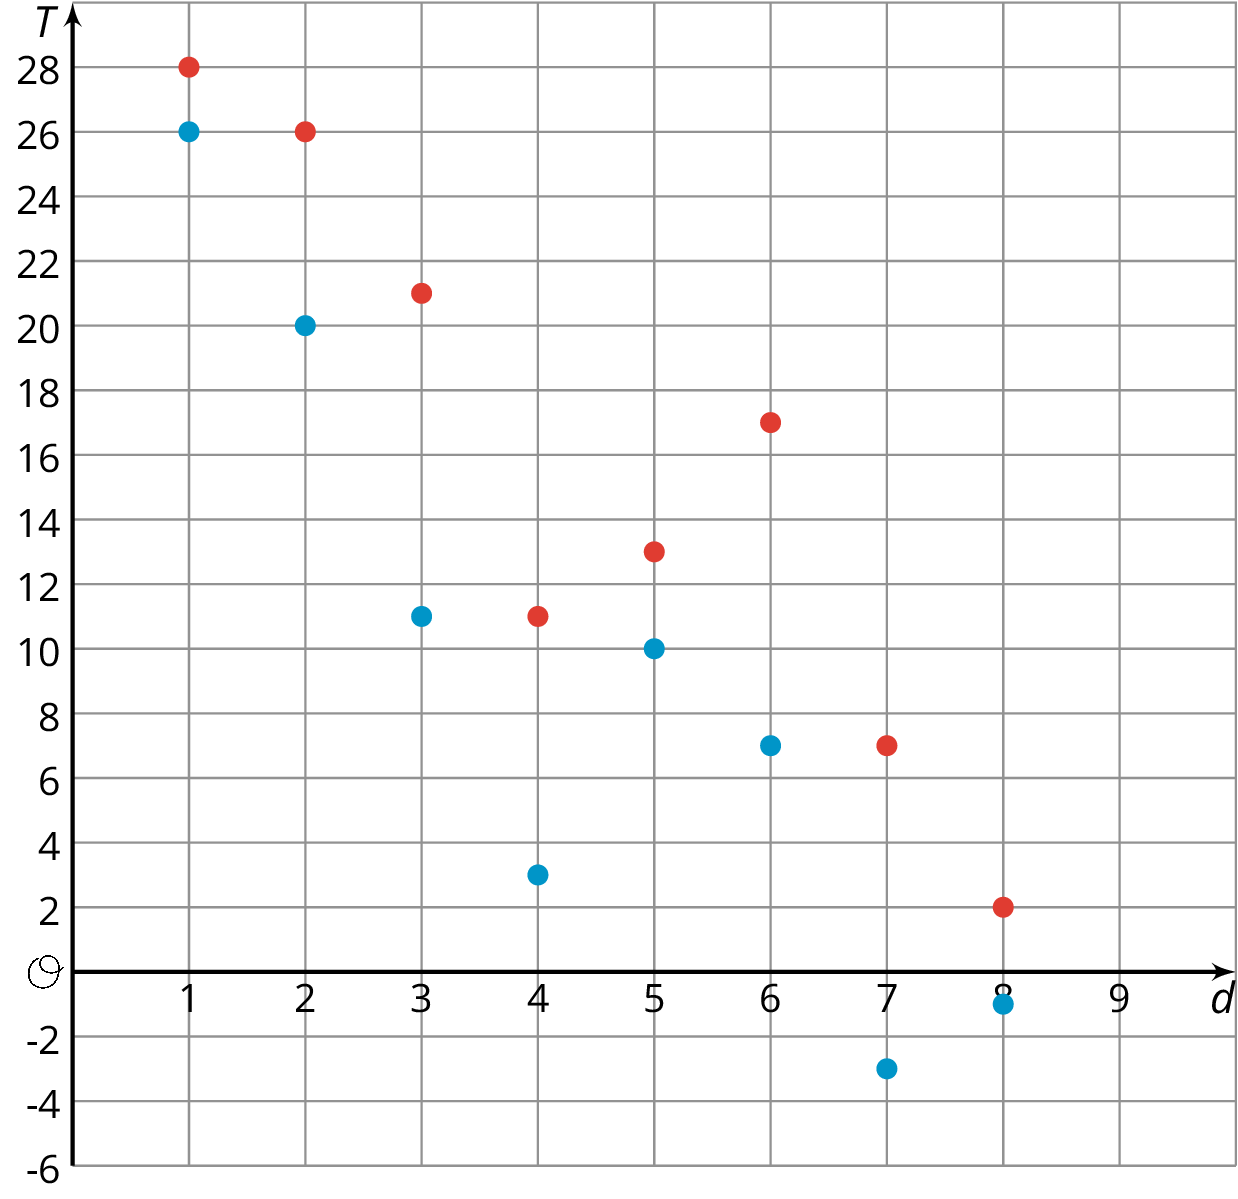
The coordinate plane shows the high and low temperatures in Nome, Alaska over a period of 8 days. The axis labeled \(T\) represents temperatures in degrees Fahrenheit. The axis labeled \(d\) represents the day.

-
- What was the warmest high temperature?
-
Write an inequality to describe the high temperatures, \(H\), over the 8-day period.
-
- What was the coldest low temperature?
-
Write an inequality to describe the low temperatures, \(L\), over the 8-day period.
-
-
On which day(s) did the largest difference between the high and low temperatures occur? Write down this difference.
- On which day(s) did the smallest difference between the high and low temperatures occur? Write down this difference.
-
Student Response
For access, consult one of our IM Certified Partners.
Student Facing
Are you ready for more?
Before doing this problem, do the problem about taxicab distance in an earlier lesson.
The point \((0,3)\) is 4 taxicab units away from \((\text{-}4,3)\) and 4 taxicab units away from \((2,1)\).
- Find as many other points as you can that are 4 taxicab units away from both \((\text{-}4,3)\) and \((2,1)\).
- Are there any points that are 3 taxicab units away from both points?
Student Response
For access, consult one of our IM Certified Partners.
Anticipated Misconceptions
Because the high temperature on day 7 was positive and the low temperature was negative, some students may not notice that the difference was 10 degrees on this day as well. Consider prompting them to use tracing paper to compare the temperature differences on days 6 and 7.
Activity Synthesis
This discussion should lead to two key takeaways. First, students express the range of values for the low and high temperatures using inequalities. Second, students share strategies for finding a difference between two values on the coordinate plane.
Ask students to share their inequalities for \(H\) and \(L\). It is expected that students have inequalities that describe the maximum high temperature for \(H\) and the minimum low temperature for \(L\), but the discussion should bring out that each variable has 4 statements that capture its possible values: \(L>\text-3\), \(L=\text-3\), \(L < 26\), and \(L=26\) for the variable \(L\) and \(H>2\), \(H=2\), \(H < 28\), and \(H=28\) for the variable \(H\).
Ask students to share their strategies for finding the vertical distance between points. Push them to explain how they took the scale of the vertical axis into account. Invite students to explain how they used the context to make sense of their answers.
Design Principle(s): Support sense-making
Lesson Synthesis
Lesson Synthesis
In this lesson, students graphed temperature and account balance over time on coordinate axes and interpreted questions involving vertical distance. Consider asking some of the following questions:
- “Sketch a graph of \((4, 450)\) and \((4,\text-47)\). Which of the situations we looked at today would make these points make the most sense? What would the \(x\)- and \(y\)-axes represent?” (The account balance over the course of several days makes most sense in this situation. Then \(x\) would represent the number of days and \(y\) would represent the account balance. A temperature of 450 degrees Celsius doesn’t make as much sense if we are talking about Earth.)
- “Suppose two people open their own bank accounts on the same day. Graphing their account balances over several days, one person’s situation is represented by \((4,450)\) and the other person’s is represented by \((4,\text-47)\). What does this mean in the situation? How do their account balances compare?” (This means the first person has \$450 on day 4 and the other person owes \$47 by that same day. The first person’s balance is \$497 higher than the second person’s.)
- “The high temperature on day 6 of a 10 day period is 30 degrees Celsius and the low temperature on that same day is 12 degrees Celsius. Sketch a graph, label the axes, and plot the high and low temperatures on day 6. How much warmer is the high temperature than the low temperature?”
Invite students to display their sketches for all to see. Highlight the vertical distance between points and compare students’ strategies for finding that distance.
13.4: Cool-down - Time and Temperature (5 minutes)
Cool-Down
For access, consult one of our IM Certified Partners.
Student Lesson Summary
Student Facing
Points on the coordinate plane can give us information about a context or a situation. One of those contexts is about money.
To open a bank account, we have to put money into the account. The account balance is the amount of money in the account at any given time. If we put in \$350 when opening the account, then the account balance will be 350.
Sometimes we may have no money in the account and need to borrow money from the bank. In that situation, the account balance would have a negative value. If we borrow \$200, then the account balance is -200.
A coordinate grid can be used to display both the balance and the day or time for any balance. This allows to see how the balance changes over time or to compare the balances of different days.
Similarly, if we plot on the coordinate plane data such as temperature over time, we can see how temperature changes over time or compare temperatures of different times.