Lesson 17
Two Related Quantities, Part 2
Lesson Narrative
In this second lesson on representing relationships between two quantities, walking at a constant rate provides the context for writing an equation that represents the relationship. Students use and make connections between tables, graphs, and equations that represent the relationship between time and distance. They use their representations to compare rates and consider how each of the representations would change if the independent and dependent variables were switched.
Learning Goals
Teacher Facing
- Create a table, graph, and equation to represent the relationship between distance and time for an object moving at a constant speed.
- Identify (in writing) the independent and dependent variable in an equation.
- Interpret (orally and in writing) an equation that represents the relationship between distance and time for an object moving at a constant speed.
Student Facing
Let’s use equations and graphs to describe stories with constant speed.
Required Materials
Learning Targets
Student Facing
- I can create tables and graphs to represent the relationship between distance and time for something moving at a constant speed.
- I can write an equation with variables to represent the relationship between distance and time for something moving at a constant speed.
CCSS Standards
Addressing
Glossary Entries
-
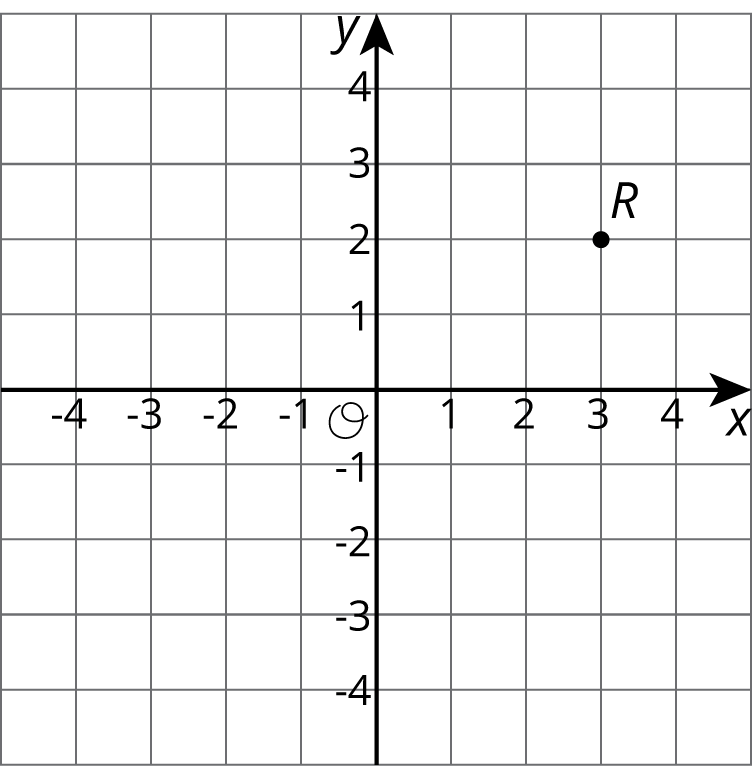
coordinate plane
The coordinate plane is a system for telling where points are. For example. point \(R\) is located at \((3, 2)\) on the coordinate plane, because it is three units to the right and two units up.
Print Formatted Materials
For access, consult one of our IM Certified Partners.
Additional Resources
| Google Slides | For access, consult one of our IM Certified Partners. |
|
| PowerPoint Slides | For access, consult one of our IM Certified Partners. |