Lesson 18
More Relationships
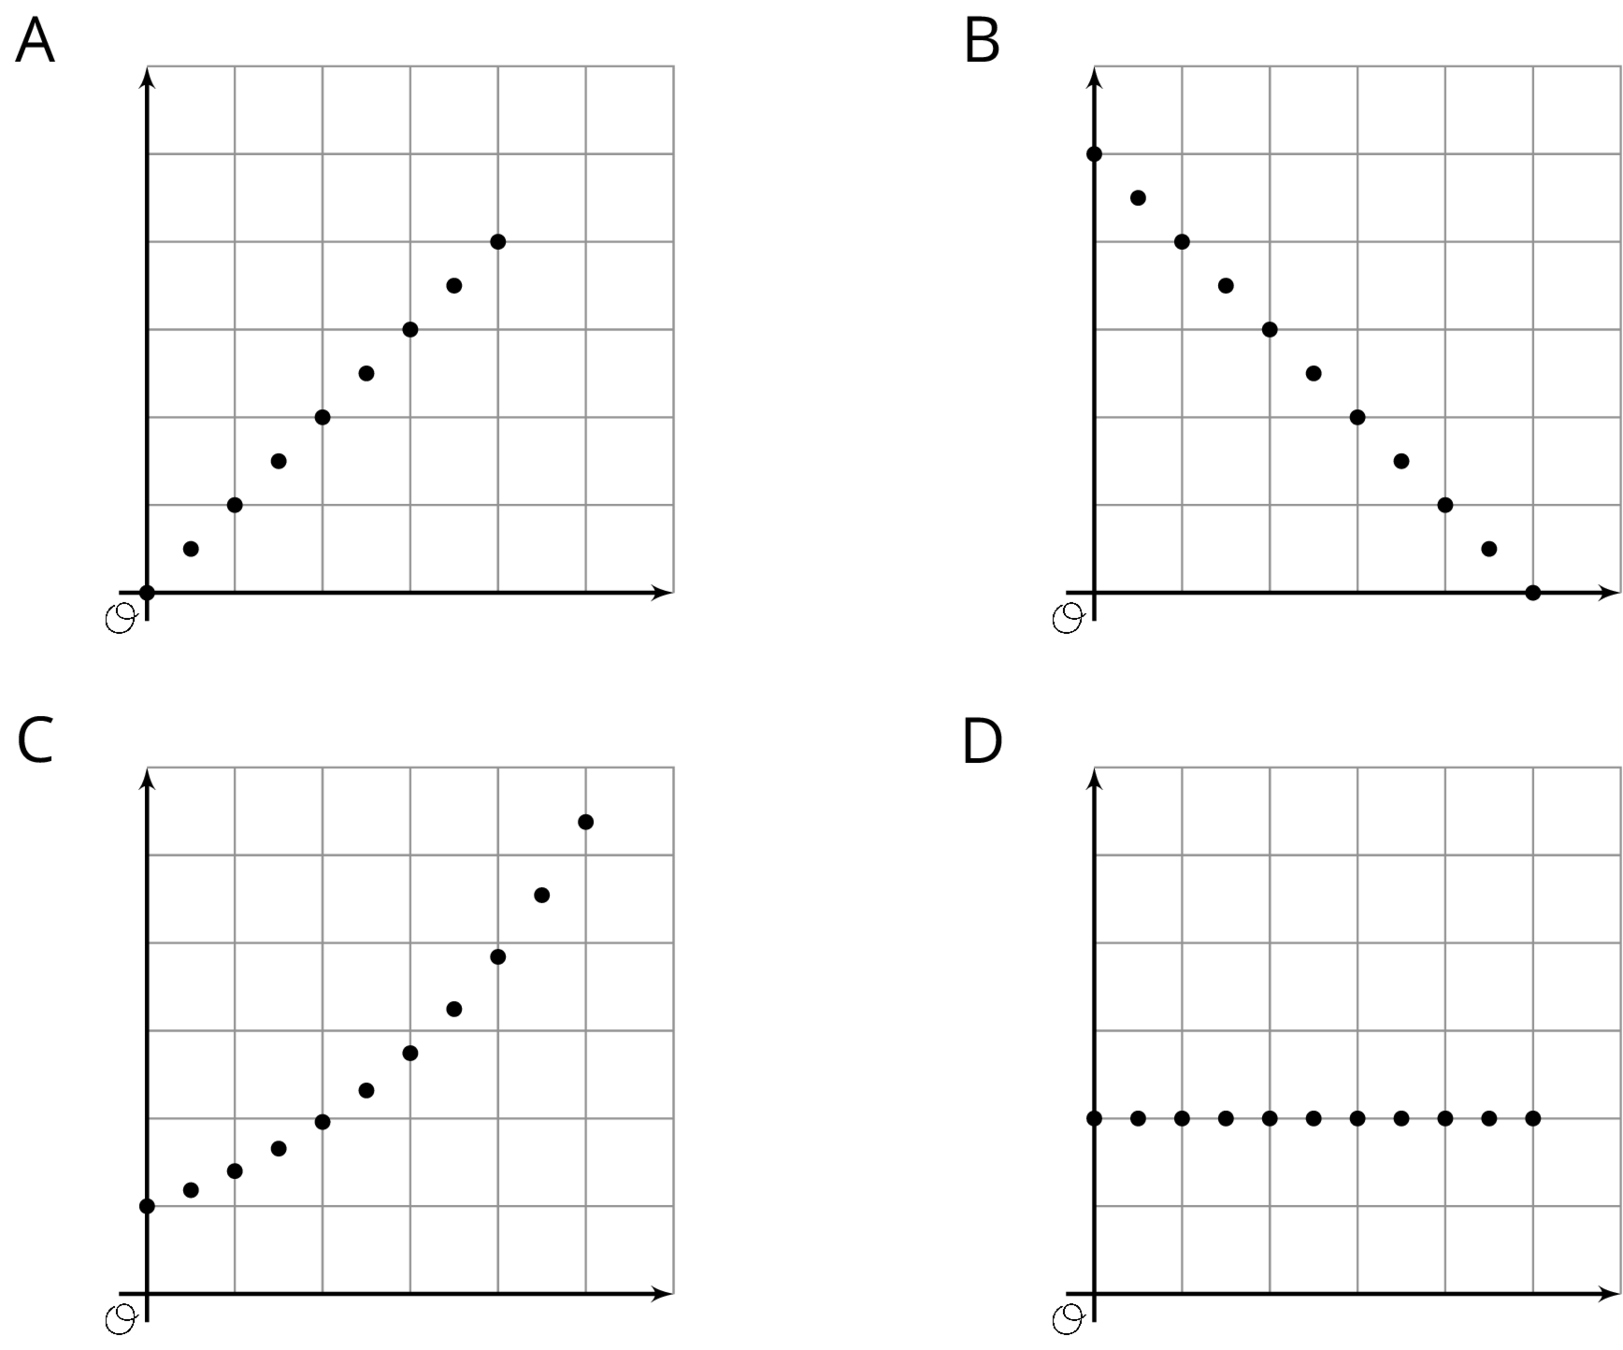
18.1: Which One Doesn’t Belong: Graphs (5 minutes)
Warm-up
The purpose of this warm-up is to prompt students to reason about what a set of organized points in a coordinate plane might mean. This activity invites students to explain their reasoning and hold mathematical conversations, and allows you to hear how they use terminology and talk about points in a coordinate plane. To allow all students to access the activity, there is not one correct answer so students are able to choose any figure as long as they can support their reasoning. As students share their responses, listen for important ideas and terminology that will be helpful in upcoming work.
Launch
Arrange students in groups of 2-4. Display the image of the four figures for all to see. Ask students to indicate when they have noticed one figure that does not belong and can explain why. Give students 1 minute of quiet think time and then time to share their thinking with their group. After everyone has conferred in groups, ask the group to offer at least one reason each figure doesn’t belong.
Student Facing
Which one doesn’t belong?
Student Response
For access, consult one of our IM Certified Partners.
Activity Synthesis
After students have conferred in groups, invite each group to share one reason why a particular figure might not belong. Record and display the responses for all to see. After each response, poll the rest of the class if they agree or disagree. Since there is no single correct answer to the question of which shape does not belong, attend to students’ explanations and ensure the reasons given are correct. During the discussion, prompt students with the following questions:
- "How would you describe the relationship between the two quantities represented by the two axes?"
- "Do you have any ideas about what quantities or relationships any of these graphs might represent?" (If students do have ideas, based on relationships they have explored or others they are thinking about, have them explain why the graph represents the relationship.)
18.2: Making a Banner (15 minutes)
Optional activity
In this activity, students consider the relationship between length and width for different rectangles with the same given area and are asked to compare strategies for finding various lengths and widths. They make sense of how the graph shows what happens to the width when the length changes and what the plotted points on the graph mean in the context of the problem.
Launch
Give students 10 minutes of quiet work time, followed by a whole-class discussion.
Supports accessibility for: Social-emotional skills; Conceptual processing
Design Principle(s): Support sense-making; Maximize meta-awareness
Student Facing
Mai is creating a rectangular banner to advertise the school play. The material for the banner is sold by the square foot. Mai has enough money to buy 36 square feet of material. She is trying to decide on the length and width of the banner.
-
If the length is 6 feet, what is the width?
-
If the length is 4 feet, what is the width?
-
If the length is 9 feet, what is the width?
-
To find different combinations of length and width that give an area of 36 square feet, Mai uses the equation \(w=\frac{36}{\ell}\), where \(w\) is the width and \(\ell\) is the length. Compare your strategy and Mai's method for finding the width. How were they alike or different?
-
Use several combinations of length and width to create a graph that shows the relationship between the side lengths of various rectangles with area 36 square feet.
- Explain how the graph describes the relationship between length and width for different rectangles with area 36.
- Suppose Mai used the equation \(\ell=\frac{36}{w}\) to find the length for different values of the width. Would the graph be different if she graphed length on the vertical axis and width on the horizontal axis? Explain how you know.
Student Response
For access, consult one of our IM Certified Partners.
Launch
Give students 10 minutes of quiet work time, followed by a whole-class discussion.
Supports accessibility for: Social-emotional skills; Conceptual processing
Design Principle(s): Support sense-making; Maximize meta-awareness
Student Facing
Mai is creating a rectangular banner to advertise the school play. The material for the banner is sold by the square foot. Mai has enough money to buy 36 square feet of material. She is trying to decide on the length and width of the banner.
- If the length is 6 feet, what is the width?
- If the length is 4 feet, what is the width?
- If the length is 9 feet, what is the width?
- To find different combinations of length and width that give an area of 36 square feet, Mai uses the equation \(w=\frac{36}{\ell}\), where \(w\) is the width and \(\ell\) is the length. Compare your strategy and Mai's method for finding the width. How were they the same or different?
-
Use several combinations of length and width to create a graph that shows the relationship between the side lengths of various rectangles with area 36 square feet.
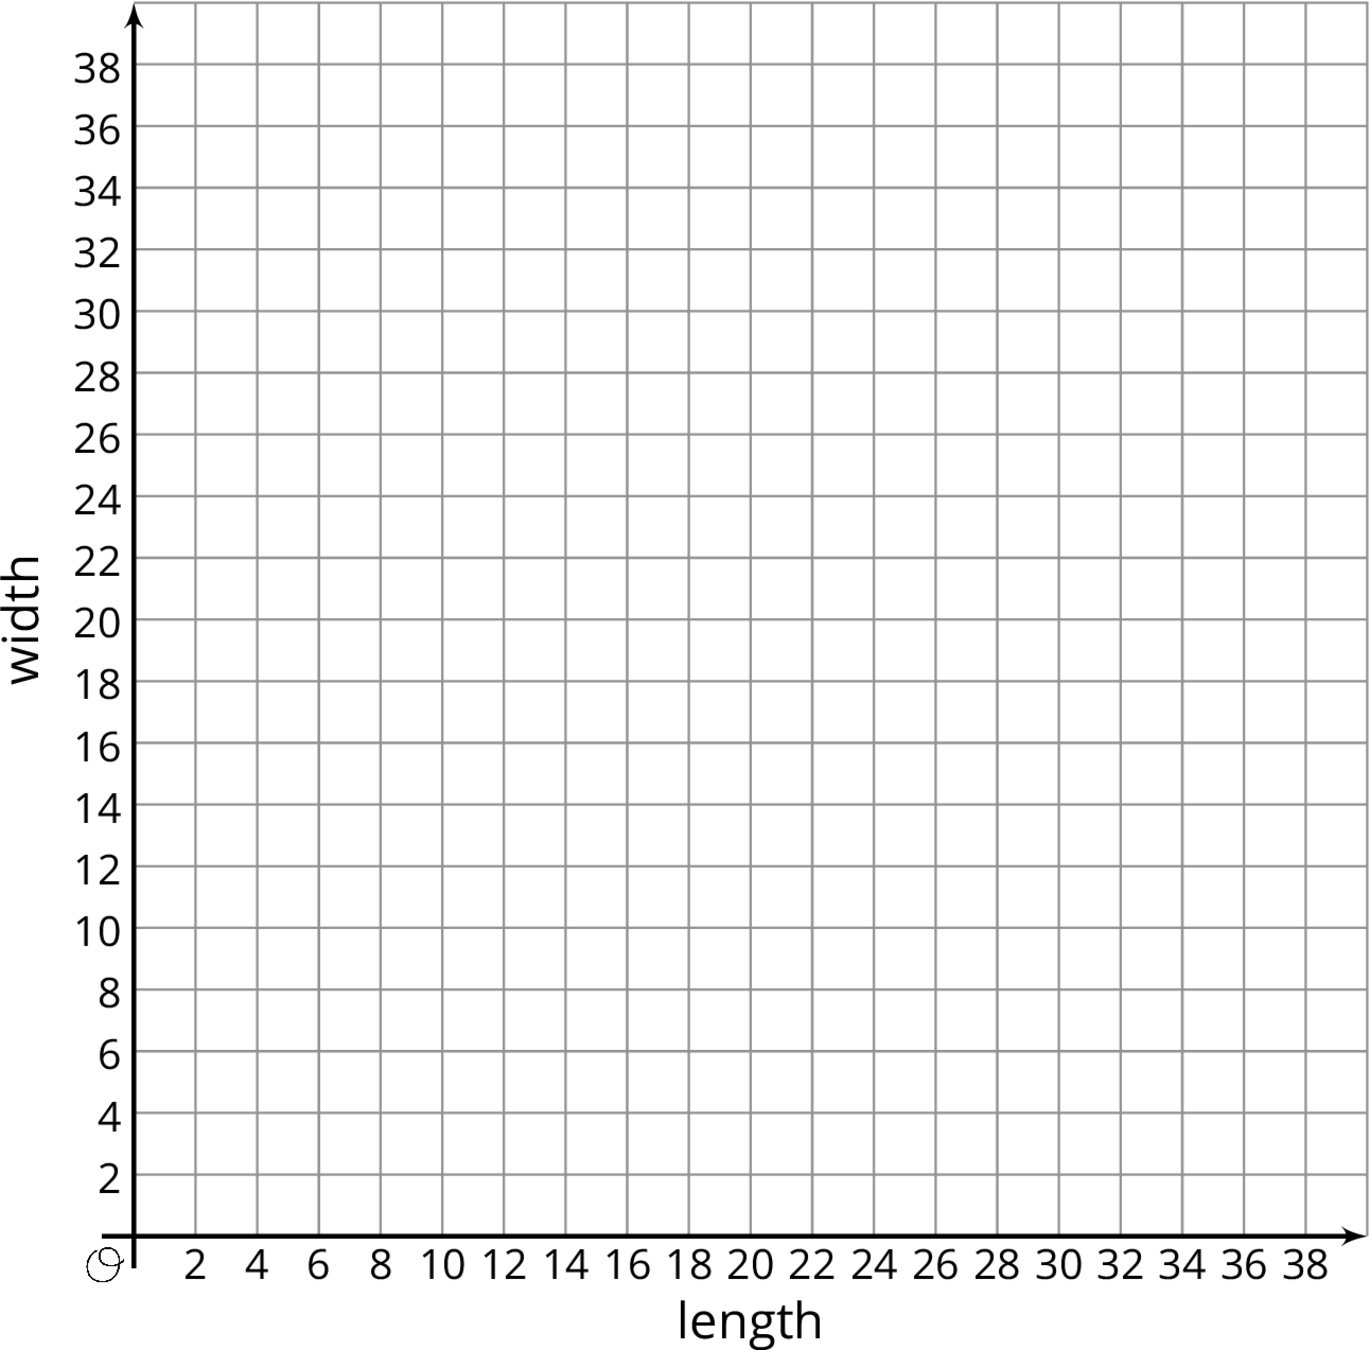
- Explain how the graph describes the relationship between length and width for different rectangles with area 36.
- Suppose Mai used the equation \(\ell=\frac{36}{w}\) to find the length for different values of the width. Would the graph be different if she graphed length on the vertical axis and width on the horizontal axis? Explain how you know.
Student Response
For access, consult one of our IM Certified Partners.
Activity Synthesis
The discussion should focus on the connection between the situation, the equation or strategy for finding combinations that make the area 36, and the graph that represents the relationship between length and width in the different rectangles.
Some guiding questions:
- “What does the point \((2,18)\) (for example) in the graph mean? In general, what does each point represent?” (each point represents a rectangle with area 36. \((2,18)\) represents a rectangle with length 2 and height 18)
- “Why does it make sense that the graph falls as you move to the right?” (The length and width are factors of a fixed product, so if one increases the other has to decrease)
- “Where do you see the area 36 in each of the situation, the equation or strategy for finding combinations, and the graph that shows those combinations?” (in the graph, the coordinates of each point multiply to 36)
- “Describe what the graph would look like if it were to extend more to the right. Name some points on the graph and describe their coordinates.” (Points could be \((\frac{9}{10}, 40)\), \((\frac{18}{25},50)\), \((\frac12,72)\). \(w\) would be a fraction less than 1 as \(\ell\) gets larger than 36 because \(w\) and \(\ell\) have to multiply to 36. The points will keep getting closer to the \(x\)-axis as \(w\) gets smaller.
18.3: Cereal Boxes (15 minutes)
Optional activity
This activity presents a situation with a similar structure to the area situation in the Making a Banner activity. Students consider different combinations of base areas and heights that keep the volume of a rectangular box at 225 cubic inches. They complete a table for given values of area and height, write an equation relating the area and height, and graph the relationship.
If students have completed the Making a Banner activity, prompt them to think about similarities and differences they noticed between the activities. Invite students to share these thoughts during the discussion. Students have an opportunity to engage in MP7 as they notice the similar structures of the two situations and use that knowledge to solve the problems in this activity.
Launch
Give students 10 minutes of quiet work time and follow with a whole-class discussion.
Supports accessibility for: Visual-spatial processing;Conceptual processing; Organization
Student Facing
A cereal manufacturer needs to design a cereal box that has a volume of 225 cubic inches and a height that is no more than 15 inches.
- The designers know that the volume of a rectangular prism can be calculated by multiplying the area of its base and its height. Complete the table with pairs of values that will make the volume 225 in3.
height (in) 5 9 12 7\(\frac12\) area of base (in2) 75 15 - Describe how you found the missing values for the table.
- Write an equation that shows how the area of the base, \(A\), is affected by changes in the height, \(h\), for different rectangular prisms with volume 225 in3.
-
Plot the ordered pairs from the table on the graph to show the relationship between the area of the base and the height for different boxes box with volume 225 in3.
Student Response
For access, consult one of our IM Certified Partners.
Launch
Give students 10 minutes of quiet work time and follow with a whole-class discussion.
Supports accessibility for: Visual-spatial processing;Conceptual processing; Organization
Student Facing
A cereal manufacturer needs to design a cereal box that has a volume of 225 cubic inches and a height that is no more than 15 inches.
- The designers know that the volume of a rectangular prism can be calculated by multiplying the area of its base and its height. Complete the table with pairs of values that will make the volume 225 in3.
height (in) 5 9 12 \(7\frac12\) area of base (in2) 75 15 - Describe how you found the missing values for the table.
- Write an equation that shows how the area of the base, \(A\), is affected by changes in the height, \(h\), for different rectangular prisms with volume 225 in3.
-
Plot the ordered pairs from the table on the graph to show the relationship between the area of the base and the height for different boxes box with volume 225 in3.
Student Response
For access, consult one of our IM Certified Partners.
Activity Synthesis
The purpose of the discussion is to connect this activity to the previous one and point out similarities and differences between them.
Consider asking the following questions:
- "How does this situation compare to the one in the Making a Banner activity?" (The structure of the equations was similar: the two quantities multiply to a constant.)
- "How did you decide on an equation that represents the relationship?"
- "How would the graph be different if height was on the vertical axis and area on the horizontal axis?" (It would look the same since the two numbers multiply to a constant.)
Design Principles(s): Cultivate conversation; Maximize meta-awareness
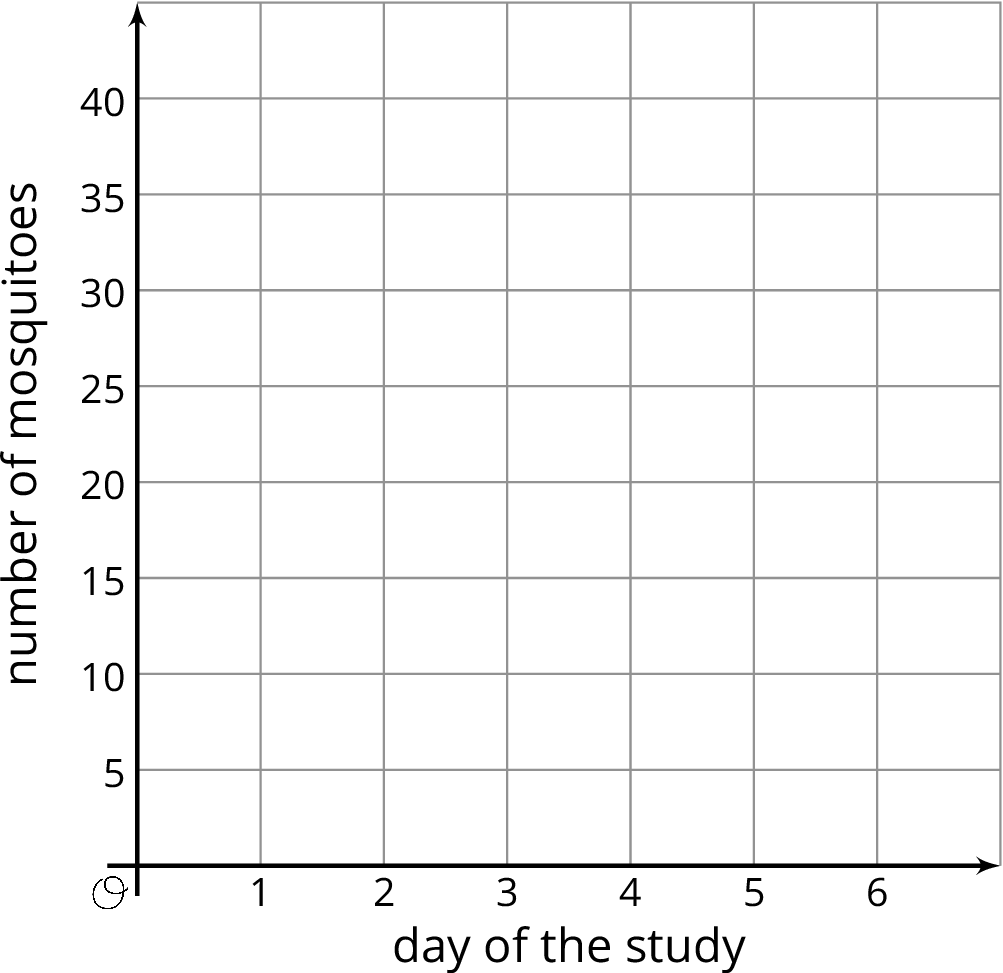
18.4: Multiplying Mosquitoes (10 minutes)
Optional activity
In this activity, students consider a doubling relationship where the exponent is a variable. Monitor for students who connect this activity to the lessons on exponents, or who recognize that the quantities in this relationship are changing with respect to each other in a different manner than previous examples they have seen. Have these students share during the discussion.
Launch
Give students 5-7 minutes of quiet work time, followed by a whole-class discussion.
Student Facing
A researcher who is studying mosquito populations collects the following data:
| day in the study \((d)\) |
number of mosquitoes \((n)\) |
|---|---|
| 1 | 2 |
| 2 | 4 |
| 3 | 8 |
| 4 | 16 |
| 5 | 32 |
-
The researcher said that, for these five days, the number of mosquitoes, \(n\), can be found with the equation \(n = 2^d\) where \(d\) is the day in the study. Explain why this equation matches the data.
-
Use the ordered pairs in the table to graph the relationship between number of mosquitoes and day in the study for these five days.
-
Describe the graph. Compare how the data, equation, and graph illustrate the relationship between the day in the study and the number of mosquitoes.
-
If the pattern continues, how many mosquitoes will there be on day 6?
Student Response
For access, consult one of our IM Certified Partners.
Launch
Give students 5-7 minutes of quiet work time, followed by a whole-class discussion.
Student Facing
A researcher who is studying mosquito populations collects the following data:
| day in the study \((d)\) |
number of mosquitoes \((n)\) |
|---|---|
| 1 | 2 |
| 2 | 4 |
| 3 | 8 |
| 4 | 16 |
| 5 | 32 |
-
The researcher said that, for these five days, the number of mosquitoes, \(n\), can be found with the equation \(n = 2^d\) where \(d\) is the day in the study. Explain why this equation matches the data.
-
Use the ordered pairs in the table to graph the relationship between number of mosquitoes and day in the study for these five days.
- Describe the graph. Compare how the data, equation, and graph illustrate the relationship between the day in the study and the number of mosquitoes.
-
If the pattern continues, how many mosquitoes will there be on day 6?
Student Response
For access, consult one of our IM Certified Partners.
Activity Synthesis
The purpose of this discussion is to help students make connections between the table, graph, and equation that describe this situation. Ask students to share who connected this activity to the lessons on exponents, or who recognize that the quantities in this relationship are changing with respect to each other in a different manner than previous examples they have seen.
Consider asking some of these questions:
- “Which of the data, equation, or graph gives you more of a feel for how the mosquito population changes with the day in the study?”
- “Think back to the lesson on exponents with the dot pattern and the Genie activity. How do those situations compare with this mosquito situation? How would tables of data, graphs, and equations compare?”
- “What are some similarities and differences you noticed between all the relationships you've seen in the last few lessons?”
Design Principle(s): Optimize output (for comparison); Cultivate conversation
Lesson Synthesis
Lesson Synthesis
In this lesson we looked at three situations: rectangles with the same area, rectangular prisms with the same volume, and one quantity that doubles repeatedly each time another quantity is increased by 1. In each situation we examined the relationship between two quantities: length and width of the rectangle, area of the base and height, number of mosquitos and number of days.
Invite students to share and discuss their work with the class. To facilitate discussion, ask students to restate each other's explanations. Draw attention to the meaning of the components of each representation, and how the representations of the different situations are alike and different. For example, ask questions like,
- "What is the meaning of the coordinates of that specific point?"
- "How are the coordinates of a specific point connected to an equation that represents the situation?"
- "In the first activity, for a larger length, there is a smaller width. But in the last activity, for a larger number of days, there is a larger number of mosquitos. How come?"
18.5: Cool-down - Interpret the Point (5 minutes)
Cool-Down
For access, consult one of our IM Certified Partners.
Student Lesson Summary
Student Facing
Equations can represent relationships between geometric quantities. For instance:
- If \(s\) is the side length of a square, then the area \(A\) is related to \(s\) by \(A = s^2\).
- Sometimes the relationships are more specific. For example, the perimeter \(P\) of a rectangle with length \(l\) and width \(w\) is \(P=2l+2w\). If we consider only rectangles with a length of 10, then the relationship between the perimeter and the width is \(P = 20 + 2w\).
Here is another example of an equation with exponent expressing the relationship between quantities:
-
A super ball is dropped from 10 feet. On each successive bounce, it only goes \(\frac{1}{2}\) as high as on the previous bounce.
This means that on the first bounce, the ball will bounce 5 feet high, and then on the second bounce it will only go \(2\frac{1}{2}\) feet high, and so on. We can represent this situation with an equation to find how high the super ball will bounce after any number of bounces.
To find how high the super ball bounces on the \(n^{\rm th}\) bounce, we have to multiply 10 feet (the initial height) by \(\frac{1}{2}\) and multiply by \(\frac{1}{2}\) again for each bounce thereafter; we need to do this \(n\) times. So the height, \(h\), of the ball on the \(n^{\rm th}\) bounce will be \(h =10\left(\frac{1}{2}\right)^n\). In this equation, the dependent variable, \(h\), is affected by changes in the independent variable, \(n\).
Equations and graphs can give us insight into different kinds of relationships between quantities and help us answer questions and solve problems.