Lesson 1
Tape Diagrams and Equations
1.1: Which Diagram is Which? (5 minutes)
Warm-up
Students recall tape diagram representations of addition and multiplication relationships.
For relationships involving multiplication, we follow the convention that the first factor is the number of groups and the second is the number in each group. But students do not have to follow that convention; they may use their understanding of the commutative property of multiplication to represent relationships in ways that make sense to them.
Launch
Give students 2 minutes of quiet think time, followed by a whole-class discussion.
Student Facing
-
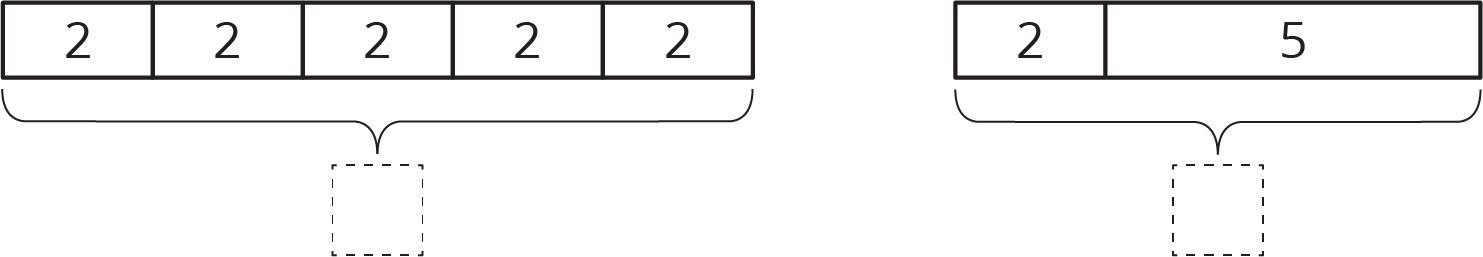
Here are two diagrams. One represents \(2+5=7\). The other represents \(5 \boldcdot 2=10\). Which is which? Label the length of each diagram.
-
Draw a diagram that represents each equation.
\(4+3=7\)
\(4 \boldcdot 3=12\)
Student Response
For access, consult one of our IM Certified Partners.
Activity Synthesis
Invite students to share their responses and rationale. The purpose of the discussion is to give students an opportunity to articulate how operations can be represented by tape diagrams. Some questions to guide the discussion:
- “Where do you see the 5 in the first diagram?” (There are 5 equal parts represented by 5 same-size boxes.)
- “How did you find the length of the first diagram?” (Either computed \(2+2+2+2+2\) or \(5 \boldcdot 2.\))
- “Explain how you knew what the diagrams for \(4+3=7\) and \(4 \boldcdot 3=12\) should look like. How are they alike? How are they different?”
- “How did you represent \(4\boldcdot 3\)? How are they alike? How are they different?” (Some may represent \(4\boldcdot 3\) as 4 groups of size 3, while some may represent as 3 groups of size 4.)
1.2: Match Equations and Tape Diagrams (10 minutes)
Activity
In this first activity on tape diagram representations of equations with variables, students use what they know about relationships between operations to identify multiple equations that match a given diagram. It is assumed that students have seen representations like these in prior grades. If this is not the case, return to the examples in the warm-up and ask students to write other equations for each of the diagrams. For example, the relationship between the quantities 2, 5, and 7 expressed by the equation \(2+5=7\) can also be written as \(2=7-5\), \(5=7-2\), \(7=2+5\), and \(7-2=5.\) Ask students to explain how these equations match the parts of the tape diagram.
Note that the word “variable” is not defined until the next lesson. It is not necessary to use that term with students yet. Also, we are sneaking in the equivalent expressions \(x+x+x+x\) and \(4 \boldcdot x\) because these equivalent ways of writing it should be familiar from earlier grades, but equivalent expressions are defined more carefully later in this unit. Even though this familiar example appears, the general idea of equivalent expressions is not a focus of this lesson.
Launch
Arrange students in groups of 2. Give students 2 minutes of quiet work time. Then, ask them to share their responses with their partner and follow with whole-class discussion.
If necessary, explain that the \(x\) in each diagram is just standing in for a number.
Student Facing
Here are two tape diagrams. Match each equation to one of the tape diagrams.
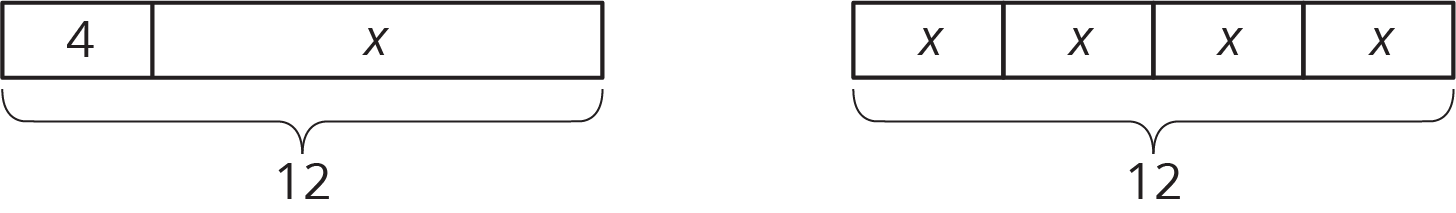
- \(4 + x = 12\)
- \(12 \div 4 = x\)
- \(4 \boldcdot x = 12\)
- \(12 = 4 + x\)
- \(12 - x = 4\)
- \(12 = 4 \boldcdot x\)
- \(12 - 4 = x\)
- \(x = 12 - 4\)
- \(x+x+x+x=12\)
Student Response
For access, consult one of our IM Certified Partners.
Anticipated Misconceptions
Students may not have much experience with a letter standing in for a number. If students resist engaging, explain that the \(x\) is just standing in for a number. Students may prefer to figure out the value that \(x\) must take to make each diagram make sense (8 in the first diagram and 3 in the second diagram) before thinking out which equations can represent each diagram.
Activity Synthesis
Focus the discussion on the reason that more than one equation can describe each tape diagram; namely, the same relationship can be expressed in more than one way. These ideas should be familiar to students from prior work. Ideas that may be noted:
- A multiplicative relationship can be expressed using division.
- An additive relationship can be expressed using subtraction.
- It does not matter how expressions are arranged around an equal sign. For example, \(4+x=12\) and \(12=4+x\) mean the same thing.
- Repeated addition can be represented with multiplication. For example, \(4x\) is another way to express \(x+x+x+x.\)
Students are likely to express these ideas using informal language, and that is okay. Encourage them to revise their statements using more precise language, but there is no reason to insist they use particular terms.
Some guiding questions:
- “How can you tell if a diagram represents addition or multiplication?”
- “Once you were sure about one equation, how did you find others that matched the same diagram?”
- Regarding any two equations that represent the same diagram: “What is the same about the equations? What is different?”
Design Principle(s): Support sense-making; Cultivate conversation
1.3: Draw Diagrams for Equations (15 minutes)
Activity
In this activity, students draw tape diagrams to match given equations. Then, they reason about the unknown value that makes the equation true, a process also known as solving the equation. Students should not be shown strategies to solve but rather should reason with equations or diagrams in ways that make sense to them. As they work, monitor for students who use the diagrams to find unknown quantities and for those who use the equations.
Launch
Give students 5 minutes quiet work time followed by a whole-class discussion.
Supports accessibility for: Visual-spatial processing; Organization
Student Facing
For each equation, draw a diagram and find the value of the unknown that makes the equation true.
- \(18 = 3+x\)
- \(18 = 3 \boldcdot y\)
Student Response
For access, consult one of our IM Certified Partners.
Student Facing
Are you ready for more?
You are walking down a road, seeking treasure. The road branches off into three paths. A guard stands in each path. You know that only one of the guards is telling the truth, and the other two are lying. Here is what they say:
- Guard 1: The treasure lies down this path.
- Guard 2: No treasure lies down this path; seek elsewhere.
- Guard 3: The first guard is lying.
Which path leads to the treasure?
Student Response
For access, consult one of our IM Certified Partners.
Anticipated Misconceptions
Students might draw a box with 3 for the equation \(18 = 3 \boldcdot y\). Ask students about the meaning of multiplication and specifically what \(3 \boldcdot y\) means. Ask how they could represent 3 equal groups with unknown size \(y\).
Students might think they need to show an unknown number (\(y\)) of equal groups of 3. While this is possible, showing 3 equal groups with unknown size \(y\) is simpler to represent.
Activity Synthesis
Invite students to share their strategies for finding the values of \(x\) and \(y\). Include at least one student who reasoned with the diagram and one who reasoned with the equation. Help students connect different methods by thinking about the relationships between the three quantities in each problem and how both the equations and the diagrams represent them.
Design Principle(s): Support sense-making; Maximize meta-awareness
Lesson Synthesis
Lesson Synthesis
To ensure that students understand the use and usefulness of tape diagrams in representing equations and finding unknown values, consider asking some of the following questions:
- “Why are tape diagrams useful to visualize a relationship?” (Answers vary. Sample response: You can see the way quantities are related.)
- “Where in the tape diagram do we see the equal sign that is in the equation it represents?” (The fact that the sum of the parts has the same value as the whole; the numbers and letters in the boxes add up to the total shown for the whole rectangle.)
- “Why can a diagram be represented by more than one equation?” (Because more than one operation can be used; for example, the same diagram can be represented by an addition or a subtraction equation. Because when two expressions are equal, it doesn't matter how they are arranged around the equal sign.)
- “Describe some ways to represent the relationship \(23+x=132\)” (Tape diagram with two unequal parts, other equivalent equations like \(x=132-23\)).
- “Describe some ways to represent the relationship \(5x=230\)” (Tape diagram with 5 equal parts, other equivalent equations like \(x=230\div5\)).
1.4: Cool-down - Finish the Diagrams (5 minutes)
Cool-Down
For access, consult one of our IM Certified Partners.
Student Lesson Summary
Student Facing
Tape diagrams can help us understand relationships between quantities and how operations describe those relationships.
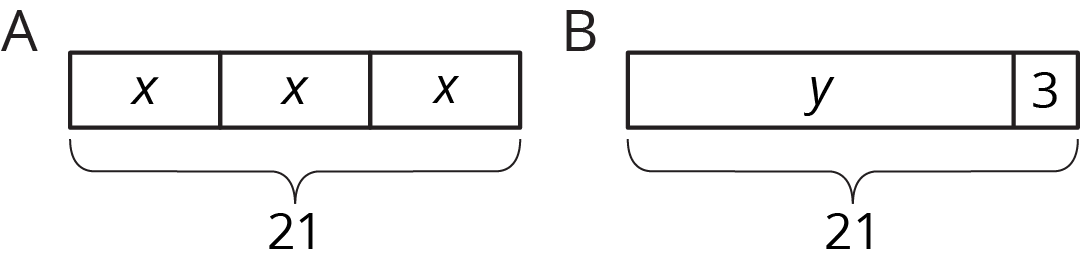
Diagram A has 3 parts that add to 21. Each part is labeled with the same letter, so we know the three parts are equal. Here are some equations that all represent diagram A:
\(\displaystyle x+x+x=21\)
\(\displaystyle 3\boldcdot {x}=21\)
\(\displaystyle x=21\div3\)
\(\displaystyle x=\frac13\boldcdot {21}\)
Notice that the number 3 is not seen in the diagram; the 3 comes from counting 3 boxes representing 3 equal parts in 21.
We can use the diagram or any of the equations to reason that the value of \(x\) is 7.
Diagram B has 2 parts that add to 21. Here are some equations that all represent diagram B:
\(\displaystyle y+3=21\)
\(\displaystyle y=21-3\)
\(\displaystyle 3=21-y\)
We can use the diagram or any of the equations to reason that the value of \(y\) is 18.