Lesson 17
Two Related Quantities, Part 2
17.1: Walking to the Library (10 minutes)
Warm-up
Students reason about the relationship between distance, rate, and time to solve a problem. The purpose is to reactivate what students know about constant speed contexts, where constant speed is represented by a set of equivalent ratios associating distance traveled and elapsed time. In the longer activity that follows, students represent a constant speed context using a table, equations, and graphs.
As students work, watch for different representations used (particularly tables) as well as for students who calculate each person's speed in miles per hour or each person's pace in hours per mile.
Launch
Consider starting off by having students close their books or devices, and display the following situation. Ask students, "What do you notice?" "What do you wonder?"
Lin and Jada each leave school at 3 p.m. to walk to the library. They each walk at a steady rate. When do they arrive?
Give them 1 minute to think of at least one thing they notice and one thing they wonder.
Students might notice that they leave at 3 p.m., that they walk at a steady rate (also called a constant speed), and that there is not enough information given to answer the question.
Students might wonder many things, but in order to answer the question, they would need to know:
- How fast do they each walk?
- How far away is the library?
Ask students to open their books or devices and use the additional information to solve the problem by any method they choose. If desired, remind students of tools that may be appropriate including double number lines or tables of equivalent ratios.
Student Facing
Lin and Jada each walk at a steady rate from school to the library. Lin can walk 13 miles in 5 hours, and Jada can walk 25 miles in 10 hours. They each leave school at 3:00 and walk \(3\frac14\) miles to the library. What time do they each arrive?
Student Response
For access, consult one of our IM Certified Partners.
Activity Synthesis
Invite students who used different representations and lines of reasoning to share. If no student mentions it, demonstrate how to represent on person's trip using a table of equivalent ratios with columns representing distance and time. Ask a student to explain how to use the table to reason about the distance traveled in 1 hour and the time it takes to travel 1 mile.
One way to reason is to notice that Lin can walk 26 miles in 10 hours, so she walks slightly faster than Jada (who can complete 25 miles in 10 hours) and should arrive a bit sooner. Both of these ways of reasoning are in preparation for the following activity.
17.2: The Walk-a-thon (25 minutes)
Activity
This activity revisits the familiar context of traveling at a constant rate. Students calculate and compare the unit rates in miles per hour for three people and consider the graphs and equations that describe the distance–time relationship.
Launch
Give students access to colored pencils and 5–8 minutes of quiet work time, followed by a whole-class discussion.
Supports accessibility for: Organization; Attention
Student Facing
Diego, Elena, and Andre participated in a walk-a-thon to raise money for cancer research. They each walked at a constant rate, but their rates were different.
- Complete the table to show how far each participant walked during the walk-a-thon.
time in hours miles walked
by Diegomiles walked
by Elenamiles walked
by Andre1 2 6 12 11 5 17.5 - How fast was each participant walking in miles per hour?
- How long did it take each participant to walk one mile?
-
Graph the progress of each person in the coordinate plane. Use a different color for each participant.
-
Diego says that \(d=3t\) represents his walk, where \(d\) is the distance walked in miles and \(t\) is the time in hours.
- Explain why \(d=3t\) relates the distance Diego walked to the time it took.
- Write two equations that relate distance and time: one for Elena and one for Andre.
- Use the equations you wrote to predict how far each participant would walk, at their same rate, in 8 hours.
- For Diego’s equation and the equations you wrote, which is the dependent variable and which is the independent variable?
Student Response
For access, consult one of our IM Certified Partners.
Launch
Give students access to colored pencils and 5–8 minutes of quiet work time, followed by a whole-class discussion.
Supports accessibility for: Organization; Attention
Student Facing
Diego, Elena, and Andre participated in a walk-a-thon to raise money for cancer research. They each walked at a constant rate, but their rates were different.
- Complete the table to show how far each participant walked during the walk-a-thon.
time in hours miles walked
by Diegomiles walked
by Elenamiles walked
by Andre1 2 6 12 11 5 17.5 - How fast was each participant walking in miles per hour?
- How long did it take each participant to walk one mile?
- Graph the progress of each person in the coordinate plane. Use a different color for each participant.
-
Diego says that \(d=3t\) represents his walk, where \(d\) is the distance walked in miles and \(t\) is the time in hours.
- Explain why \(d=3t\) relates the distance Diego walked to the time it took.
- Write two equations that relate distance and time: one for Elena and one for Andre.
- Use the equations you wrote to predict how far each participant would walk, at their same rate, in 8 hours.
- For Diego's equation and the equations you wrote, which is the dependent variable and which is the independent variable?
Student Response
For access, consult one of our IM Certified Partners.
Student Facing
Are you ready for more?
- Two trains are traveling toward each other, on parallel tracks. Train A is moving at a constant speed of 70 miles per hour. Train B is moving at a constant speed of 50 miles per hour. The trains are initially 320 miles apart. How long will it take them to meet? One way to start thinking about this problem is to make a table. Add as many rows as you like.
-
How long will it take a train traveling at 120 miles per hour to go 320 miles?
- Explain the connection between these two problems.
| train A | train B | |
|---|---|---|
| starting position | 0 miles | 320 miles |
| after 1 hour | 70 miles | 270 miles |
| after 2 hours | ||
Student Response
For access, consult one of our IM Certified Partners.
Activity Synthesis
The goal of the discussion is to ensure that students understand how each of the table, graph, and equations represent the situation and how they are connected to each other. Consider asking some of the following questions:
- “How can you determine from the table who walked the fastest and slowest?”
- “How can you determine from the graph who walked the fastest and slowest?”
- “How can you determine from the equations who walked the fastest and slowest?”
- “If distance was the independent variable, how would the equations and graphs be different?”
Design Principles(s): Cultivate conversation; Maximize meta-awareness
Lesson Synthesis
Lesson Synthesis
Ask students to think about the different representations they used for a situation involving time, distance, and a constant rate. Invite their thoughts on which representations would be most helpful in finding unknown quantities in different situations. Ask what factors they would consider in deciding which quantity to set as the independent variable when writing an equation to describe a situation.
17.3: Cool-down - Interpret the Point (5 minutes)
Cool-Down
For access, consult one of our IM Certified Partners.
Student Lesson Summary
Student Facing
Equations are very useful for solving problems with constant speeds. Here is an example.
A boat is traveling at a constant speed of 25 miles per hour.
- How far can the boat travel in 3.25 hours?
- How long does it take for the boat to travel 60 miles?
We can write equations to help us answer questions like these.
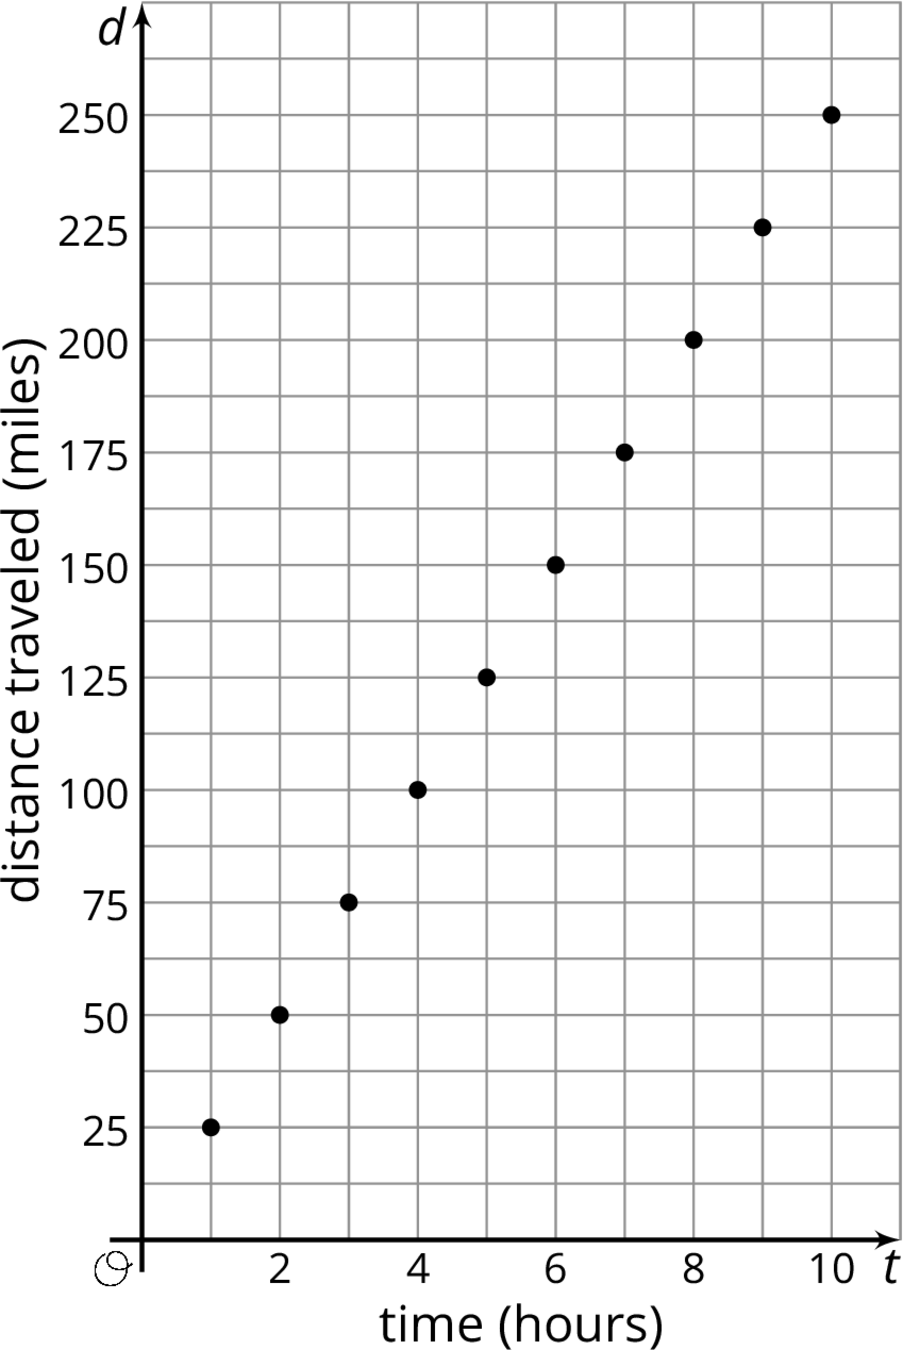
Let's use \(t\) to represent the time in hours and \(d\) to represent the distance in miles that the boat travels.
When we know the time and want to find the distance, we can write: \(\displaystyle d = 25t\)
In this equation, if \(t\) changes, \(d\) is affected by the change, so we \(t\) is the independent variable and \(d\) is the dependent variable.
This equation can help us find \(d\) when we have any value of \(t\). In \(3.25\) hours, the boat can travel \(25(3.25)\) or \(81.25\) miles.
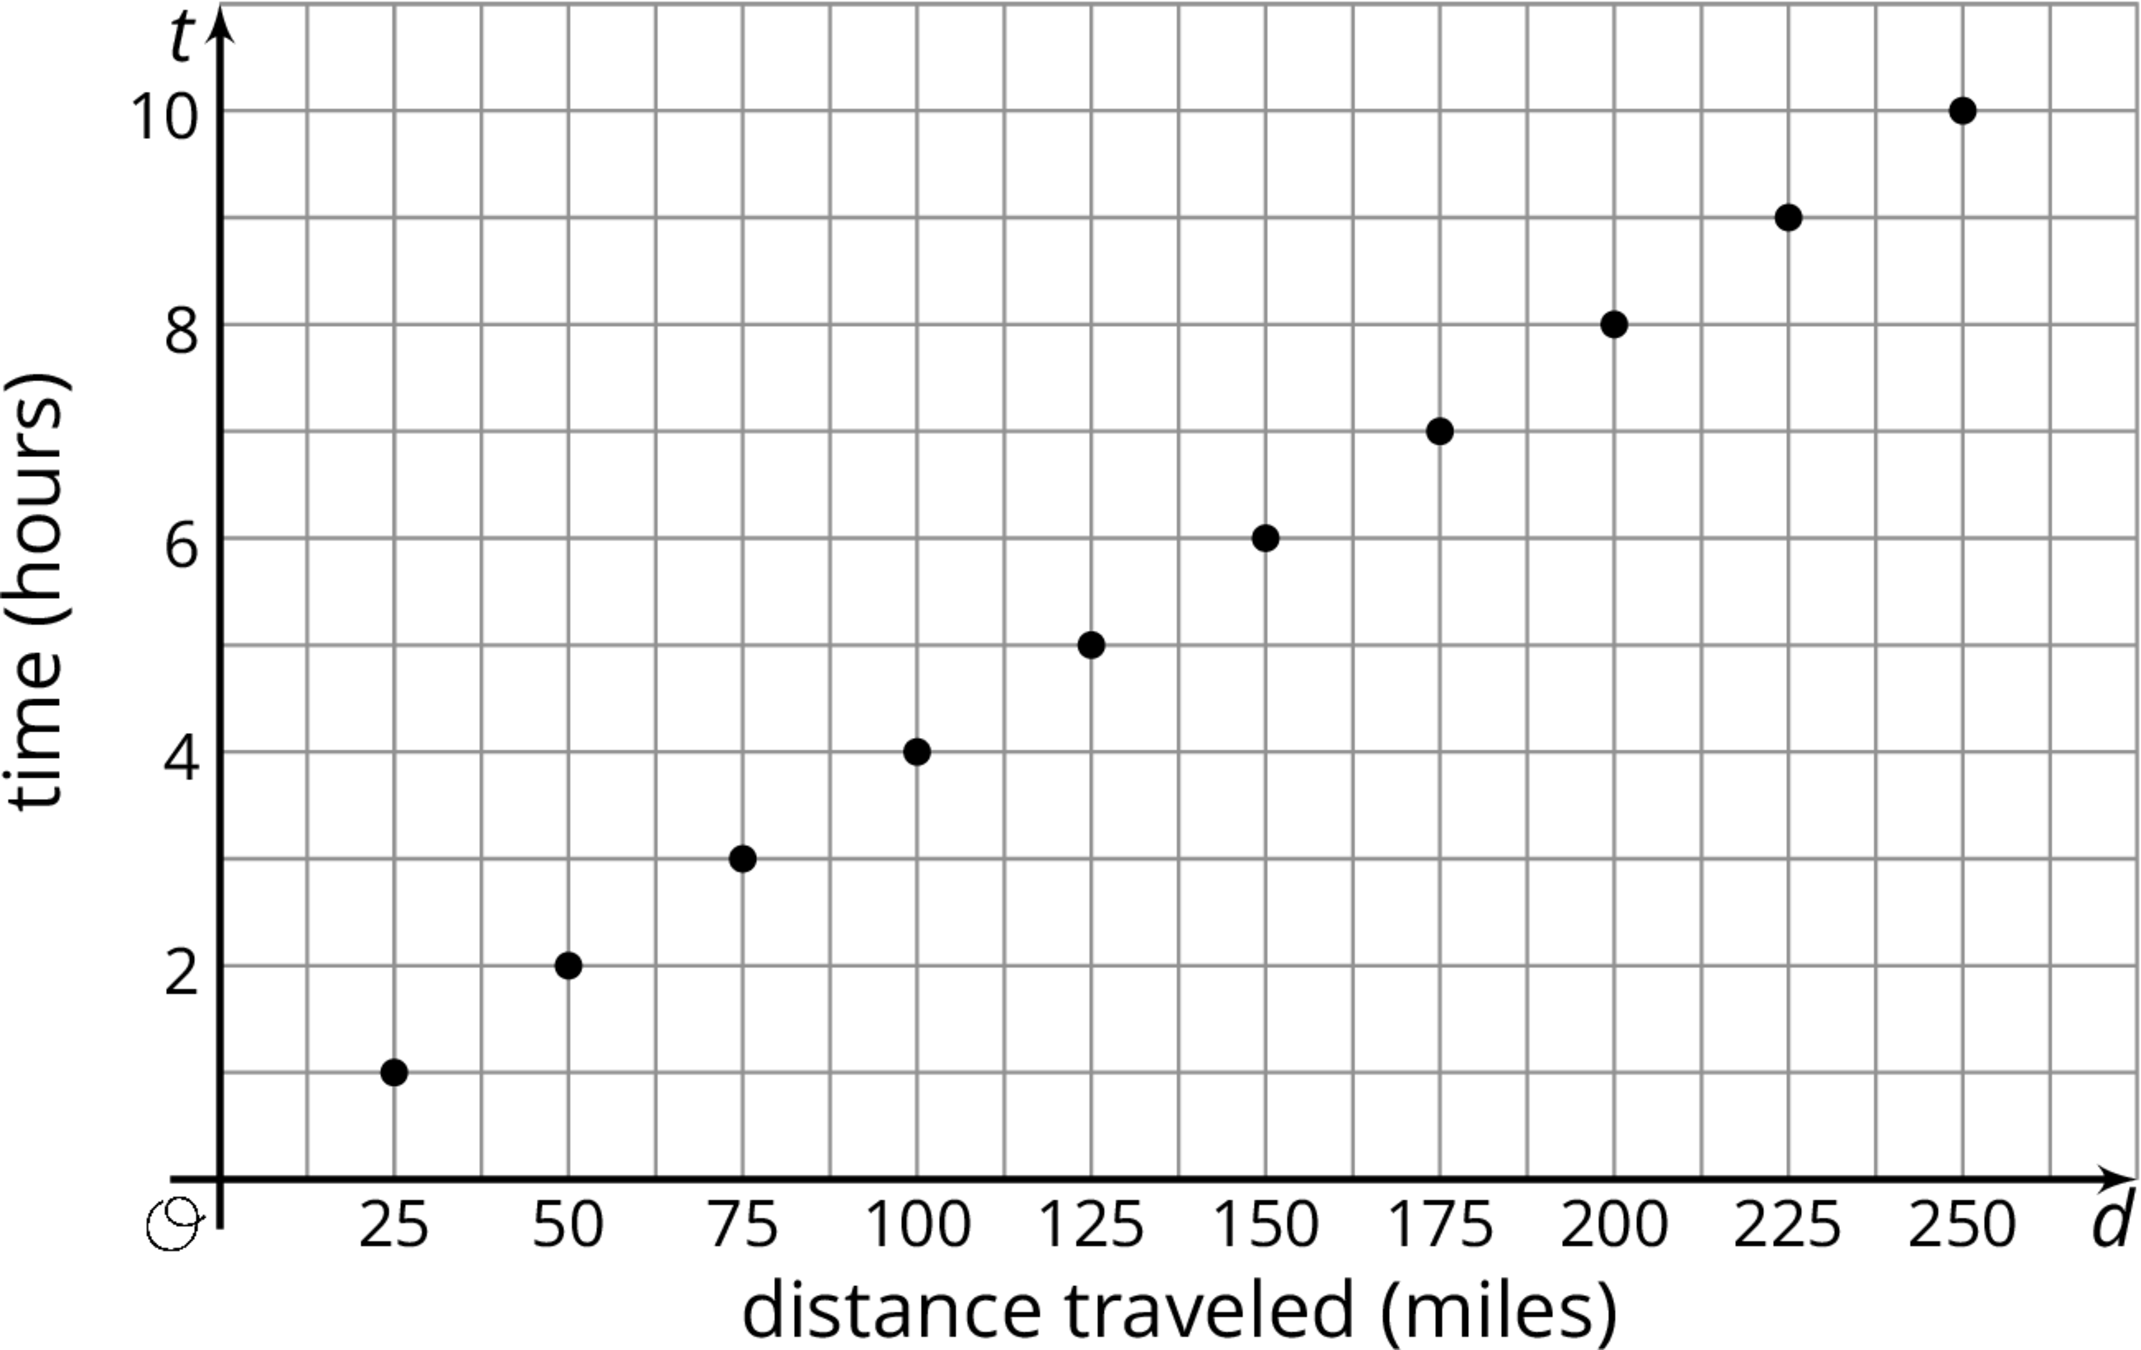
When we know the distance and want to find the time, we can write: \(\displaystyle t = \frac{d}{25}\) In this equation, if \(d\) changes, \(t\) is affected by the change, so we \(d\) is the independent variable and \(t\) is the dependent variable.
This equation can help us find \(t\) when for any value of \(d\). To travel 60 miles, it will take \(\frac{60}{25}\) or \(2 \frac{2}{5}\) hours.
These problems can also be solved using important ratio techniques such as a table of equivalent ratios. The equations are particularly valuable in this case because the answers are not round numbers or easy to quickly evaluate.
We can also graph the two equations we wrote to get a visual picture of the relationship between the two quantities: