Lesson 16
Two Related Quantities, Part 1
16.1: Which One Would You Choose? (5 minutes)
Warm-up
The purpose of this warm-up is for students to remember that unit price can be used to figure out which price option is a better deal and also how to compute unit price. When students explain their reasoning, they may engage in constructing arguments and critiquing the reasoning of their classmates (MP3). The question, “Which one would you choose?” is purposefully asked because there is not one correct answer. While there is a choice that is a better deal, that is not the question. In defending their reasoning, students may have other reasons for their choice based on how they make sense of the context. For example, students might reason that a 5-gallon container is easier to store, or that 3 1-gallon containers are easier to share, or they might reject both options because they don't like honey.
As students work, listen for reasoning about the problem in different ways to share in the whole-class discussion. Choose at least one student who reasoned by finding the unit cost.
Launch
Arrange students in groups of 2. Give 1 minute of quiet think time followed by 1 minute to discuss their responses with a partner. Follow with a whole-class discussion.
Student Facing
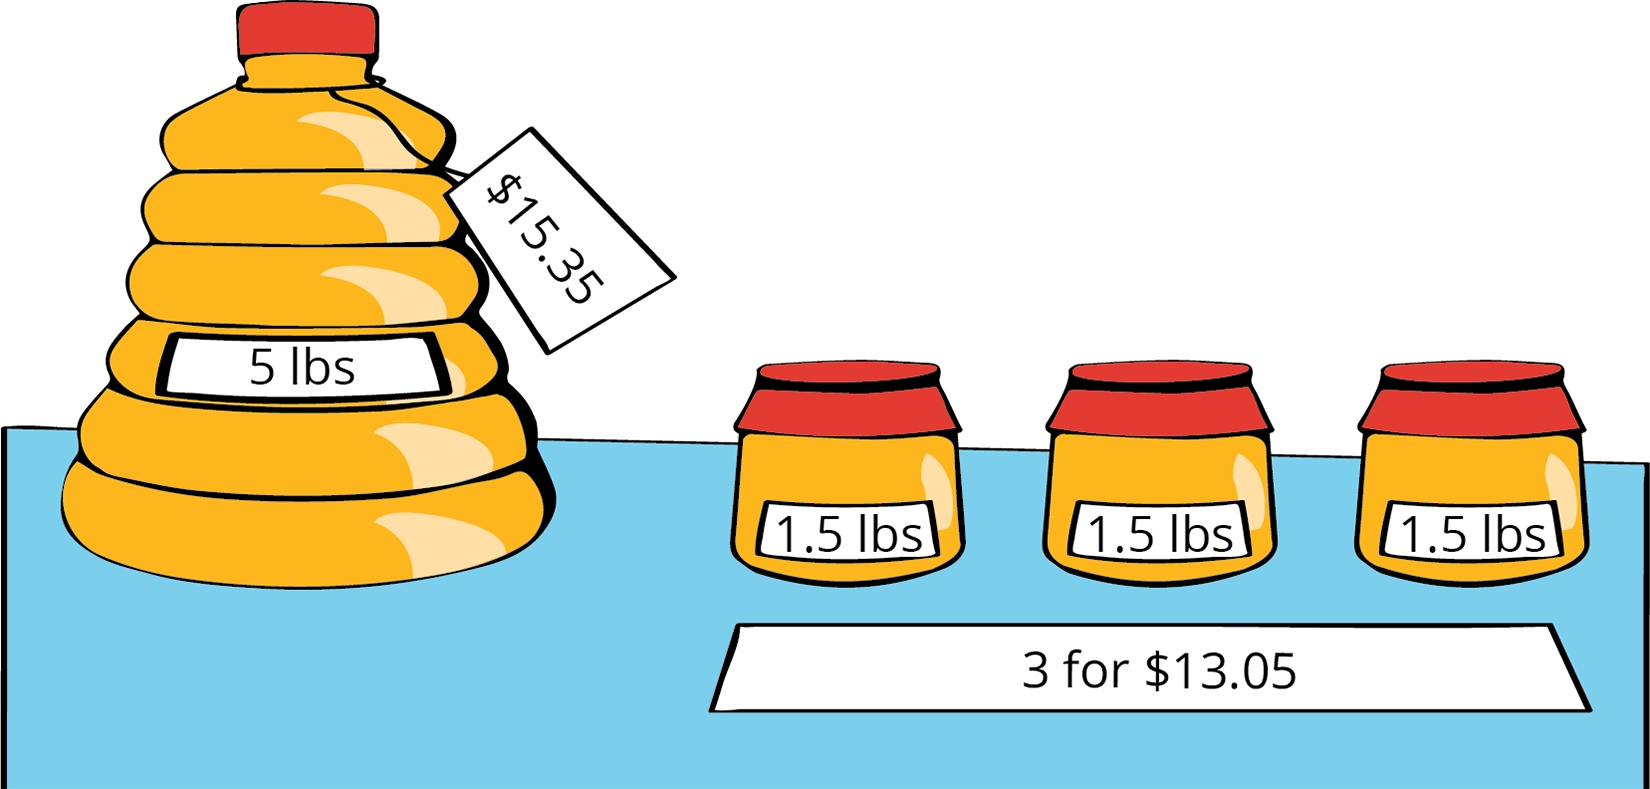
Which one would you choose? Be prepared to explain your reasoning.
- A 5-pound jug of honey for $15.35
- Three 1.5-pound jars of honey for $13.05
Student Response
For access, consult one of our IM Certified Partners.
Anticipated Misconceptions
Students may choose the 5 pound jug because they assume that larger quantities are a better deal. Ask if they can be more precise in their reasoning and defend it mathematically.
Activity Synthesis
Poll the class to find who selected each of the options. Ask selected students to share their reasoning. Record and display their responses for all to see. To involve more students in the conversation, consider asking:
- “Who can restate ___’s reasoning in a different way?”
- “Does anyone want to add on to _____’s reasoning?”
- “Do you agree or disagree? Why?”
16.2: Painting the Set (25 minutes)
Activity
This activity helps students recall what they know about solving problems in a ratio context, and then extends their thinking to consider writing two equations that relate the two quantities in the ratio and representing them with graphs.
Launch
Explain the meaning of independent variable and dependent variable. (This can be done before students start working, or you can have students pause after completing the table.) An example may help: Suppose Lin and her neighbor share the same birthday, but Lin is 3 years older. You can find the neighbor's age by taking Lin’s age and subtracting 3. If Lin’s age is represented by \(L\), and her neighbor’s age is represented by \(n\), then the equation \(n=L-3\) describes the relationship. In this equation, the value of \(n\) depends on the value of \(L\), so we call \(n\) the dependent variable and \(L\) the independent variable.
Give students 5-8 minutes of quiet work time, followed by a whole-class discussion.
Some students may not be familiar with the word “set” in this context. Explain that it means the scenery and other props and objects that are used on stage during a play or production.
Supports accessibility for: Conceptual processing; Memory
Student Facing
Lin needs to mix a specific shade of orange paint for the set of the school play. The color uses 3 parts yellow for every 2 parts red.
-
Complete the table to show different combinations of red and yellow paint that will make the shade of orange Lin needs.
cups of red paint \((r)\) cups of yellow paint \((y)\) total cups of paint \((t)\) 2 3 6 20 18 14 16 50 42 -
Lin notices that the number of cups of red paint is always \(\frac25\) of the total number of cups. She writes the equation \(r=\frac25 t\) to describe the relationship. Which is the independent variable? Which is the dependent variable? Explain how you know.
-
Write an equation that describes the relationship between \(r\) and \(y\) where \(y\) is the independent variable.
-
Write an equation that describes the relationship between \(y\) and \(r\) where \(r\) is the independent variable.
-
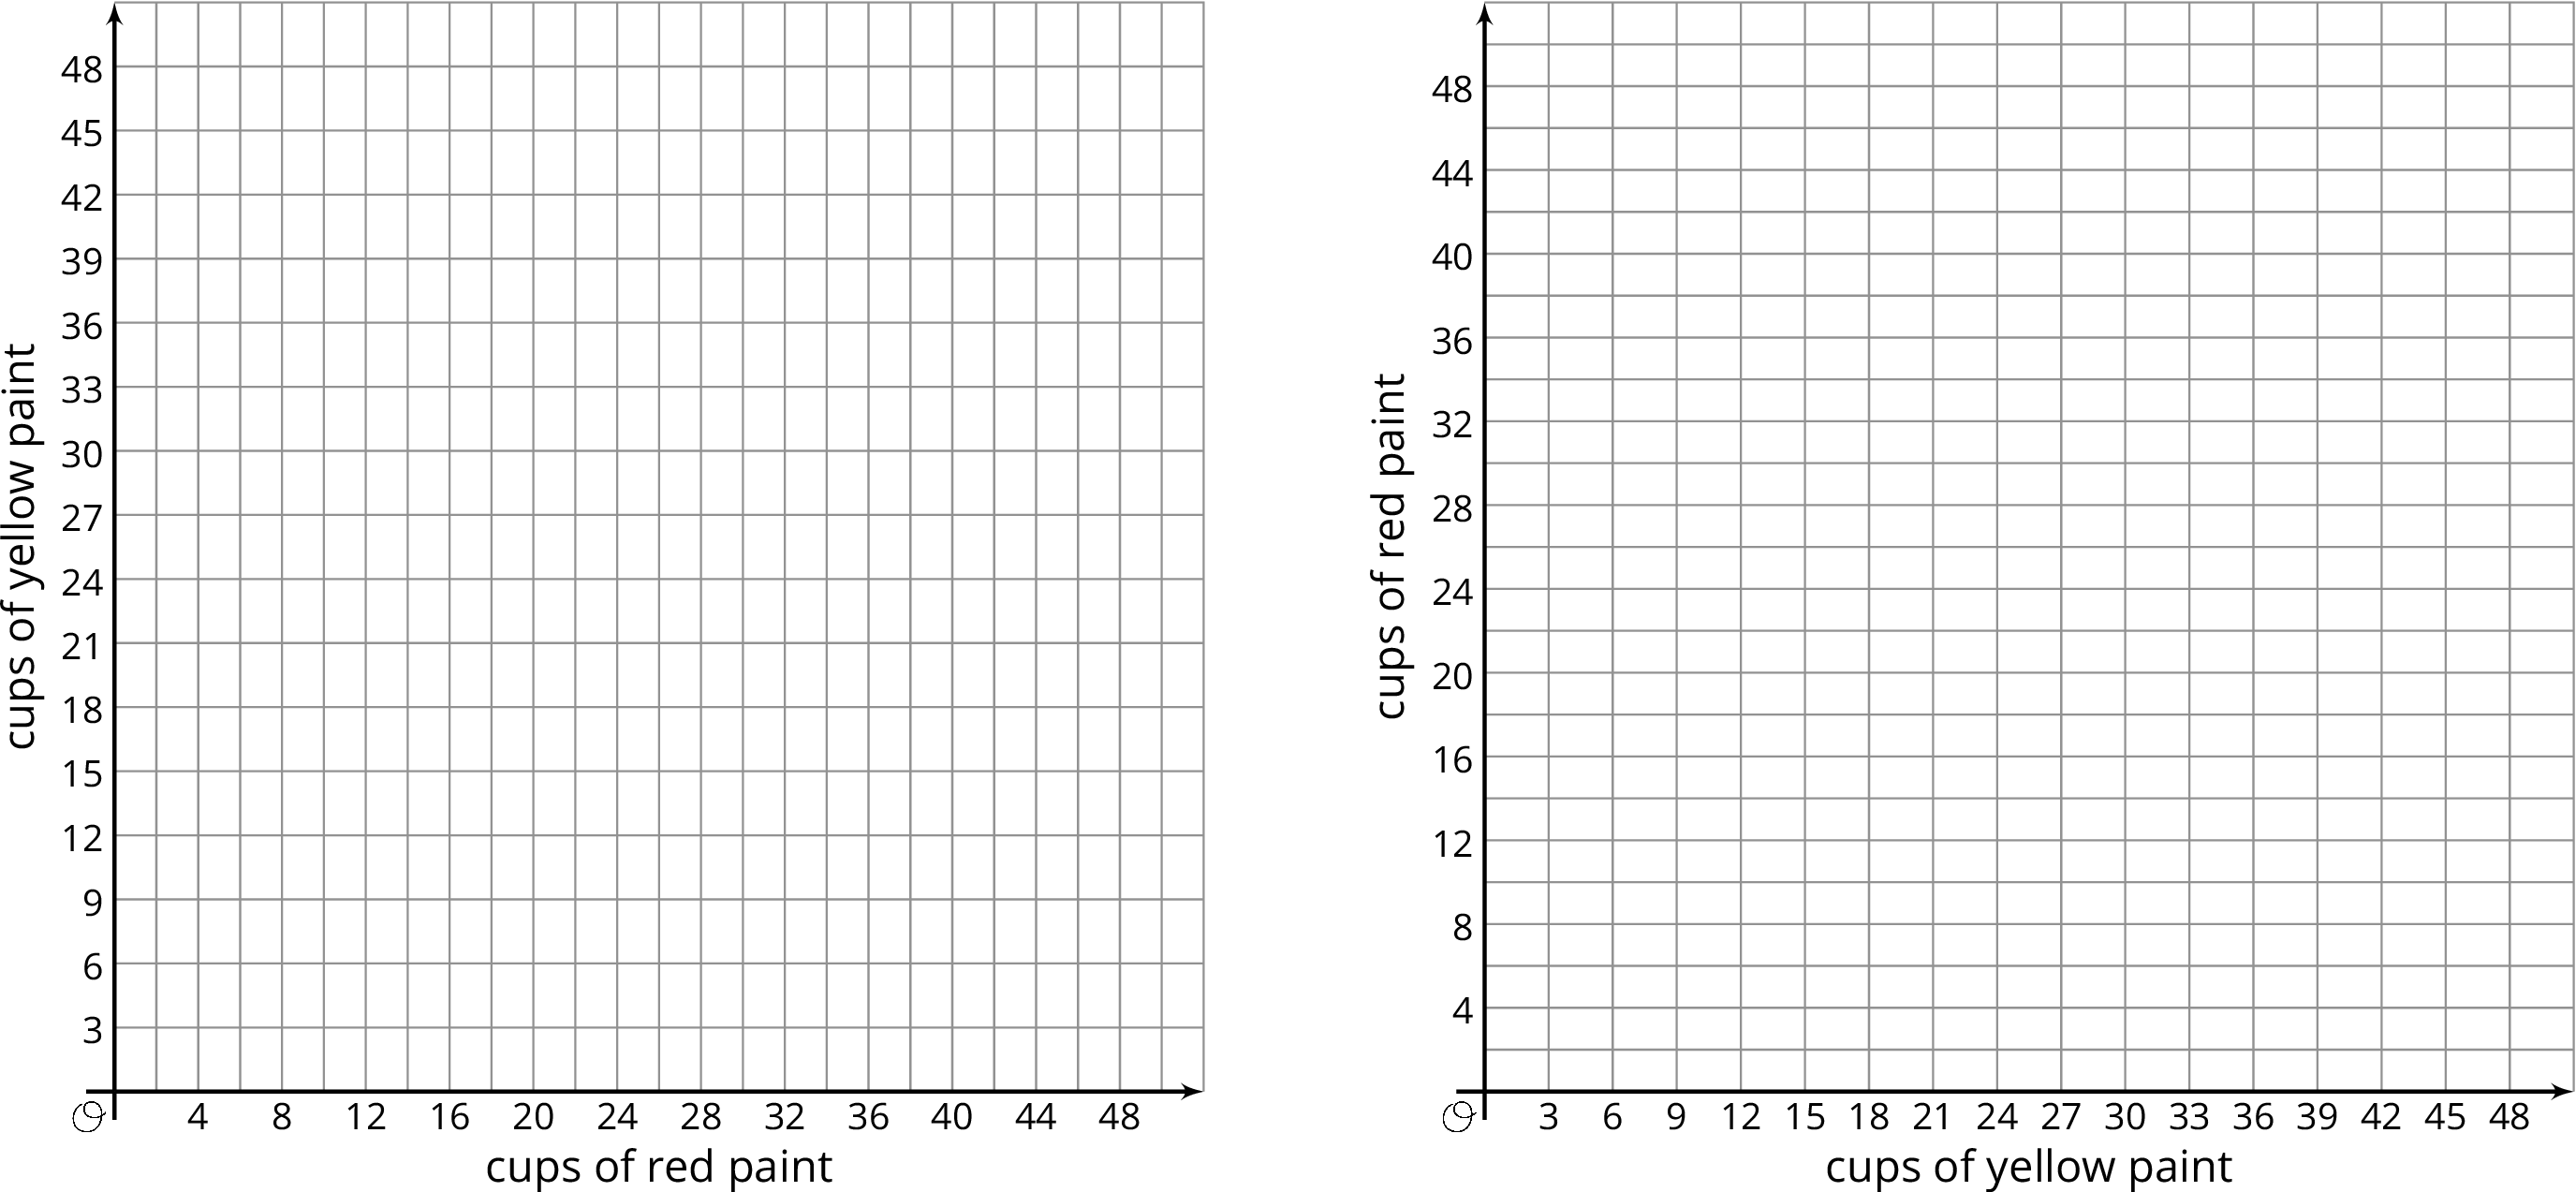
Use the points in the table to create two graphs that show the relationship between \(r\) and \(y\). Match each relationship to one of the equations you wrote.
Student Response
For access, consult one of our IM Certified Partners.
Launch
Explain the meaning of independent variable and dependent variable. (This can be done before students start working, or you can have students pause after completing the table.) An example may help: Suppose Lin and her neighbor share the same birthday, but Lin is 3 years older. You can find the neighbor's age by taking Lin’s age and subtracting 3. If Lin’s age is represented by \(L\), and her neighbor’s age is represented by \(n\), then the equation \(n=L-3\) describes the relationship. In this equation, the value of \(n\) depends on the value of \(L\), so we call \(n\) the dependent variable and \(L\) the independent variable.
Give students 5-8 minutes of quiet work time, followed by a whole-class discussion.
Some students may not be familiar with the word “set” in this context. Explain that it means the scenery and other props and objects that are used on stage during a play or production.
Supports accessibility for: Conceptual processing; Memory
Student Facing
Lin needs to mix a specific shade of orange paint for the set of the school play. The color uses 3 parts yellow for every 2 parts red.
-
Complete the table to show different combinations of red and yellow paint that will make the shade of orange Lin needs.
cups of red paint \((r)\) cups of yellow paint \((y)\) total cups of paint \((t)\) 2 3 6 20 18 14 16 50 42 - Lin notices that the number of cups of red paint is always \(\frac25\) of the total number of cups. She writes the equation \(r=\frac25 t\) to describe the relationship. Which is the independent variable? Which is the dependent variable? Explain how you know.
- Write an equation that describes the relationship between \(r\) and \(y\) where \(y\) is the independent variable.
- Write an equation that describes the relationship between \(y\) and \(r\) where \(r\) is the independent variable.
- Use the points in the table to create two graphs that show the relationship between \(r\) and \(y\). Match each relationship to one of the equations you wrote.
Student Response
For access, consult one of our IM Certified Partners.
Student Facing
Are you ready for more?
A fruit stand sells apples, peaches, and tomatoes. Today, they sold 4 apples for every 5 peaches. They sold 2 peaches for every 3 tomatoes. They sold 132 pieces of fruit in total. How many of each fruit did they sell?
Student Response
For access, consult one of our IM Certified Partners.
Anticipated Misconceptions
For students who struggle to write an equation that relates the two quantities, help them to represent the situation in a concrete way, like with a tape diagram or a discrete diagram. You can also draw their attention to the completed table: “What can you do to each number in the \(r\) column to get the number in the \(y\) column?” Expressing the relationship in words can be a helpful step to expressing it with an equation.
Activity Synthesis
The discussion should focus on how all the representations (tables, equations, graphs) capture the same information but look at it in a different way.
Some guiding questions:
- “Why is it possible to write two different equations to describe the same situation?” (You can choose either quantity to be the dependent variable.)
- “What do you notice about the numbers that multiply by the independent variable in each equation?” (They are reciprocals, they represent the two unit rates for the situation.)
- “Are there other equations we could have written that describe this situation?” (Yes, for example, we can write equations to describe the relationship between the amount of yellow paint and the total number of cups: \(y=\frac35 t\) and \(t=\frac53 y\))
- “What do you notice about the similarities and differences between the graphs?” (Both have points that appear to lie on a line, both lines go up as you move to the right, the line for Lin’s equation slants up more, the coordinates of the points are reversed.)
Design Principle(s): Optimize output (for comparison)
Lesson Synthesis
Lesson Synthesis
In this lesson we revisited equivalent ratios by writing equations that represent sets of equivalent ratios and graphing them. Some guiding questions for discussion:
- “We wrote two equations to represent the relationship between cups of red paint and cups of yellow paint. How were these the same and how were they different?”
- “Explain the meaning of dependent and independent variable.”
- “How do you know which quantity to choose as the independent variable when you write an equation to describe a situation?” (It depends on what you know and what you need to calculate.)
- “When we first studied equivalent ratios, we used double number lines and tables. How do graphs and equations add to your understanding of equivalent ratios? Do they help in solving problems? If so, how?”
16.3: Cool-down - Baking Brownies (5 minutes)
Cool-Down
For access, consult one of our IM Certified Partners.
Student Lesson Summary
Student Facing
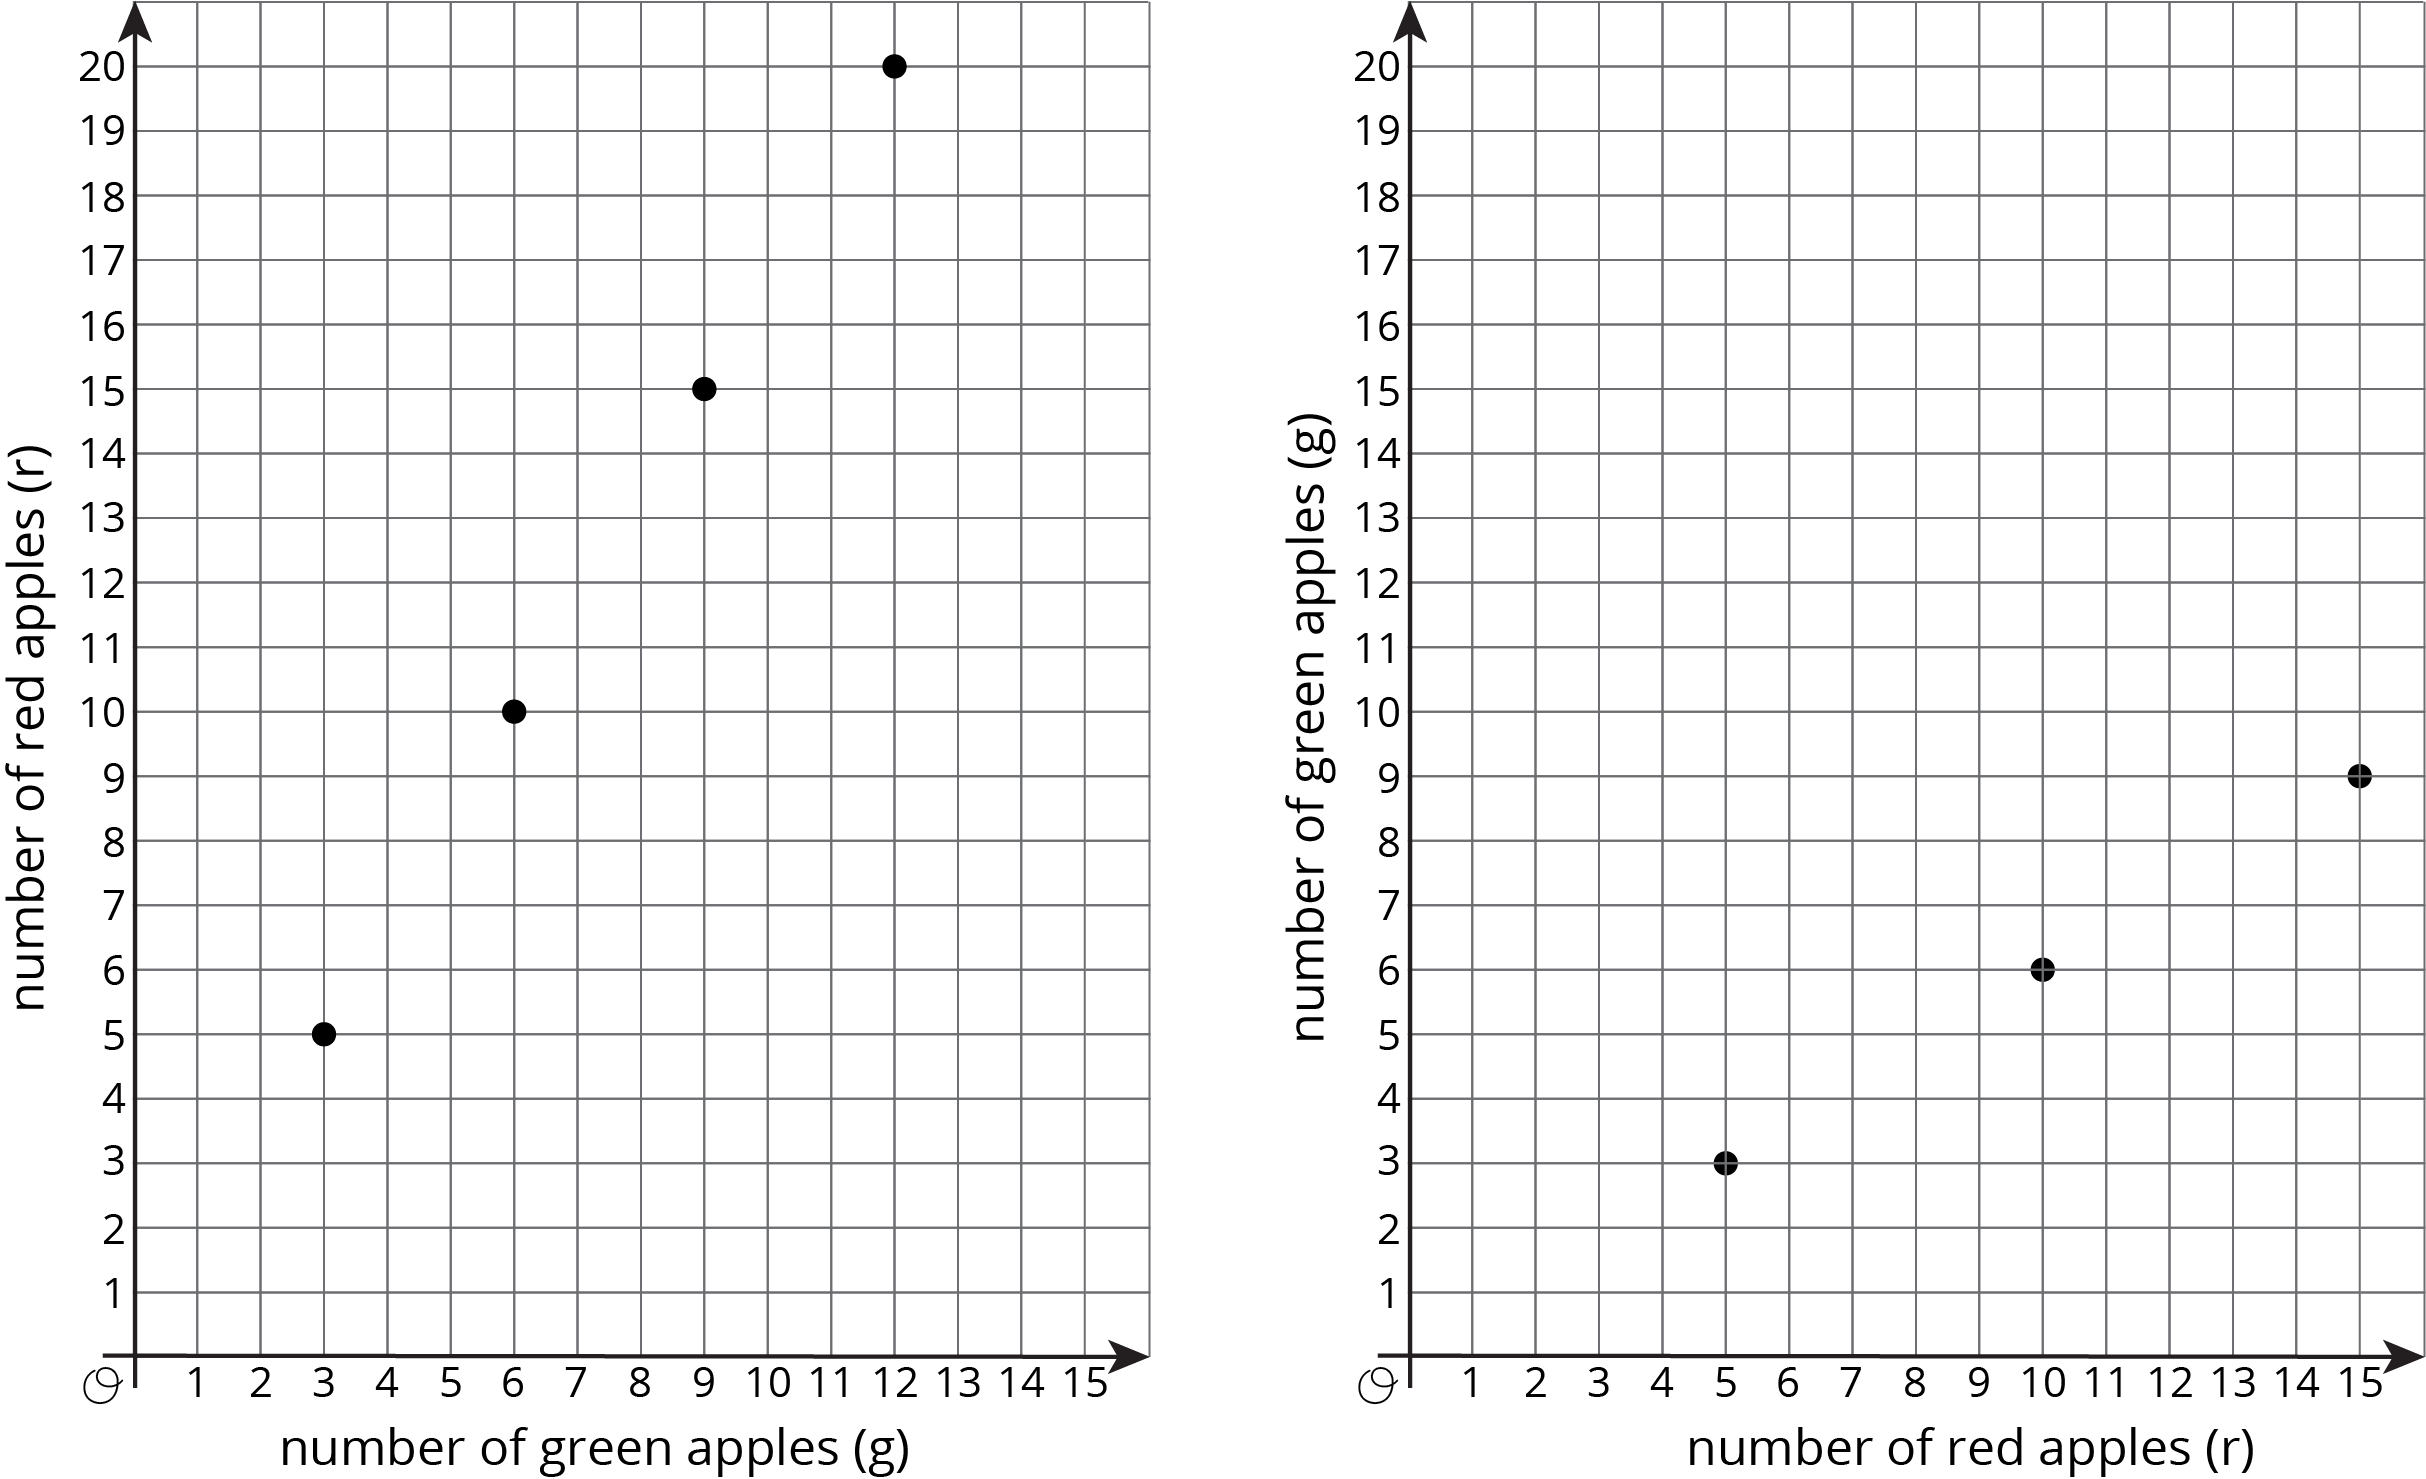
Equations are very useful for describing sets of equivalent ratios. Here is an example.
A pie recipe calls for 3 green apples for every 5 red apples. We can create a table to show some equivalent ratios.
We can see from the table that \(r\) is always \(\frac53\) as large as \(g\) and that \(g\) is always \(\frac35\) as large as \(r\).
| green apples (\(g\)) | red apples (\(r\)) |
|---|---|
| 3 | 5 |
| 6 | 10 |
| 9 | 15 |
| 12 | 20 |
We can write equations to describe the relationship between \(g\) and \(r\).
-
When we know the number of green apples and want to find the number of red apples, we can write:
\(\displaystyle r=\frac53g\)
In this equation, if \(g\) changes, \(r\) is affected by the change, so we refer to \(g\) as the independent variable and \(r\) as the dependent variable.
We can use this equation with any value of \(g\) to find \(r\). If 270 green apples are used, then \(\frac53 \boldcdot (270)\) or 450 red apples are used.
-
When we know the number of red apples and want to find the number of green apples, we can write:
\(\displaystyle g=\frac35r\)
In this equation, if \(r\) changes, \(g\) is affected by the change, so we refer to \(r\) as the independent variable and \(g\) as the dependent variable.
We can use this equation with any value of \(r\) to find \(g\). If 275 red apples are used, then \(\frac35 \boldcdot (275)\) or 165 green apples are used.
We can also graph the two equations we wrote to get a visual picture of the relationship between the two quantities.