Lesson 12
Percentages and Tape Diagrams
Lesson Narrative
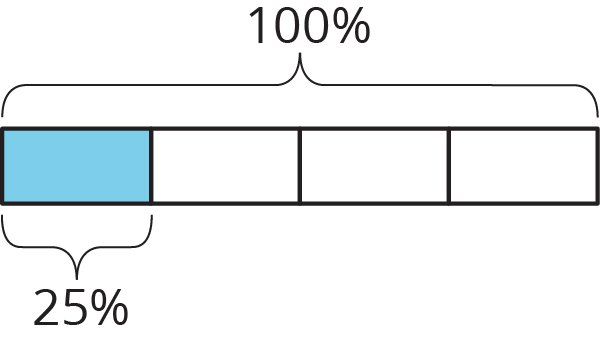
In previous lessons students used double number lines to reason about percentages. Double number lines show different percentages when a given amount is identified as 100%, and emphasize that percentages are a rate per 100. In this lesson they use tape diagrams. Tape diagrams are useful for seeing the connection between percentages and fractions. For example, this tape diagram shows that 25% of a whole is the same as \(\frac14\) of that whole by showing that 25% of the whole is one part when 100% of the whole is divided into four equal parts.
Tape diagrams are also useful in solving problems of the form \(A\) is \(B\%\) of \(C\) when you are given two of the numbers and must find the third. When reasoning about percentages, it is important to indicate the whole as 100%, just as it is important to indicate the whole when working with fractions (MP6).
Learning Goals
Teacher Facing
- Choose and create diagrams to solve problems such as A% of B is ? and A% of ? is C.
- Draw and label a tape diagram to represent a situation involving percentages.
- Interpret tape diagrams that represent multiplicative comparisons and express such comparisons using fractions and percentages.
Student Facing
Let's use tape diagrams to understand percentages.
Learning Targets
Student Facing
- I can use tape diagrams to solve different problems like “What is 40% of 60?” or “60 is 40% of what number?”
CCSS Standards
Print Formatted Materials
For access, consult one of our IM Certified Partners.
Additional Resources
| Google Slides | For access, consult one of our IM Certified Partners. |
|
| PowerPoint Slides | For access, consult one of our IM Certified Partners. |