Lesson 7
Scale Drawings
7.1: What is a Scale Drawing? (5 minutes)
Warm-up
This activity encourages students to notice characteristics of scale drawings by observing examples and counterexamples, and to articulate what a scale drawing is. Though students are not expected to come up with precise definitions, they are likely able to intuit that scale drawings are accurate two-dimensional depictions of what they represent, in the sense that all shapes, arrangements of parts, and relative sizes match those of the actual objects.
Expect student observations about scale drawings to be informal and not mathematical. For example, they might say that a scale drawing looks just like the object it is portraying, with the parts shown having the right size and being in the right places in the drawing. Or that in a scale drawing, a smaller part in the actual object does not end up being larger in the drawing.
Like any mathematical model of a real situation, a scale drawing captures some important aspects of the real object and ignores other aspects. It may not be apparent to students that scale drawings prioritize features of one plane of the object (and sometimes features of other planes parallel to it) and ignore other surfaces and dimensions. Notice students who show insights around this idea so they can share later.
Launch
Arrange students in groups of 2. Before students look at the materials, poll the class to find out who has seen scale drawings. Ask a few students who are familiar with them to give a couple of examples of scale drawings they have seen. Then, give students 2 minutes to observe the examples and counterexamples of scale drawings and discuss in groups what they think a scale drawing is.
Student Facing
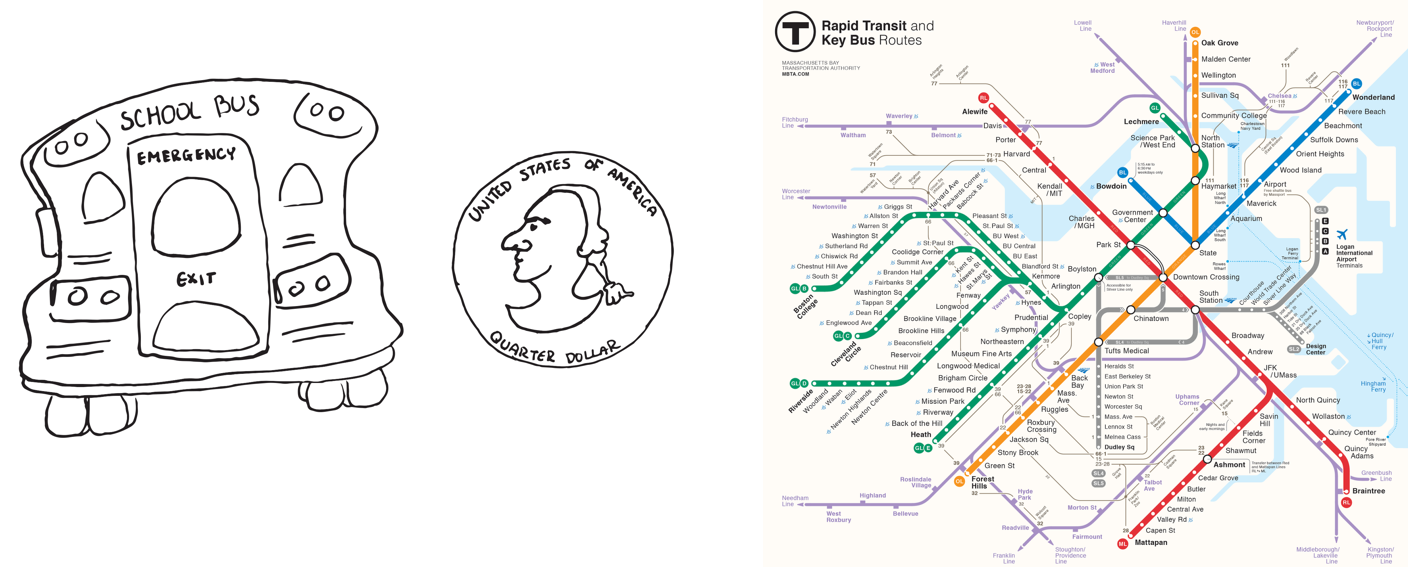
Here are some drawings of a school bus, a quarter, and the subway lines around Boston, Massachusetts. The first three drawings are scale drawings of these objects.

The next three drawings are not scale drawings of these objects.
Discuss with your partner what a scale drawing is.
Student Response
For access, consult one of our IM Certified Partners.
Anticipated Misconceptions
If students struggle to characterize scale drawings, offer prompts to encourage them to look closer. For example, ask: “How do the shapes and sizes of the objects in the drawings compare to those of the actual objects?” Students may say that sizes of the objects in the scale drawings are smaller than those of the actual objects. Ask them if any parts of the scale drawings are distorted, compared to the actual object—ask them to focus on the two images of the quarter, one of which is circular in shape while the other is not.
Activity Synthesis
Ask a few students to share what they noticed about characteristics of scale drawings and to compare and contrast scaled copies and scale drawings. Discuss questions such as the following. Record common themes and helpful descriptions.
- What do the examples have or show that the counterexamples do not?
- How are scale drawings like scaled copies you saw in earlier lessons? How are they different than scaled copies?
- What aspects of the bus, coin, and the city of Boston do the scale drawings show? What aspects of the actual objects do scale drawings not show?
Notice misconceptions, but it is not necessary to address them right away, as students’ understanding will be shaped in this and upcoming lessons. Tell students that they will continue to analyze scale drawings and revise their definitions in upcoming activities.
7.2: Sizing Up a Basketball Court (15 minutes)
Activity
In this introductory activity, students explore the meaning of scale. They begin to see that a scale communicates the relationship between lengths on a drawing and corresponding lengths in the objects they represent, and they learn some ways to express this relationship:
- “\(a\) units on the drawing represent \(b\) units of of actual length”
- “at a scale of \(a\) units (on the drawing) to \(b\) units (actual)”
- “\(a\) units (on the drawing) for every \(b\) units (actual)”
Students measure lengths on a scale drawing and use a given scale to find corresponding lengths on a basketball court (MP2). Because students are measuring to the nearest tenth of a centimeter, some of the actual measurements they calculate will not have the precision of the official measurements. For example, the official measurement for \(d\) is 0.9 m.
You will need the Sizing Up a Basketball Court blackline master for this activity.
Launch
Ask students if they have ever played basketball or seen a basketball court. If so, where? If some students have played basketball or seen a basketball court, ask them if they could throw a basketball across the width of a basketball court. What about across the full length of the court?
Arrange students in groups of 2. Distribute a copy of the blackline master and a ruler to each student. Give students 6–7 minutes of quiet work time to complete the first three questions. Ask them to share their responses with their partner before completing the remaining questions.
Design Principles(s): Optimize output (for explanation); Maximize meta-awareness
Student Facing
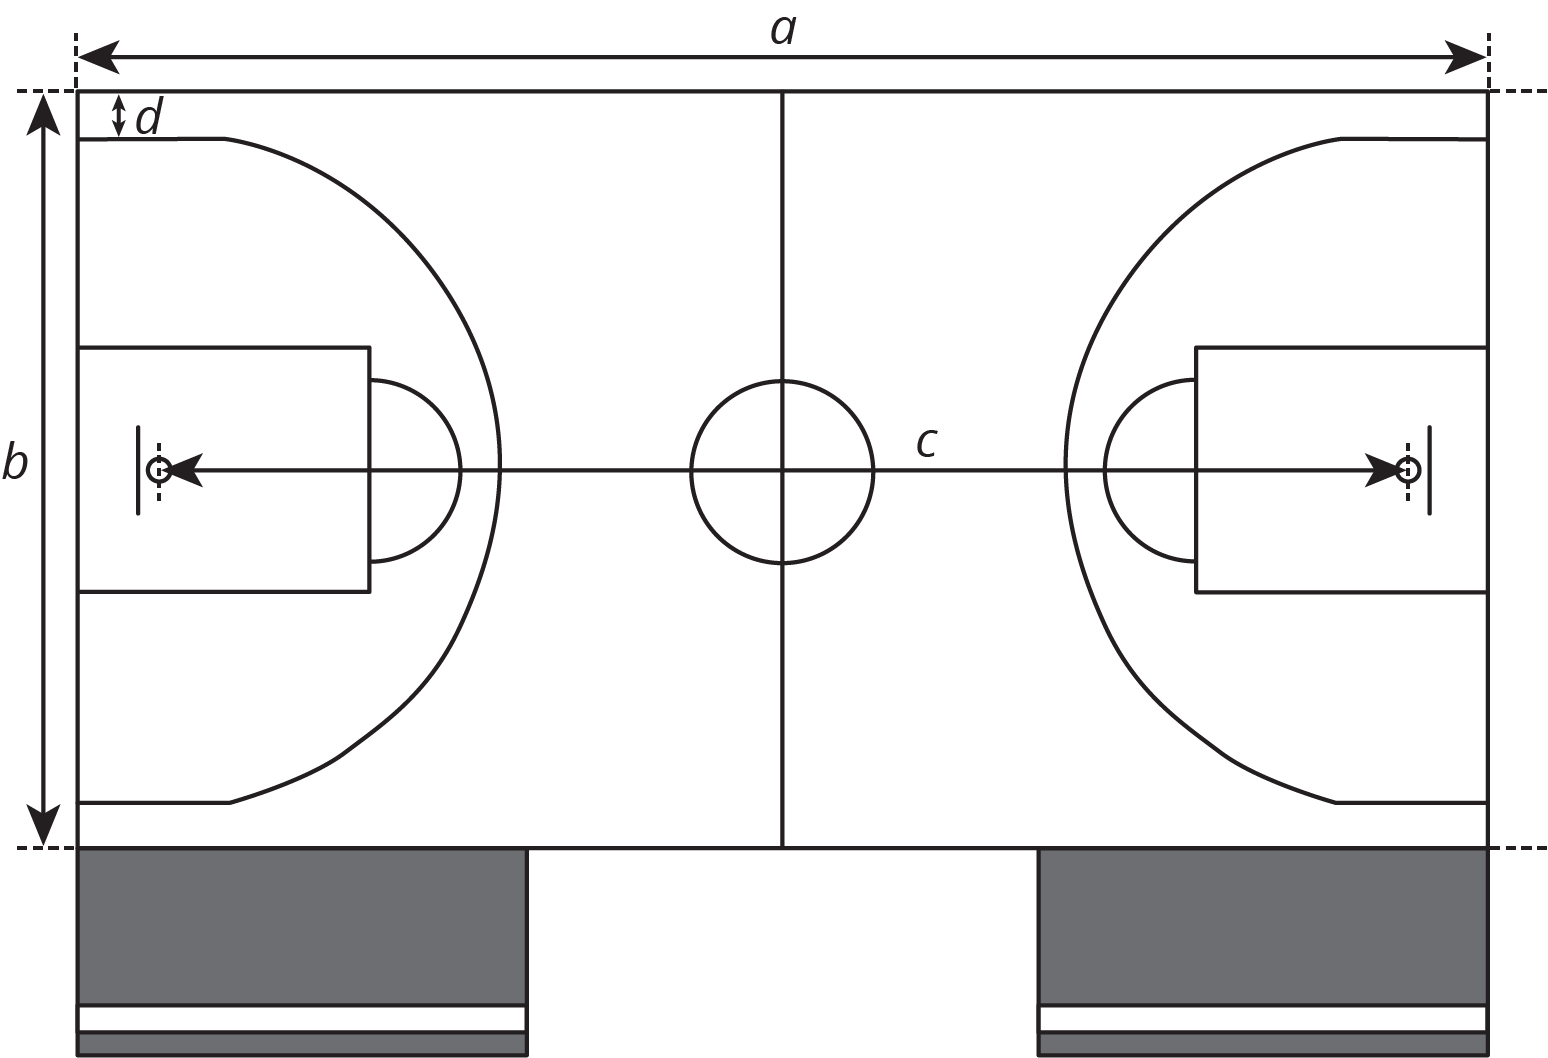
Your teacher will give you a scale drawing of a basketball court. The drawing does not have any measurements labeled, but it says that 1 centimeter represents 2 meters.
- Measure the distances on the scale drawing that are labeled a–d to the nearest tenth of a centimeter. Record your results in the first row of the table.
- The statement “1 cm represents 2 m” is the scale of the drawing. It can also be expressed as “1 cm to 2 m,” or “1 cm for every 2 m.” What do you think the scale tells us?
- How long would each measurement from the first question be on an actual basketball court? Explain or show your reasoning.
measurement (a) length
of court(b) width
of court(c) hoop
to hoop(d) 3 point line
to sidelinescale drawing actual court -
On an actual basketball court, the bench area is typically 9 meters long.
- Without measuring, determine how long the bench area should be on the scale drawing.
- Check your answer by measuring the bench area on the scale drawing. Did your prediction match your measurement?
Student Response
For access, consult one of our IM Certified Partners.
Anticipated Misconceptions
Instead of using the scale to find actual measurements, students might try to convert distances in centimeters to meters (14 cm is 0.14 m). Explain that the distances they measured on paper could be converted to meters, but then the results are still lengths on paper, just expressed in meters, rather than the measurements of the actual basketball court. Draw students’ attention to the statement “1 cm represents 2 m” on the scale drawing and ask them to think about how to use it to find actual measurements.
Activity Synthesis
Before debriefing as a class, display the table showing only the scaled distances so students can do a quick check of their measurements (which they may round differently). Explain to students that the distances on a scale drawing are often referred to as “scaled distances.” The distances on the basketball court, in this case, are called actual distances.
Focus the discussion on the meaning of scale and how students used the given scale to find actual distances. Invite a few students to share their response to the second and third questions. To further students’ understanding of scale, discuss:
- Does “1 cm for every 2 m” mean that the actual distance is twice that on the drawing? Why or why not?
- Which parts of the court should be drawn by using “1 cm for every 2 m” rule?
- Can we reverse the order in which we list the scaled and actual distances? For example, can we say “2 m of actual distance to 1 cm on the drawing” or “2 m to 1 cm”?
Note that the scaled distance is conventionally stated first, but the actual distance represented could also come first as long as it is clear from the context.
If needed, a short discussion about accuracy of measurements on the scale drawing might highlight some possible sources of measurement error including:
- Not measuring in a straight line
- The lines on the scale drawing have width, and this could contribute a small error depending on whether the measurement is from the inside or the outside of the lines
Supports accessibility for: Memory; Language
7.3: Tall Structures (15 minutes)
Activity
This activity introduces students to graphic scales. Students interpret them, use them to find actual measurements (heights of tall buildings), and express them non-graphically. In earlier lessons, students used markings on an index card or sheet of paper to measure a drawing and create scaled copies. Here, they use non-standard measuring tools again to solve problems (MP5). Students make markings on an unmarked straightedge to measure scaled lengths on a drawing, and then use the given scale to determine actual lengths. This measuring strategy builds on students’ work with measurement in grades 1 and 2 (i.e., placing multiple copies of a shorter object end to end and expressing lengths in terms of the number of objects).
As students work, encourage them to be as precise as possible in making their marks and in estimating lengths that are less than 1 scale-segment long. Most distances students are measuring here are not line segments but rather distances between a point (the tip of a building) and a line (the ground).
Monitor the different ways students reason about scaled and actual distances. Here are two likely approaches for finding the difference between the Burj Khalifa and the Eiffel Tower (the second question):
- Find the actual height of each tower and then find their difference.
- Find the difference in scaled heights, and then use the scale to find the difference in actual heights.
Select students who use these approaches to share during the whole-class discussion in this sequence.
Launch
Display the scale drawing of the structures. Before beginning the work of the task, students may be interested in or eager to share the locations of the structures. Consider taking a few minutes to elicit what they know, or display a world map showing the locations of the structures.
Ask students what the segment labeled with “0 m” and “100 m” might mean. Some students are likely to say that it also conveys a scale. Verify that a scale can indeed be communicated graphically; an actual distance is not represented by a numerical measurement, but rather, by the length of the segment.
Provide access to index cards or sheets of paper students can use to measure. Tell students to check their answers to the first question with a partner. Tell them to discuss as necessary until they reach an agreement before proceeding to work on the rest of the problems. Give students 4–5 minutes of quiet work time and partner discussion.
Student Facing
Here is a scale drawing of some of the world’s tallest structures.
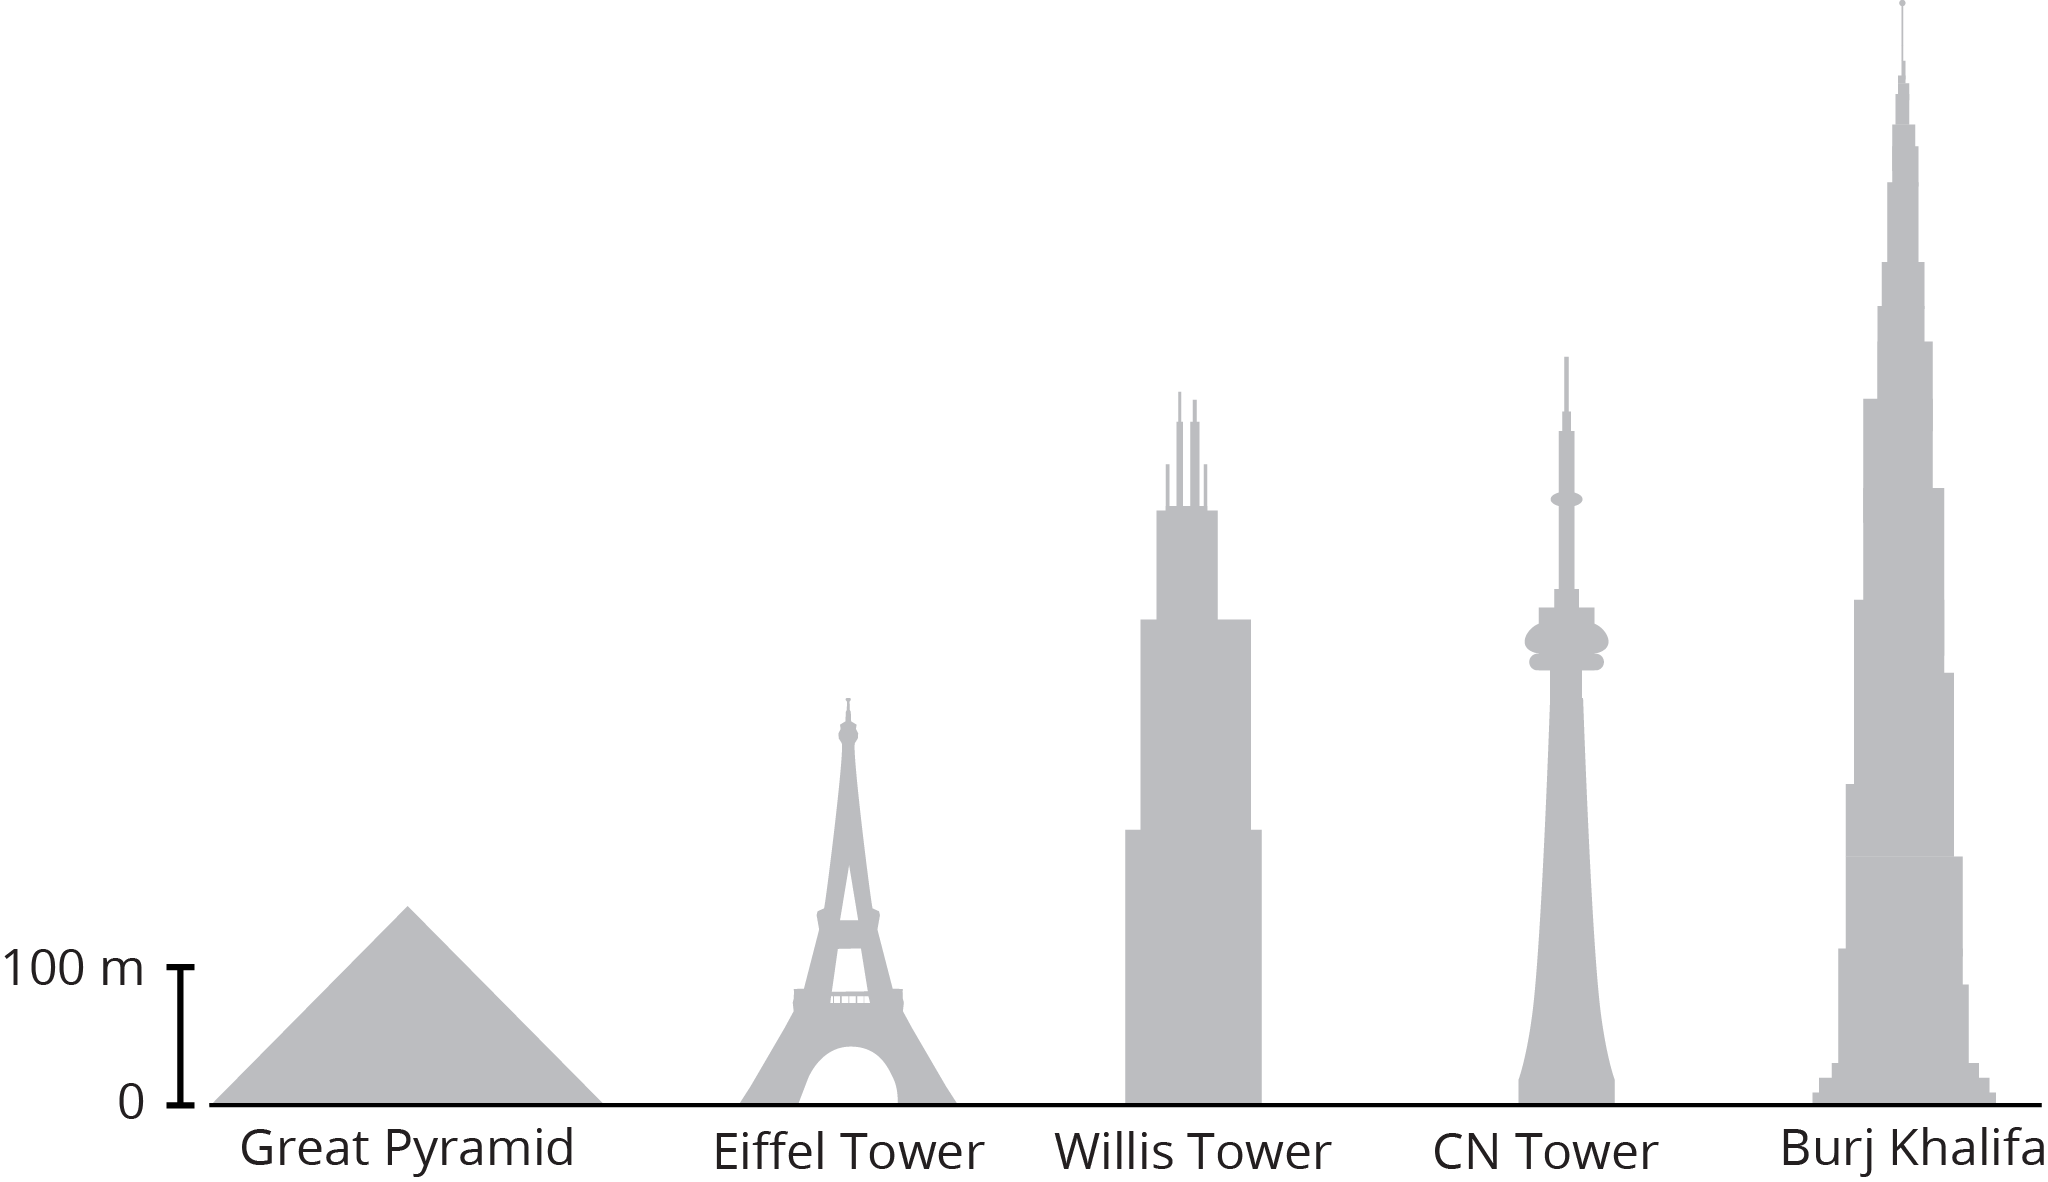
- About how tall is the actual Willis Tower? About how tall is the actual Great Pyramid? Be prepared to explain your reasoning.
- About how much taller is the Burj Khalifa than the Eiffel Tower? Explain or show your reasoning.
- Measure the line segment that shows the scale to the nearest tenth of a centimeter. Express the scale of the drawing using numbers and words.
Student Response
For access, consult one of our IM Certified Partners.
Student Facing
Are you ready for more?
The tallest mountain in the United States, Mount Denali in Alaska, is about 6,190 m tall. If this mountain were shown on the scale drawing, how would its height compare to the heights of the structures? Explain or show your reasoning.
Student Response
For access, consult one of our IM Certified Partners.
Anticipated Misconceptions
Students may not measure heights of the buildings at a right angle from the ground line. Remind students that heights are to be measured perpendicular to the ground or base line.
If needed, demonstrate how to use the edge of a sheet of paper or an index card to measure lengths on a scale drawing with a graphic scale.
Activity Synthesis
Poll the class for their answers to the first question. Ask what might be some sources of discrepancies. The main issue here is measurement error, but there are also different methods to make the measurements and estimate the heights of the buildings. Two methods to estimate the heights of the buildings (and their limitations) are:
- Estimate how many times “taller” each building is compared to the line segment giving the scale. Then multiply this number by 100 m. The accuracy here is not very good unless, for example, the height of the building is very close to being a whole number times the length of the scale.
- Measure the segment giving the scale (in centimeters, for example), and then express the scale using centimeters (for example, 0.7 cm represents 100 m). Then measure each building and use the scale to find the actual height. Estimating and rounding will be necessary when measuring the scale and when measuring the buildings.
Ask previously selected and sequenced students to highlight the different approaches for comparing the heights of the Burj Khalifa and the Eiffel Tower. The main difference between the two strategies is the order of arithmetic. Taking the difference of the actual building heights means multiplying scaled heights first and then subtracting. Taking the difference of the scaled heights and then applying the scale factor means subtracting scaled heights first and then multiplying by the scale factor.
If time permits, discuss the scale drawing of the towers more broadly. Consider asking:
- Besides height information, what other information about the towers does the drawing show? (Widths of the buildings and their overall shapes.)
- What information does it not show? (The depth of each building, any projections or protrusions, shapes of different parts of the buildings, etc.)
- How is this scale drawing the same as that of the basketball court? (They both show information on a single plane and are drawn using a scale.) How are they different? (The basketball court is a flat surface, like the drawing of the court. The drawing of the towers is a side view or front view; the actual objects represented are not actually flat objects.)
Design Principle(s): Support sense-making
Lesson Synthesis
Lesson Synthesis
- What is a scale drawing?
- How can we describe the scale for a scale drawing?
- How do we find distances using a scale drawing?
A scale drawing is a scaled representation of an object. The scale tells us how lengths on the drawing relate to lengths on the actual object. For example, in the basketball court activity, we saw that 1 centimeter on the drawing represented 2 meters of actual distance on the actual court.
If we have a scale drawing, we can use the scale to find lengths on the actual object. For example, if a line segment in the scale drawing of the basketball court is 5 cm, then it represents a 10 m line segment on a real court, because \(2 \boldcdot 5=10\). It is important to remember that a scale drawing shows scaled measurements in only two dimensions, i.e., measurements of a particular surface of an object and those that have been projected onto a particular plane. For example, the drawing of the basketball court did not show the height of the basketball hoops.
7.4: Cool-down - Length of a Bus and Width of a Lake (5 minutes)
Cool-Down
For access, consult one of our IM Certified Partners.
Student Lesson Summary
Student Facing
Scale drawings are two-dimensional representations of actual objects or places. Floor plans and maps are some examples of scale drawings. On a scale drawing:
- Every part corresponds to something in the actual object.
- Lengths on the drawing are enlarged or reduced by the same scale factor.
- A scale tells us how actual measurements are represented on the drawing. For example, if a map has a scale of “1 inch to 5 miles” then a \(\frac12\)-inch line segment on that map would represent an actual distance of 2.5 miles
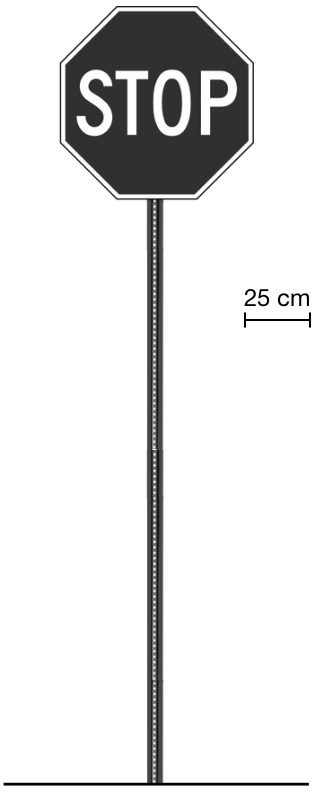
Sometimes the scale is shown as a segment on the drawing itself. For example, here is a scale drawing of a stop sign with a line segment that represents 25 cm of actual length.
The width of the octagon in the drawing is about three times the length of this segment, so the actual width of the sign is about \(3 \boldcdot 25\), or 75 cm.
Because a scale drawing is two-dimensional, some aspects of the three-dimensional object are not represented. For example, this scale drawing does not show the thickness of the stop sign.
A scale drawing may not show every detail of the actual object; however, the features that are shown correspond to the actual object and follow the specified scale.