Lesson 10
Changing Scales in Scale Drawings
10.1: Appropriate Measurements (5 minutes)
Warm-up
This warm-up prompts students to attend to precision in measurements, which will be important in upcoming work.
Launch
Arrange students in groups of 2. Give students 1 minute of quiet think time to estimate the size of their own foot in centimeters or inches, and a moment to share their estimate with a partner. Then, ask them to complete the task.
Student Facing
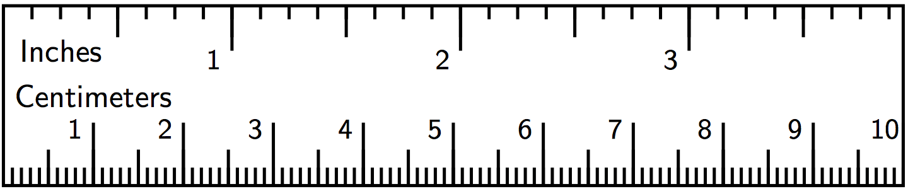
- If a student uses a ruler like this to measure the length of their foot, which choices would be appropriate measurements? Select all that apply. Be prepared to explain your reasoning.
-
\(9\frac14\) inches
-
\(9\frac{5}{64}\) inches
-
23.47659 centimeters
-
23.5 centimeters
-
23.48 centimeters
-
-
Here is a scale drawing of an average seventh-grade student's foot next to a scale drawing of a foot belonging to the person with the largest feet in the world. Estimate the length of the larger foot.

Student Response
For access, consult one of our IM Certified Partners.
Anticipated Misconceptions
Some students may say the large foot is about \(3\frac12\) inches or about 9 centimeters long, because they assume the ruler shown in the first question is at the same scale as the feet shown in the second question. Explain that the images are drawn at different scales.
Activity Synthesis
Select a few students to share the measurements they think would be appropriate based on the given ruler. Consider displaying the picture of the ruler for all to see and recording students' responses on it. After each response, poll the class on whether they agree or disagree.
If students consider B, C, or E to be an appropriate measurement, ask them to share how to get such a level of precision on the ruler. Make sure students understand that reporting measurements to the nearest \(\frac{1}{64}\) of an inch or to the hundred-thousandths of a centimeter would not be appropriate (i.e., show that the ruler does not allow for these levels of precision).
Choice E of 23.48 cm may merit specific attention. With the ruler, it is possible to guess that the hundredths place is an 8. This may even be correct. The problem with reporting the measurement in this way is that someone who sees this might misinterpret it and imagine that an extremely accurate measuring device was used to measure the foot, rather than this ruler. The way a measurement is reported reflects how the measurement was taken.
Next, invite students to share their estimates for the length of the large foot. Since it is difficult to measure the length of these feet very precisely, these measurements should not be reported with a high level of precision; the nearest centimeter would be appropriate.
10.2: Same Plot, Different Drawings (15 minutes)
Activity
This activity serves several purposes: to allow students to practice creating scale drawings at given scales, to draw attention to the size of the scale drawing as one of the values in the scale changes, and to explore more fully the relationship between scaled area and actual area.
Each group member uses a different scale to calculate scaled lengths of the same plot of land, draw a scale drawing, and calculate its scaled area. The group then orders the different drawings and analyzes them. They think about how many square meters of actual area are represented by one square centimeter on each drawing. Students are likely to determine this value in two ways:
- By visualizing what a \(1 \times 1\) centimeter square represents at a given scale (e.g., at a scale of 1 cm to 5 m, each 1 cm2 represents \(5 \boldcdot 5\), or 25 m2).
- By dividing the actual area represented by the scale drawing by the area of their scale drawing
The relationships between scale, lengths in scale drawings, and area in scale drawings are all important examples of the mathematical structure (MP7) of scale drawings.
You will need the Same Plot, Different Drawings blackline master for this activity.
Launch
Display this map of a neighborhood in Philadelphia for all to see. Tell students that they are going to reproduce a map of the triangular piece of land at a different scale.
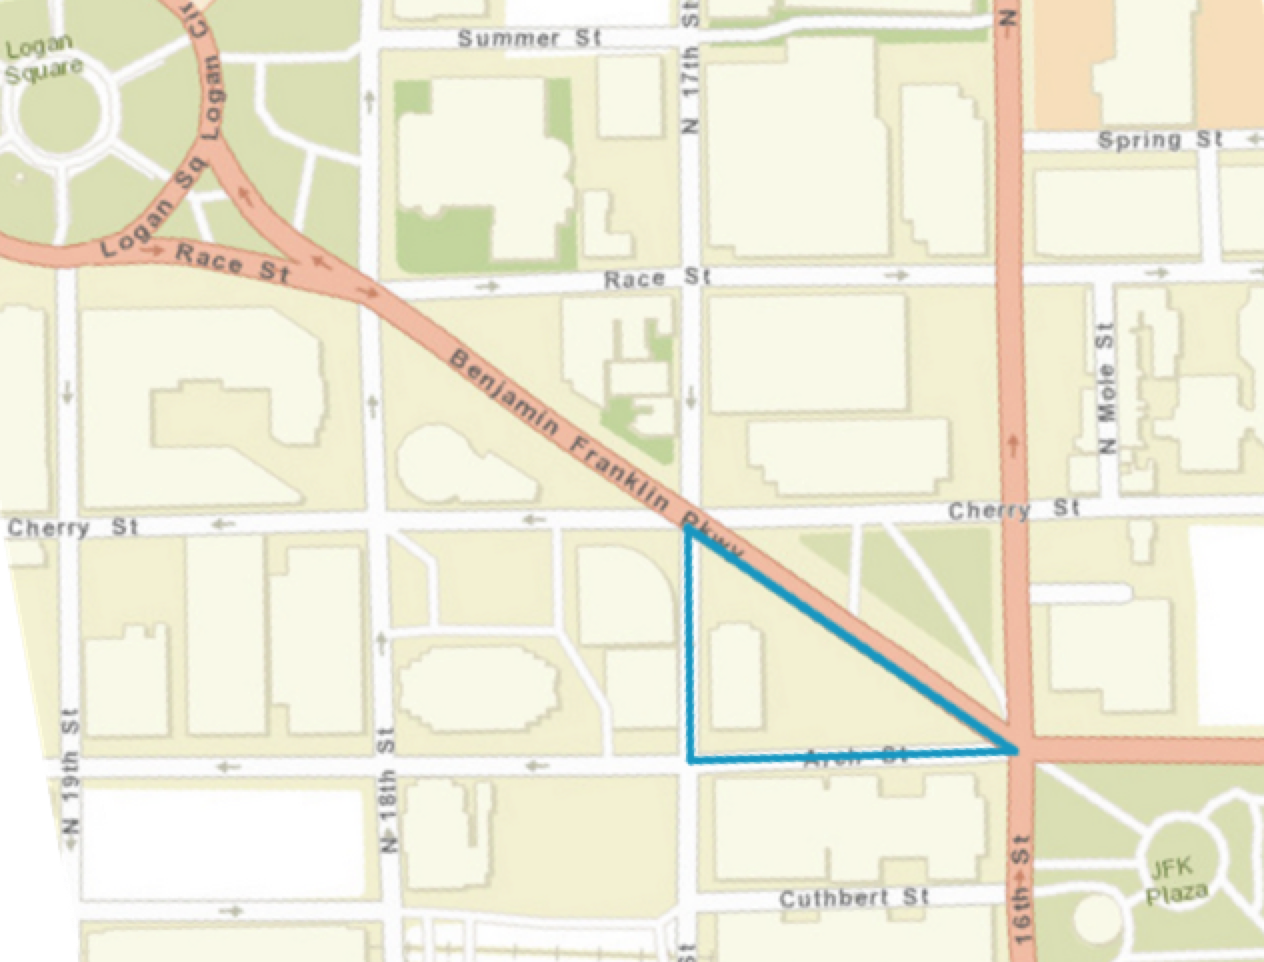
Tell students that the actual base of the triangle is 120 m and its actual height is 90 m. Ask, “What is the area of the plot of land?” (5400 square meters—one half the base times the height of the triangle.)
Arrange students in groups of 5–6 and provide access to centimeter graph paper. Assign each student in a group a different scale (from the blackline master) to use to create a scale drawing. Give students 3–4 minutes of quiet work time to answer the first 3 questions, and then 1–2 minutes to work on the last question in their groups.
Remind students to include the units in their measurements.
Supports accessibility for: Memory; Conceptual processing
Student Facing
Here is a map showing a plot of land in the shape of a right triangle.
- Your teacher will assign you a scale to use. On centimeter graph paper, make a scale drawing of the plot of land. Make sure to write your scale on your drawing.
- What is the area of the triangle you drew? Explain or show your reasoning.
- How many square meters are represented by 1 square centimeter in your drawing?
- After everyone in your group is finished, order the scale drawings from largest to smallest. What do you notice about the scales when your drawings are placed in this order?
Student Response
For access, consult one of our IM Certified Partners.
Student Facing
Are you ready for more?
Noah and Elena each make a scale drawing of the same triangular plot of land, using the following scales. Make a prediction about the size of each drawing. How would they compare to the scale drawings made by your group?
-
Noah uses the scale 1 cm to 200 m.
-
Elena uses the scale 2 cm to 25 m.
Student Response
For access, consult one of our IM Certified Partners.
Activity Synthesis
Focus the discussion on patterns or features students noticed in the different scale drawings. Ask questions such as:
- How does a change in the scale influence the size of the drawings?
(As the length being represented by 1 cm gets larger, the size of the drawing decreases.) - How do the lengths of the scale drawing where 1 cm represents 5 meters compare to the lengths of the drawing where 1 cm represents 15 meters? (They are three times as long.)
- How do the lengths of the scale drawing where 1 cm represents 5 meters compare to the lengths of the drawing where 1 cm represents 50 meters? (They are ten times as long.)
- How does the area of the scale drawing where 1 cm represents 5 meters compare to the area of the drawing where 1 cm represents 15 meters? (It is 9 times as great.)
- How does the area of the scale drawing where 1 cm represents 5 meters compare to the area of the drawing where 1 cm represents 50 meters? (It is 100 times as great.)
Help students to observe and formulate these patterns:
- As the number of meters represented by one centimeter increases, the lengths in the scale drawing decrease.
- As the number of meters represented by one centimeter increases, the area of the scale drawing also decreases, but it decreases by the square of the factor for the lengths (because finding the area means multiplying the length and width, both of which decrease by the same factor).
Conversing, Reading: Math Language Routine 2 Collect and Display. This is the first time Math Language Routine 2 is suggested as a support in this course. In this routine, the teacher circulates and listens to student talk while jotting down words, phrases, drawings, or writing students use. The language collected is displayed visually for the whole class to use throughout the lesson and unit. Generally, the display contains different examples of students using features of the disciplinary language functions, such as interpreting, justifying, or comparing. The purpose of this routine is to capture a variety of students’ words and phrases in a display that students can refer to, build on, or make connections with during future discussions, and to increase students’ awareness of language used in mathematics conversations.
Design Principle(s): Support sense-making; Maximize meta-awareness
How It Happens:
-
As students share their ideas in their groups about what they notice in the scale drawings, write down the language they use to describe how the scale affects the size of the scale drawing. Listen for the language students use to compare the lengths and areas of scale drawings with different scales.
To support the discussion, provide these sentence frames: “As the value of the scale increases, the size of the drawing ___ because ___.”, “When I compare the lengths of (choose two scale drawings), I notice that ___.”, and “When I compare the areas of (choose two scale drawings), I notice that ___.”
-
As groups close their conversation, display the language collected for all to reference.
-
Next, facilitate a whole-class discussion encouraging students to ask and respond to clarifying questions about the meaning of a word or phrase on the display.
To prompt discussion, ask students, “What word or phrase is unclear? From the language I collected, what part does not make sense to you?”
Here is an example:
Student A: The phrase ‘the triangle is 9 times greater’ is unclear to me. I’m not sure what 9 times greater means.
Teacher: [Point to the phrase on the display] Can someone clarify this phrase with specific details?
Student B: The area of the triangle with a 1 cm to 5 m scale is 9 times greater than the area of the triangle with a 1 cm to 15 m scale.
Teacher: (pressing for more detail) Why is it 9 times greater? Can someone different explain or illustrate what 9 times greater means in this case?
Student C: [Student adds a sketch of both triangles to the display next to the phrase; teacher adds labels/arrows/calculations to the sketch while Student C explains] It’s 9 times greater because 15 m divided by 5 m is 3, and since we’re talking about area, you then calculate 3 times 3 to give you 9.
-
As time permits, continue this discussion until all questions have been addressed. If it did not arise through student-led questions and responses, help students generalize that as the number of meters represented by one centimeter increases, the lengths and areas of the scale drawing decreases.
If students are having difficulty, consider using multiple examples from the activity to build up to the generalization. You may say, “Let’s look at the case where we are comparing….” or “Can someone demonstrate the steps they took to compare…?”
-
Close this conversation by posting the display in the front of the classroom for students to reference for the remainder of the lesson, and then have students move on to the next activity.
10.3: A New Drawing of the Playground (15 minutes)
Activity
Earlier, students created scale drawings given the actual dimensions and different scales. In this activity, instead of being given the actual dimensions, they are given a scale drawing to reproduce at a different scale.
There are two different types of reasoning students may apply. Monitor for students who:
- Use the scale drawing to find the dimensions of the actual school playground and then use those measurements to find the dimensions of the new scale drawing.
- Notice that in the given drawing, 1 centimeter represents 30 m, and in the new drawing, 1 centimeter represents 20 m. That means that each centimeter in the new drawing represents \(\frac{2}{3}\) centimeters in the given one. So in the new drawing, the length of each side needs to be multiplied by a factor of \(\frac{3}{2}\).
Select students using each strategy to share during the discussion, sequenced in this order.
Launch
Tell students that they are going to reproduce a scale drawing using a different scale. The scale for the given drawing is 1 cm to 30 meters, and they are going to make a new scale drawing at a scale of 1 cm to 20 meters. Ask them if they think the new drawing will be larger or smaller than the given one.
Arrange students in groups of 3. Make sure students have access to their geometry toolkits. Give students 5 minutes of quiet work time, followed by 3 minutes of group discussion.
Student Facing
Here is a scale drawing of a playground.
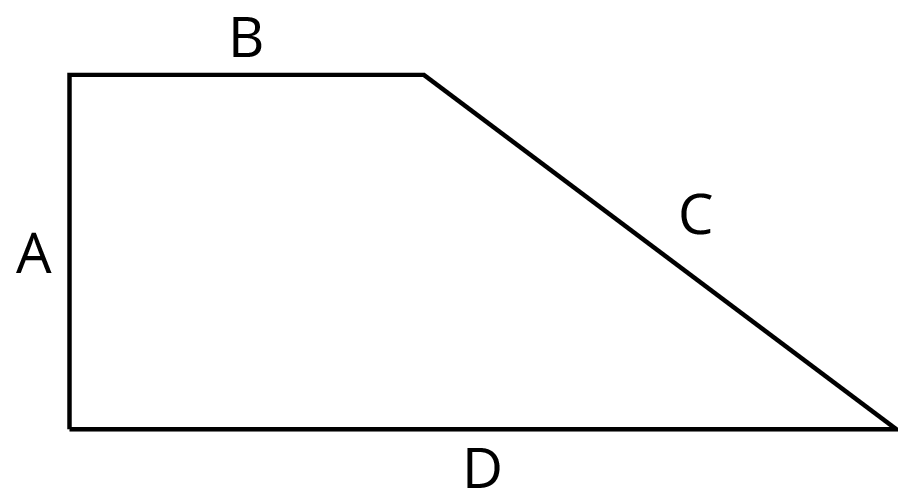
The scale is 1 centimeter to 30 meters.
- Make another scale drawing of the same playground at a scale of 1 centimeter to 20 meters.
- How do the two scale drawings compare?
Student Response
For access, consult one of our IM Certified Partners.
Anticipated Misconceptions
Some students may not know how to begin the task. Prompt them to start by calculating the actual length of each side of the playground.
Activity Synthesis
Invite selected students to share their work producing the new scale drawing. Ask students how the two scale drawings compare. Make sure that they recognize the shapes are the same (both represent the same playground) but the sizes are different.
Ask students if their prediction about which scale drawing would be larger was correct. Ask them to explain why the drawing at a scale of 1 cm to 20 m is larger than the drawing at a scale of 1 cm to 30 m. The important idea here is that when 1 cm on the scale drawing represents a greater distance, it takes fewer of those centimeters to describe the object. So the scale drawing at a scale of 1 cm to 30 m is smaller than the scale drawing at a scale of 1 cm to 20 m. Consider doing a demonstration in which you zoom in on a map with the scale showing.
To encourage students to think about the areas of the scale drawings like they did in the previous activity, consider asking questions like the following:
- “On the original map with the scale of 1 cm to 30 m, how much area does one square centimeter represent?” (900 cm2)
- “On the new map with the scale of 1 cm to 20 m, how much area does one square centimeter represent?” (400 cm2)
- “How many times as large as the original map is the new map?” (1.5 times for side lengths; \(1.5 \boldcdot 1.5\), or 2.25, times for area)
Design Principle(s): Support sense-making
Lesson Synthesis
Lesson Synthesis
Sometimes we have a scale drawing and want to reproduce it at a different scale. Two common approaches are:
- Using the original scale drawing to calculate the actual lengths and then using the actual lengths and the new scale to calculate the corresponding lengths on the new drawing.
- Scaling lengths in the original scale drawing by a factor that relates the scales of the two drawings.
Suppose you have a map that uses the scale 1 cm to 200 m. You draw a new map of the same place using the scale 1 cm to 20 m.
- How does your new map compare to your original map? (The lengths are 10 times as long and the area is 100 times as large.)
- How much actual area does 1 cm2 on your new map represent? (400 m2)
- How much actual area did 1 cm2 on your original map represent? (40,000 m2)
10.4: Cool-down - Window Frame (5 minutes)
Cool-Down
For access, consult one of our IM Certified Partners.
Student Lesson Summary
Student Facing
Sometimes we have a scale drawing of something, and we want to create another scale drawing of it that uses a different scale. We can use the original scale drawing to find the size of the actual object. Then we can use the size of the actual object to figure out the size of our new scale drawing.
For example, here is a scale drawing of a park where the scale is 1 cm to 90 m.

The rectangle is 10 cm by 4 cm, so the actual dimensions of the park are 900 m by 360 m, because \(10 \boldcdot 90 = 900\) and \(4 \boldcdot 90 = 360\).
Suppose we want to make another scale drawing of the park where the scale is 1 cm to 30 meters. This new scale drawing should be 30 cm by 12 cm, because \(900 \div 30 = 30\) and \(360 \div 30 = 12\).
Another way to find this answer is to think about how the two different scales are related to each other. In the first scale drawing, 1 cm represented 90 m. In the new drawing, we would need 3 cm to represent 90 m. That means each length in the new scale drawing should be 3 times as long as it was in the original drawing. The new scale drawing should be 30 cm by 12 cm, because \(3 \boldcdot 10 = 30\) and \(3 \boldcdot 4 = 12\).
Since the length and width are 3 times as long, the area of the new scale drawing will be 9 times as large as the area of the original scale drawing, because \(3^2=9\).