Lesson 12
Units in Scale Drawings
12.1: Centimeters in a Mile (5 minutes)
Warm-up
The goal of this warm-up is to review expressions in the context of conversions. This lesson will examine in depth equivalent scales, that is, scales that lead to the same size scale drawing. Checking whether or not two scales are equivalent often involves converting quantities to common units.
Student Facing
There are 2.54 cm in an inch, 12 inches in a foot, and 5,280 feet in a mile. Which expression gives the number of centimeters in a mile? Explain your reasoning.
- \(\frac{2.54}{12 \boldcdot 5,280}\)
- \(5,\!280 \boldcdot 12 \boldcdot (2.54)\)
- \(\frac{1}{5,280 \boldcdot 12 \boldcdot (2.54)}\)
- \(5,\!280 + 12 + 2.54\)
- \(\frac{5,280 \boldcdot 12}{2.54}\)
Student Response
For access, consult one of our IM Certified Partners.
Activity Synthesis
Ask one or more students to explain their reasoning for the correct choice \(5,\!280 \boldcdot 12 \boldcdot (2.54)\). There are 2.54 centimeters in an inch and 12 inches in a foot, so that means there are \(12 \boldcdot (2.54)\) centimeters in a foot. Then there are 5,280 feet in a mile, so that makes \(5,\!280 \boldcdot 12 \boldcdot (2.54)\) centimeters in a mile. Students can also use common sense about measurements. A centimeter is a small unit of measure while a mile is quite large, so there have to be many centimeters in a mile.
Make sure to ask students what option C, \(\frac{1}{2.54 \boldcdot 12 \boldcdot 5,280}\), represents in this setting. (The scale factor to convert from miles to centimeters.)
12.2: Card Sort: Scales (15 minutes)
Optional activity
The purpose of this activity is to give students more practice identifying equivalent scales, including some expressed without units and some with units. Students work with their group to sort slips into groups of equivalent scales and explain their reasoning. A key insight to uncover here is that when comparing scales, it can be helpful to convert them into equivalent scales in a particular format (e.g., without units, or using the same units).
You will need the Scales Card Sort blackline master for this activity.
Launch
Demonstrate how to set up and do the matching activity. Choose a student to be your partner. Mix up the rest of the cards and place them face up. Select two cards and then explain to your partner why you think the cards do or do not match. Demonstrate productive ways to agree or disagree (e.g., by explaining your mathematical thinking, asking clarifying questions, etc.).
Arrange students in groups of 4. If desired, arrange students in groups of 4–6 in two dimensions. (Assign each student into a group and then to a label within it, so that new groups—consisting one student from each of the original groups—can be formed later).
Give students 5–6 minutes to sort the slips, and another 2–3 minutes to check another group's work, followed by whole-class discussion.
Supports accessibility for: Conceptual processing; Organization
Design Principle(s): Support sense-making; Maximize meta-awareness
Student Facing
Your teacher will give you some cards with a scale on each card.
-
Sort the cards into sets of equivalent scales. Be prepared to explain how you know that the scales in each set are equivalent. Each set should have at least two cards.
-
Trade places with another group and check each other’s work. If you disagree about how the scales should be sorted, work to reach an agreement.
Pause here so your teacher can review your work. -
Next, record one of the sets with three equivalent scales and explain why they are equivalent.
Student Response
For access, consult one of our IM Certified Partners.
Anticipated Misconceptions
If groups have trouble getting started, encourage them to think about different ways to express a scale, both with units and without units.
Students may sort the cards by the types (metric or customary; with units or without units) rather than by common scale factors. Remind students that scales that are equivalent have the same factor relating its scaled lengths to actual lengths.
Students may think that scales in metric units and those in customary units cannot be equivalent. For example, they may think that “1 inch to 1,000 inches” belongs in one group and “1 cm to 10 m” belongs in another. If this misconception arises and is not resolved in group discussions, address it during the activity synthesis.
Activity Synthesis
Much of the discussion will happen in and between small groups, so a whole-class debrief may only be necessary to tie any loose ends. Invite a few students to share how their group reasoned about a couple of the scales (e.g., \(\frac12\) cm to 500 m, 1 mm to 1 m).
Address any questions that arose during sorting, common misconceptions, or unsettled disagreements between groups. For example, students may still be unclear about whether scales in customary and metric units can be equivalent. (i.e., Can “1 inch to 1,000 inches” and “1 centimeter to 10 meters” both go in the same group? Why or why not?) Help students see that as long as the two scales represent the same scale factor, they are equivalent and will produce the same scale drawing.
If time permits, consider asking students to order their groups of equivalent scales, starting with the ones that would produce the smallest drawing of the same actual thing to the ones that would produce the largest drawing. Invite students to explain their reasoning.
12.3: The World’s Largest Flag (15 minutes)
Activity
In this activity, students use a scale without units to find actual and scaled distances that involve a wider range of numbers, from 0.02 to 2,000. They also return to thinking about how the area of a scale drawing relates to the area of the actual thing.
Students are likely to find scaled lengths in one of two ways: 1) by first converting the measurement in meters to centimeters and then dividing by 2,000; or 2) by dividing the measurement by 2,000 and then converting the result to centimeters. To find actual lengths, the same paths are likely, except that students will multiply by 2,000 and reverse the unit conversion. Identify students who use different approaches so they can share later.
Launch
Have students close their books or devices. Display an image of Tunisia’s flag. Explain that Tunisia holds the world record for the largest version of a country flag. The record-breaking flag is nearly four soccer fields in length. Solicit from students a few guesses for a scale that would be appropriate to create a scale drawing of the flag on a sheet of paper. If asked, provide the length of the flag (396 m) and the size of the paper (letter size: \(8\frac12\) inches by 11 inches, or about 21.5 cm by 28 cm).
After hearing some guesses, explain to students that they will now solve problems about the scale and scale drawing of the giant Tunisian flag.
Arrange students in groups of 3–4. Provide access to a metric unit conversion chart. Give students 4–5 minutes of quiet work time, and then another 5 minutes to collaborate and discuss their work in groups.
During work time, assign one sub-problem from the second question for each group to present.
Supports accessibility for: Memory; Conceptual processing
Student Facing
As of 2016, Tunisia holds the world record for the largest version of a national flag. It was almost as long as four soccer fields. The flag has a circle in the center, a crescent moon inside the circle, and a star inside the crescent moon.
- Complete the table. Explain or show your reasoning.
flag length flag height height of
crescent moonactual 396 m 99 m at 1 to 2,000 scale 13.2 cm -
Complete each scale with the value that makes it equivalent to the scale of 1 to 2,000. Explain or show your reasoning.
- 1 cm to ____________ cm
- 1 cm to ____________ m
- 1 cm to ____________ km
- 2 m to _____________ m
- 5 cm to ___________ m
- ____________ cm to 1,000 m
- ____________ mm to 20 m
-
- What is the area of the large flag?
- What is the area of the smaller flag?
- The area of the large flag is how many times the area of the smaller flag?
Student Response
For access, consult one of our IM Certified Partners.
Anticipated Misconceptions
Students may be confused about whether to multiply or divide by 2,000 (or to multiply by 2,000 or by \(\frac {1}{2,000}\)) when finding the missing lengths. Encourage students to articulate what a scale of 1 to 2,000 means, or remind them that it is a shorthand for saying “1 unit on a scale drawing represents 2,000 of the same units in the object it represents.” Ask them to now think about which of the two—actual or scaled lengths—is 2,000 times the other and which is \(\frac{1}{2,000}\) of the other.
For the third question relating the area of the real flag to the scale model, if students are stuck, encourage them to work out the dimensions of each explicitly and to use this to calculate the scale factor between the areas.
Activity Synthesis
Select a few students with differing solution paths to share their responses to the first question. Record and display their reasoning for all to see. Highlight two different ways for dealing with unit conversions. For example, in finding scaled lengths, one can either first convert the actual length in meters to centimeters and then multiply by \(\frac{1}{2,000}\), or multiply by \(\frac{1}{2,000}\) first, and then convert the quotient into centimeters.
Invite previously identified students to display and share their responses for the sub-problems in the second question. After each person shares, solicit questions or comments from the class. Emphasize that all of the scales are equivalent because in each scale, a factor of 2,000 relates scaled distances to actual distances.
Reiterate the fact that a scale does not have to be expressed in terms of 1 scaled unit, as is shown in the last three sub-questions, but that 1 is often chosen because it makes the scale factor easier to see and can make calculations more efficient.
Make sure students understand why the scale factor for the area of the two flags is 4,000,000. (Both the length and the height of the large flag are 2,000 times the length and height of the small flag. So the area of the large flag is \(2,\!000 \boldcdot 2,\!000\) times the area of the small flag. Alternatively, there are 10,000 square centimeters in a square meter, so in square centimeters, the area of the large flag is 1,053,360,000. Dividing this by the area of the small flag in square centimeters, 261.36, also gives 4,000,000.)
12.4: Pondering Pools (10 minutes)
Optional activity
Previously, whenever students were asked to use a scale drawing to calculate the area of an actual region, they were able to find the dimensions of the actual region as an intermediate step. Each time, students were prompted to notice that the actual area was related to the scaled area by the \((\text{scale factor})^2\). Some students may have already become comfortable using this relationship to calculate the actual area directly from the scaled area, without needing to calculate the actual dimensions as an intermediate step.
The purpose of this activity is to help all students internalize this more efficient method. The question about the rectangular pool can be solved either way, but for the question about the kidney-shaped pool, students must rely on the relationship between scaled area and actual area.
As students work, monitor for those who express the scale of the drawing in different but equivalent ways (e.g., 3 cm to 15 m, 1 cm to 5 m, 1 to 500). Also monitor the different ways students find the area of the large rectangular pool:
- By first finding the actual side lengths of the pool in meters and then multiplying them
- By calculating the scaled area in square centimeters and multiplying it by 25 (or \(5^2\))
You will need the Pondering Pools blackline master for this activity.
Launch
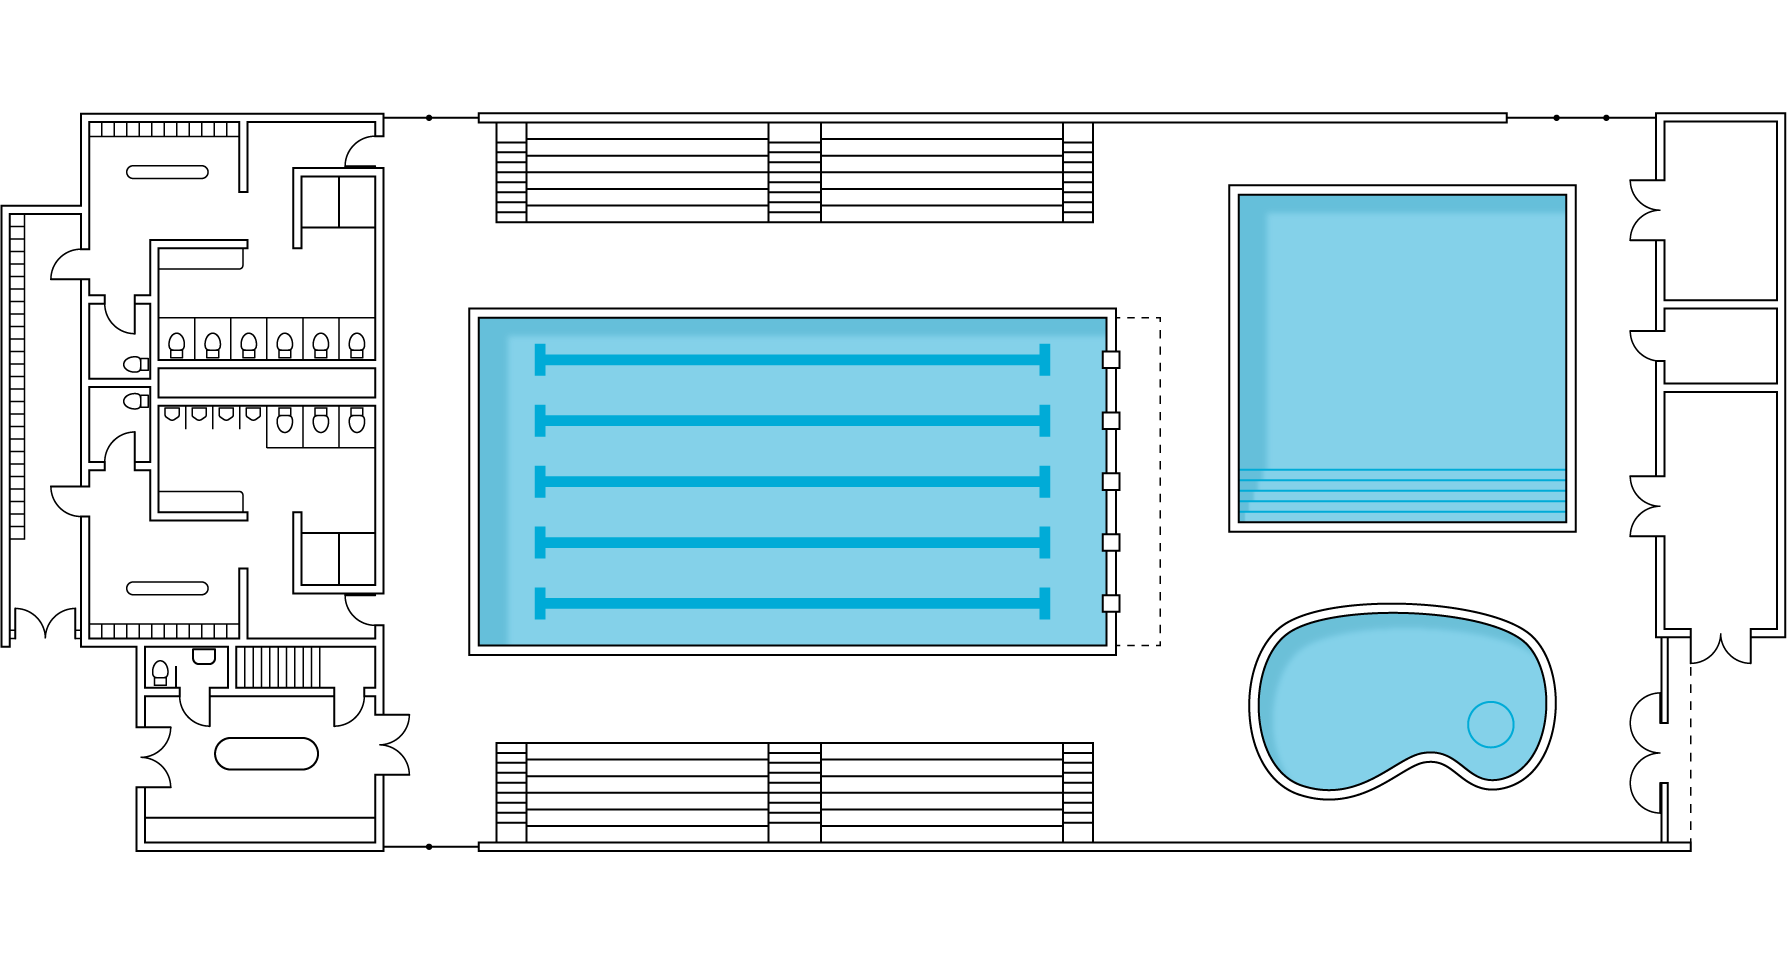
Give each student a copy of the blackline master. Invite students to share what they notice and what they wonder about the floor plan of the aquatic center.
Some things they might notice include:
- There are three different swimming pools on the floor plan.
- This floor plan has more details than others they have worked with previously, such as stairs and doors.
Some things they might wonder include:
- What is the scale of this drawing?
- How deep are these pools?
- Where is this aquatic center located?
- How much does it cost to get to use these pools?
Provide access to centimeter rulers. Give students 4–5 minutes of quiet work time, followed by whole-class discussion.
Representing, Conversing, Writing: Math Language Routine 5: Co-Craft Questions. This is the first time Math Language Routine 5 is suggested as a support in this course. In this routine, students are given a context or situation, often in the form of a problem stem with or without numerical values. Students develop mathematical questions that can be asked about the situation. A typical prompt is: “What mathematical questions could you ask about this situation?" The purpose of this routine is to allow students to make sense of a context before feeling pressure to produce answers, and to develop students’ awareness of the language used in mathematics problems.
Design Principle(s): Cultivate conversation; Support sense-making
How It Happens:
-
Give each student a copy of the floor plan of the aquatic center. Do not allow students to see the follow-up questions for this situation.
Ask students, “What mathematical questions could you ask about this situation?”
-
Give students 1 minute of individual time to jot some notes, and then 3 minutes to share ideas with a partner.
As pairs discuss, support students in using conversation skills to generate and refine their questions collaboratively by seeking clarity, referring to students’ written notes, and revoicing oral responses as necessary. Listen for how students refer to the scale of the drawing and talk about area in their discussion.
-
Ask each pair of students to contribute one written question to a poster, the whiteboard, or digital projection. Call on 2–3 pairs of students to present their question to the whole class, and invite the class to make comparisons among the questions shared and their own questions.
Listen for questions intended to ask about the scale of the floor plan and the areas of the pools, and take note of those that use units and those that do not use units. Revoice student ideas with an emphasis on different but equivalent scales, as well as various methods for finding the areas of the pools, wherever it serves to clarify a question.
-
Reveal the three follow-up questions for this situation and give students a couple of minutes to compare them to their own and to those of their classmates. Identify similarities and differences.
Consider providing these prompts: “Which of your questions is most similar to/different than the ones provided? Why?”, “Is there a main mathematical concept that is present in both your questions and those provided? If so, describe it.”, and “How do your questions relate to one of the lesson goals of comprehending equivalent scales?”
-
Invite students to choose one question to answer (from the class or from the curriculum), and then have students move on to the following problems.
Student Facing
Your teacher will give you a floor plan of a recreation center.
- What is the scale of the floor plan if the actual side length of the square pool is 15 m? Express your answer both as a scale with units and without units.
- Find the actual area of the large rectangular pool. Show your reasoning.
- The kidney-shaped pool has an area of 3.2 cm2 on the drawing. What is its actual area? Explain or show your reasoning.
Student Response
For access, consult one of our IM Certified Partners.
Student Facing
Are you ready for more?
- Square A is a scaled copy of Square B with scale factor 2. If the area of Square A is 10 units2, what is the area of Square B?
- Cube A is a scaled copy of Cube B with scale factor 2. If the volume of Cube A is 10 units3, what is the volume of Cube B?
- The four-dimensional Hypercube A is a scaled copy of Hypercube B with scale factor 2. If the “volume” of Hypercube A is 10 units4, what do you think the “volume” of Hypercube B is?
Student Response
For access, consult one of our IM Certified Partners.
Anticipated Misconceptions
Students may multiply the scaled area by 5 instead of by \(5^2\). Remind them to consider what 1 square centimeter represents, rather than what 1 centimeter represents.
Students may think that the last question cannot be answered because not enough information is given. Encourage them to revisit their previous work regarding how scaled area relates to actual area.
Activity Synthesis
The goals of this discussion are to reinforce that there is more than one way to express the scale of a scale drawing and to see that, for a given problem, one way of expressing the scale may be more helpful than another.
First, invite students to share the scales they wrote for the first question. Record the answers for all to see. For each answer, poll the class on whether they agree that the scale is equivalent.
Next, ask selected students to share how they solved the questions about the area of the pools. Discuss:
- Were any of these scales easier to use when finding the actual area? Were any more difficult? Which ones?
- What might be some benefits of using one method over another for finding the actual area?
Lesson Synthesis
Lesson Synthesis
Scales can be expressed in many different ways, including using different units or not using any units.
- How can we express the scale 1 inch to 5 miles without units? (Since there are 12 inches in a foot and 5,280 feet in a mile, this is the same as 1 inch to 63,360 inches, or 1 to 63,360.)
A scale tells us how a distance on a scale drawing corresponds to an actual distance, and it can also tell us how an area on a drawing corresponds to an actual area.
If a map uses the scale 1 inch to 5 miles:
- How can we find the actual area of a region represented on the map? (Find the area on the map in square inches and multiply by 25, because 1 square inch represents 25 square miles.)
- How can we find a region's scaled area if we know its actual area? (Multiply the area of the actual region by \(\frac{1}{25}\).)
12.5: Cool-down - Drawing the Backyard (5 minutes)
Cool-Down
For access, consult one of our IM Certified Partners.
Student Lesson Summary
Student Facing
Sometimes scales come with units, and sometimes they don’t. For example, a map of Nebraska may have a scale of 1 mm to 1 km. This means that each millimeter of distance on the map represents 1 kilometer of distance in Nebraska. Notice that there are 1,000 millimeters in 1 meter and 1,000 meters in 1 kilometer. This means there are \(1,\!000 \boldcdot 1,\!000\) or 1,000,000 millimeters in 1 kilometer. So, the same scale without units is 1 to 1,000,000, which means that each unit of distance on the map represents 1,000,000 units of distance in Nebraska. This is true for any choice of unit to express the scale of this map.
Sometimes when a scale comes with units, it is useful to rewrite it without units. For example, let's say we have a different map of Rhode Island, and we want to use the two maps to compare the size of Nebraska and Rhode Island. It is important to know if the maps are at the same scale. The scale of the map of Rhode Island is 1 inch to 10 miles. There are 5,280 feet in 1 mile, and 12 inches in 1 foot, so there are 63,360 inches in 1 mile (because \(5,\!280 \boldcdot 12 = 63,\!360\)). Therefore, there are 633,600 inches in 10 miles. The scale of the map of Rhode Island without units is 1 to 633,600. The two maps are not at the same scale, so we should not use these maps to compare the size of Nebraska to the size of Rhode Island.
Here is some information about equal lengths that you may find useful.
Customary Units
1 foot (ft) = 12 inches (in)
1 yard (yd) = 36 inches
1 yard = 3 feet
1 mile = 5,280 feet
Metric Units
1 meter (m) = 1,000 millimeters (mm)
1 meter = 100 centimeters
1 kilometer (km) = 1,000 meters
Equal Lengths in Different Systems
1 inch = 2.54 centimeters
1 foot \(\approx\) 0.30 meter
1 mile \(\approx\) 1.61 kilometers
1 centimeter \(\approx\) 0.39 inch
1 meter \(\approx\) 39.37 inches
1 kilometer \(\approx\) 0.62 mile