Lesson 5
More Graphs of Functions
Let’s interpret graphs of functions.
Problem 1
The solution to a system of equations is \((6,\text-3)\). Choose two equations that might make up the system.
\(y=\text-3x+6\)
\(y=2x-9\)
\(y=\text-5x+27\)
\(y=2x-15\)
\(y=\text-4x+27\)
Problem 2
A car is traveling on a small highway and is either going 55 miles per hour or 35 miles per hour, depending on the speed limits, until it reaches its destination 200 miles away. Letting \(x\) represent the amount of time in hours that the car is going 55 miles per hour, and \(y\) being the time in hours that the car is going 35 miles per hour, an equation describing the relationship is: \(\displaystyle 55x + 35y = 200\)
- If the car spends 2.5 hours going 35 miles per hour on the trip, how long does it spend going 55 miles per hour?
- If the car spends 3 hours going 55 miles per hour on the trip, how long does it spend going 35 miles per hour?
- If the car spends no time going 35 miles per hour, how long would the trip take? Explain your reasoning.
Problem 3
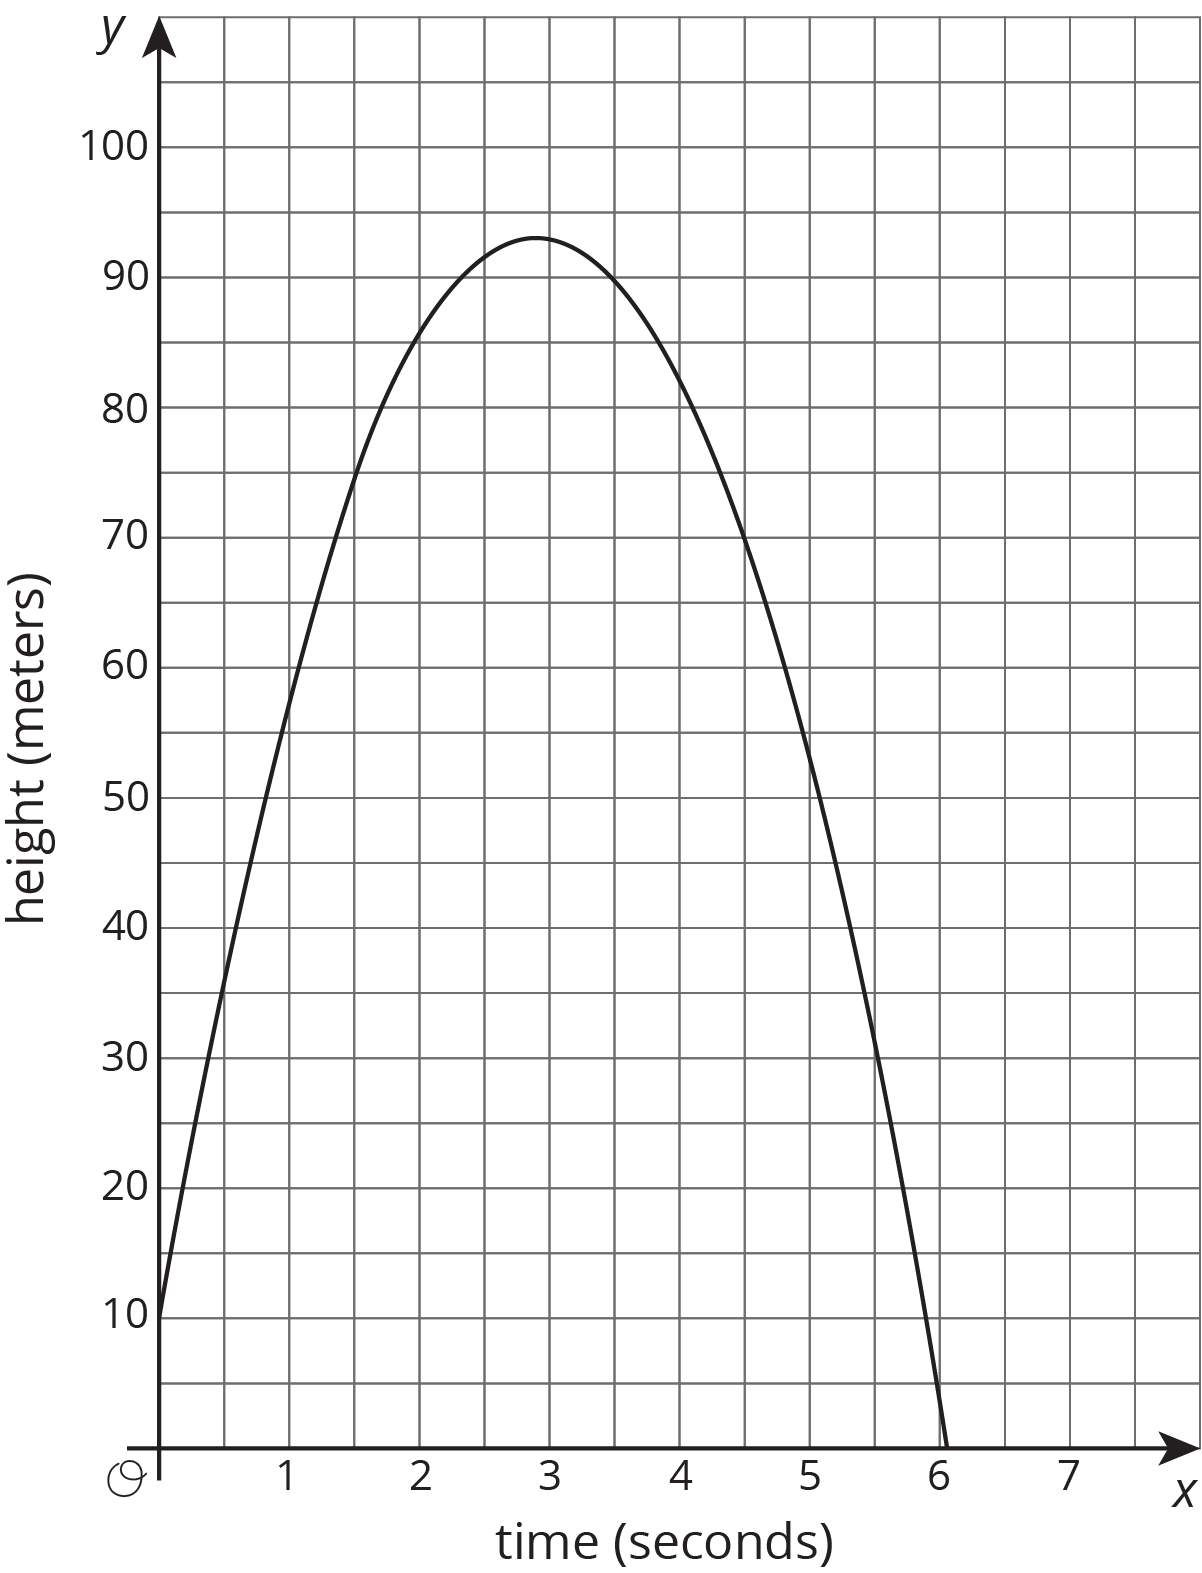
The graph represents an object that is shot upwards from a tower and then falls to the ground. The independent variable is time in seconds and the dependent variable is the object’s height above the ground in meters.

- How tall is the tower from which the object was shot?
- When did the object hit the ground?
- Estimate the greatest height the object reached and the time it took to reach that height. Indicate this situation on the graph.