Lesson 7
Connecting Representations of Functions
Let’s connect tables, equations, graphs, and stories of functions.
7.1: Which are the Same? Which are Different?
Here are three different ways of representing functions. How are they alike? How are they different?
\(\displaystyle y = 2x\)
| \(p\) | -2 | -1 | 0 | 1 | 2 | 3 |
|---|---|---|---|---|---|---|
| \(q\) | 4 | 2 | 0 | -2 | -4 | -6 |
7.2: Comparing Temperatures
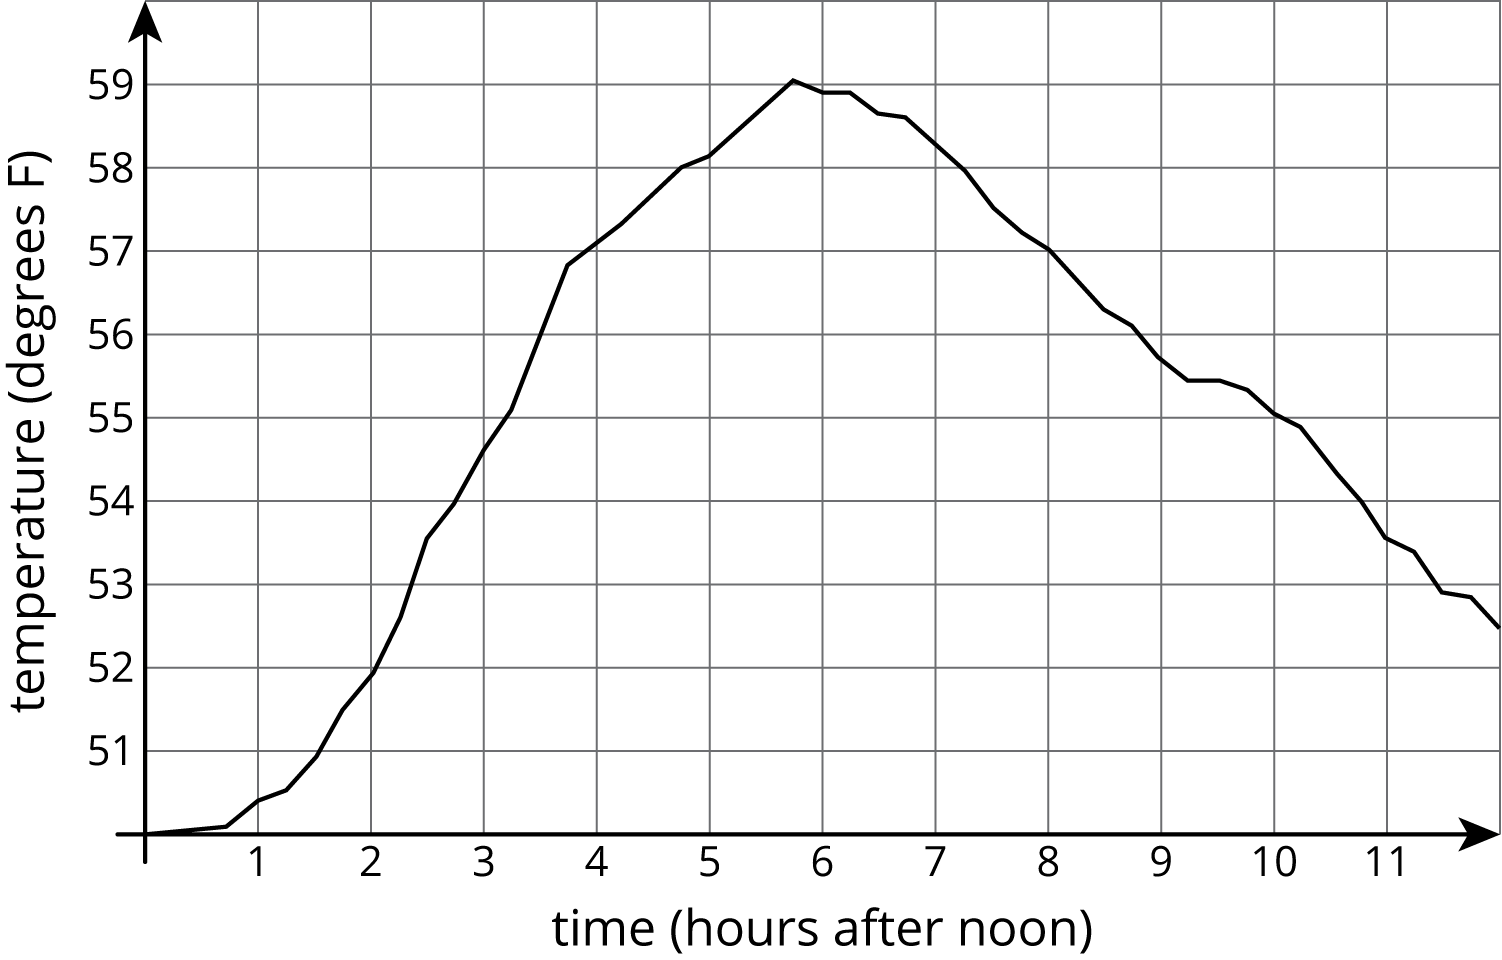
The graph shows the temperature between noon and midnight in City A on a certain day.
The table shows the temperature, \(T\), in degrees Fahrenheit, for \(h\) hours after noon, in City B.
| \(h\) | 1 | 2 | 3 | 4 | 5 | 6 |
|---|---|---|---|---|---|---|
| \(T\) | 82 | 78 | 75 | 62 | 58 | 59 |
- Which city was warmer at 4:00 p.m.?
- Which city had a bigger change in temperature between 1:00 p.m. and 5:00 p.m.?
- How much greater was the highest recorded temperature in City B than the highest recorded temperature in City A during this time?
- Compare the outputs of the functions when the input is 3.
7.3: Comparing Volumes
The volume, \(V\), of a cube with edge length \(s\) cm is given by the equation \(V = s^3\). The volume of a sphere is a function of its radius (in centimeters), and the graph of this relationship is shown here.
-
Is the volume of a cube with edge length \(s=3\) greater or less than the volume of a sphere with radius 3?
-
If a sphere has the same volume as a cube with edge length 5, estimate the radius of the sphere.
-
Compare the outputs of the two volume functions when the inputs are 2.
Here is an applet to use if you choose.
Estimate the edge length of a cube that has the same volume as a sphere with radius 2.5.
7.4: It’s Not a Race
Elena’s family is driving on the freeway at 55 miles per hour.
Andre’s family is driving on the same freeway, but not at a constant speed. The table shows how far Andre's family has traveled, \(d\), in miles, every minute for 10 minutes.
| \(t\) | 1 | 2 | 3 | 4 | 5 | 6 | 7 | 8 | 9 | 10 |
|---|---|---|---|---|---|---|---|---|---|---|
| \(d\) | 0.9 | 1.9 | 3.0 | 4.1 | 5.1 | 6.2 | 6.8 | 7.4 | 8 | 9.1 |
- How many miles per minute is 55 miles per hour?
- Who had traveled farther after 5 minutes? After 10 minutes?
- How long did it take Elena’s family to travel as far as Andre’s family had traveled after 8 minutes?
- For both families, the distance in miles is a function of time in minutes. Compare the outputs of these functions when the input is 3.
Summary
Functions are all about getting outputs from inputs. For each way of representing a function—equation, graph, table, or verbal description—we can determine the output for a given input.
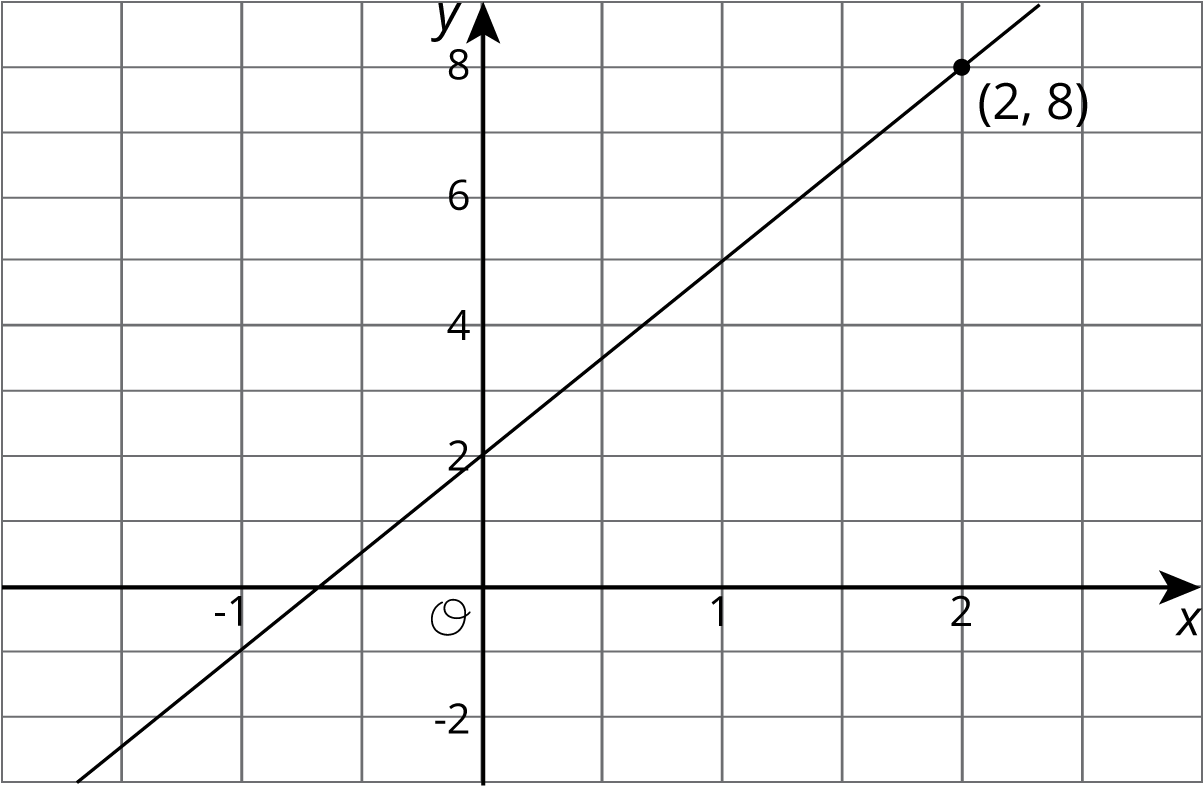
Let's say we have a function represented by the equation \(y = 3x +2\) where \(y\) is the dependent variable and \(x\) is the independent variable. If we wanted to find the output that goes with 2, we can input 2 into the equation for \(x\) and finding the corresponding value of \(y\). In this case, when \(x\) is 2, \(y\) is 8 since \(3\boldcdot 2 + 2=8\).
If we had a graph of this function instead, then the coordinates of points on the graph are the input-output pairs. So we would read the \(y\)-coordinate of the point on the graph that corresponds to a value of 2 for \(x\). Looking at the graph of this function here, we can see the point \((2,8)\) on it, so the output is 8 when the input is 2.
A table representing this function shows the input-output pairs directly (although only for select inputs).
| \(x\) | -1 | 0 | 1 | 2 | 3 |
|---|---|---|---|---|---|
| \(y\) | -1 | 2 | 5 | 8 | 11 |
Again, the table shows that if the input is 2, the output is 8.
Video Summary
Glossary Entries
- dependent variable
A dependent variable represents the output of a function.
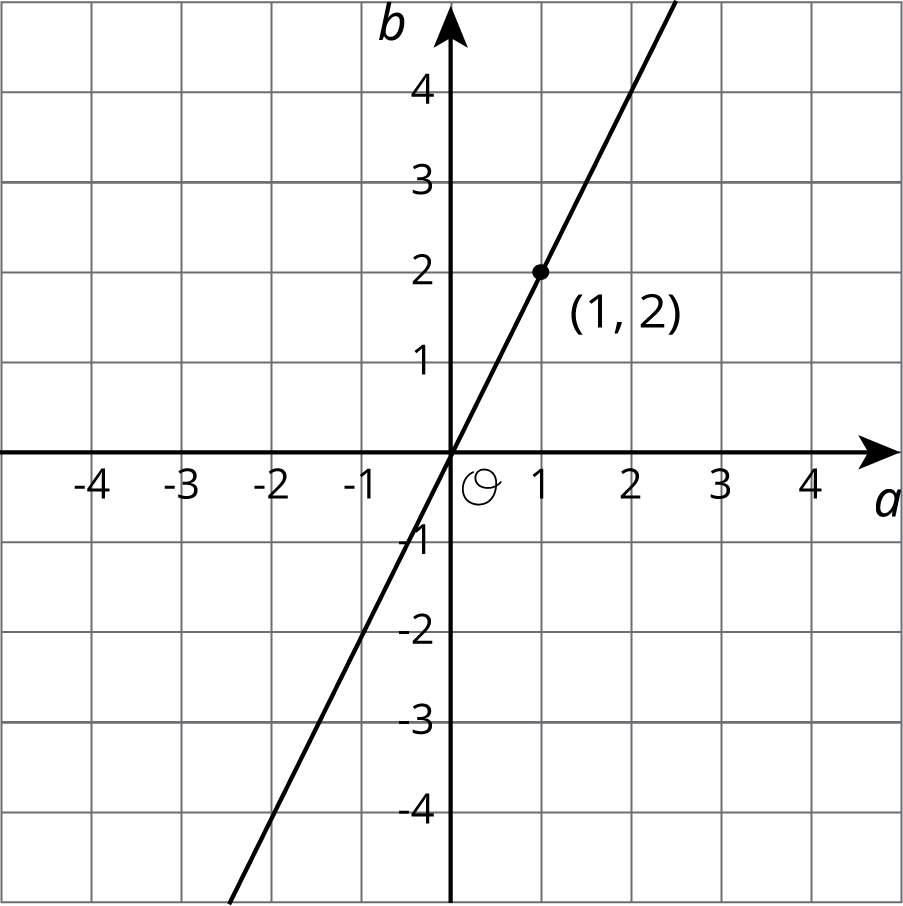
For example, suppose we need to buy 20 pieces of fruit and decide to buy apples and bananas. If we select the number of apples first, the equation \(b=20-a\) shows the number of bananas we can buy. The number of bananas is the dependent variable because it depends on the number of apples.
- independent variable
An independent variable represents the input of a function.
For example, suppose we need to buy 20 pieces of fruit and decide to buy some apples and bananas. If we select the number of apples first, the equation \(b=20-a\) shows the number of bananas we can buy. The number of apples is the independent variable because we can choose any number for it.
- radius
A radius is a line segment that goes from the center to the edge of a circle. A radius can go in any direction. Every radius of the circle is the same length. We also use the word radius to mean the length of this segment.
For example, \(r\) is the radius of this circle with center \(O\).

- volume
Volume is the number of cubic units that fill a three-dimensional region, without any gaps or overlaps.
For example, the volume of this rectangular prism is 60 units3, because it is composed of 3 layers that are each 20 units3.
