Lesson 4
Tables, Equations, and Graphs of Functions
Let’s connect equations and graphs of functions.
Problem 1
The graph and the table show the high temperatures in a city over a 10-day period.
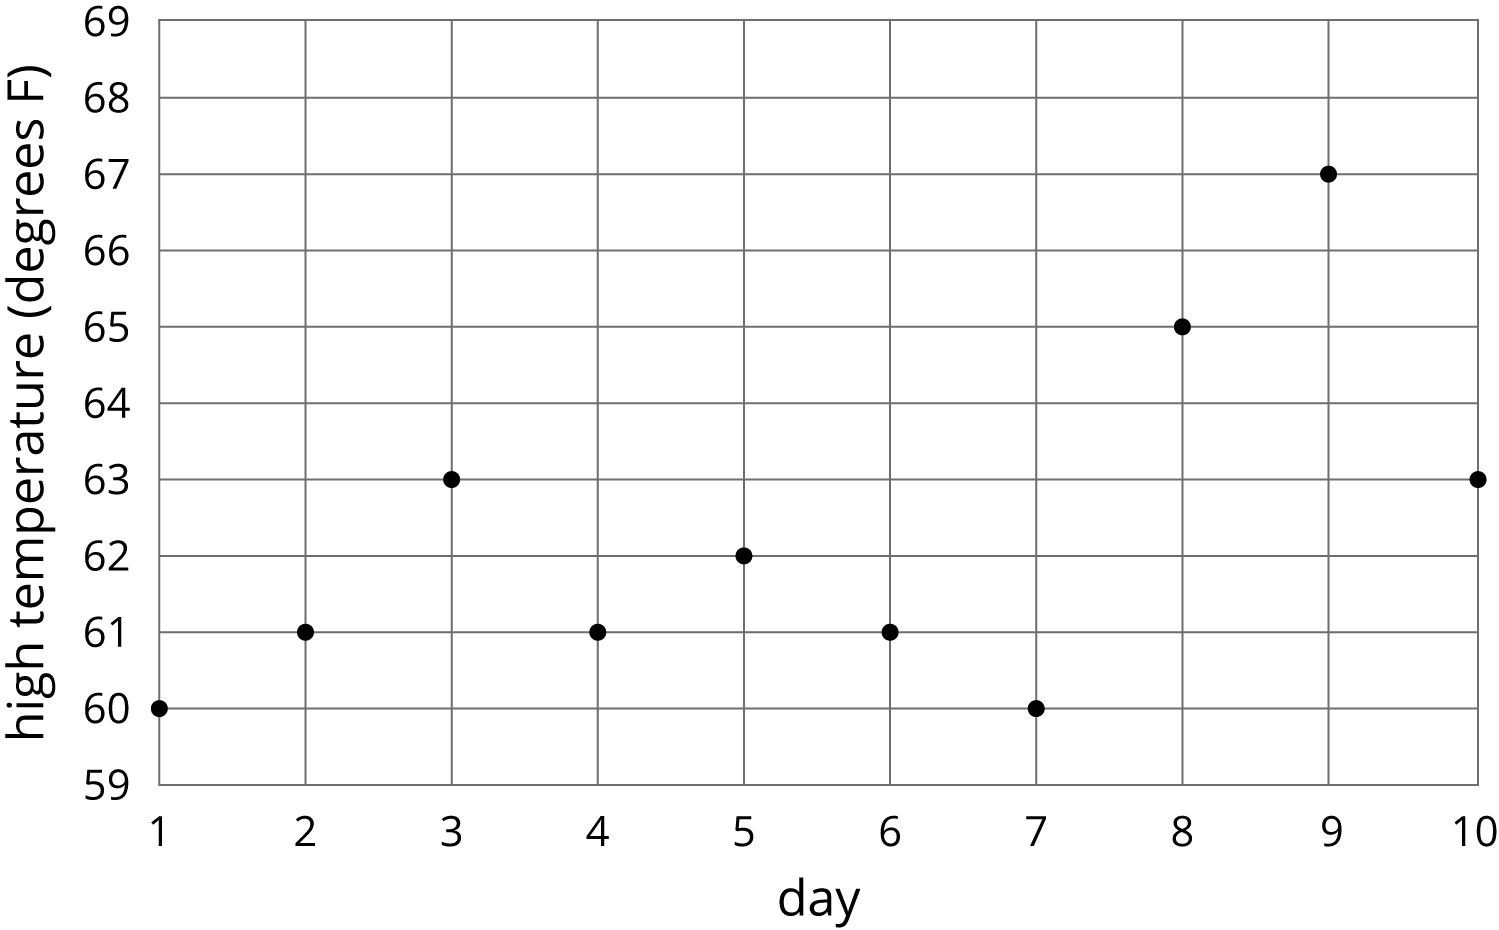
| day | 1 | 2 | 3 | 4 | 5 | 6 | 7 | 8 | 9 | 10 |
|---|---|---|---|---|---|---|---|---|---|---|
| temperature (degrees F) | 60 | 61 | 63 | 61 | 62 | 61 | 60 | 65 | 67 | 63 |
-
What was the high temperature on Day 7?
-
On which days was the high temperature 61 degrees?
-
Is the high temperature a function of the day? Explain how you know.
-
Is the day a function of the high temperature? Explain how you know.
Problem 2
The amount Lin’s sister earns at her part-time job is proportional to the number of hours she works. She earns $9.60 per hour.
-
Write an equation in the form \(y=kx\) to describe this situation, where \(x\) represents the hours she works and \(y\) represents the dollars she earns.
-
Is \(y\) a function of \(x\)? Explain how you know.
-
Write an equation describing \(x\) as a function of \(y\).
Problem 3
Use the equation \(2m+4s=16\) to complete the table, then graph the line using \(s\) as the dependent variable.
| \(m\) | 0 | -2 | ||
|---|---|---|---|---|
| \(s\) | 3 | 0 |
Problem 4
Solve the system of equations: \(\begin{cases} y=7x+10 \\ y=\text-4x-23 \\ \end{cases}\)