Lesson 1
Organizing Data
Lesson Narrative
To open the unit on finding associations between two variables, students are asked to consider a list of unsorted data to notice any patterns or associations. Later, students organize the table to make the pattern more clear and then see a scatter plot as a graphic representation of data that can make the association even more obvious. The last activity in the lesson asks students to match different representations of data (MP7) and stresses the importance of labeling each representation so that the meaning is not lost. Scatter plots will be used throughout the unit to help students recognize various associations between variables.
Learning Goals
Teacher Facing
- Comprehend that a “scatter plot” represents data with two variables and does not represent a function.
- Coordinate (orally and in writing) representations of data in scatter plots and tables.
- Describe (orally and in writing) patterns in representations of data in scatter plots and tables, and use these representations to make predictions.
Student Facing
Let’s find ways to show patterns in data
Required Materials
Required Preparation
Provide one copy of the blackline master from the activity Tables and Their Scatter Plots for each student.
Learning Targets
Student Facing
- I can organize data to see patterns more clearly.
Glossary Entries
-
scatter plot
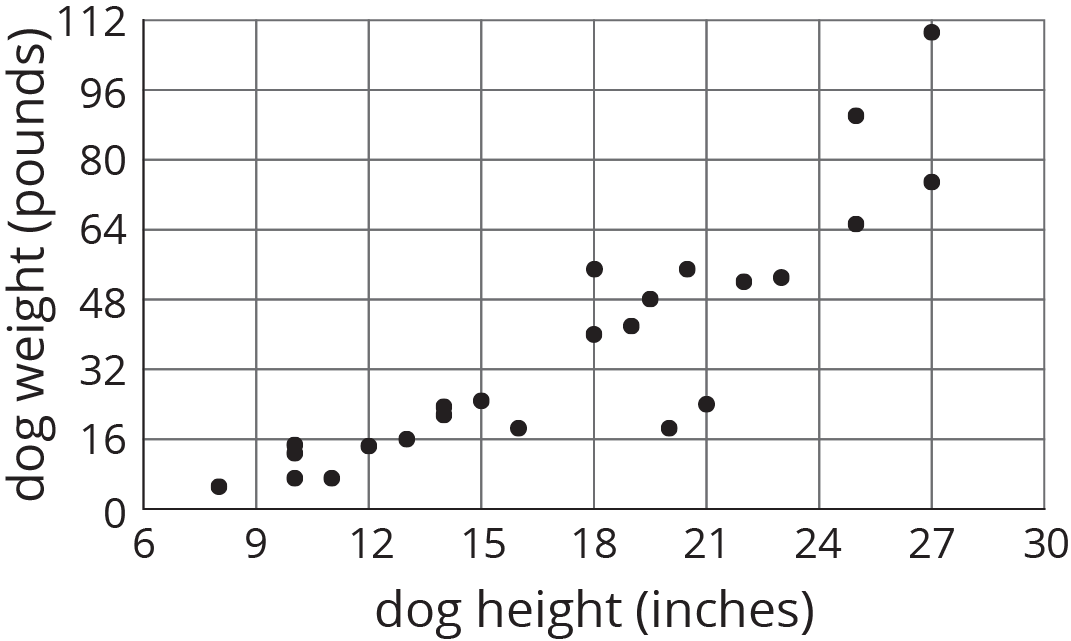
A scatter plot is a graph that shows the values of two variables on a coordinate plane. It allows us to investigate connections between the two variables.
Each plotted point corresponds to one dog. The coordinates of each point tell us the height and weight of that dog.

Print Formatted Materials
For access, consult one of our IM Certified Partners.
Additional Resources
| Google Slides | For access, consult one of our IM Certified Partners. |
|
| PowerPoint Slides | For access, consult one of our IM Certified Partners. |