Lesson 1
Organizing Data
Problem 1
Here is data on the number of cases of whooping cough from 1939 to 1955.
| year | number of cases |
|---|---|
| 1941 | 222,202 |
| 1950 | 120,718 |
| 1945 | 133,792 |
| 1942 | 191,383 |
| 1953 | 37,129 |
| 1939 | 103,188 |
| 1951 | 68,687 |
| 1948 | 74,715 |
| 1955 | 62,786 |
| 1952 | 45,030 |
| 1940 | 183,866 |
| 1954 | 60,866 |
| 1944 | 109,873 |
| 1946 | 109,860 |
| 1943 | 191,890 |
| 1949 | 69,479 |
| 1947 | 156,517 |
- Make a new table that orders the data by year.
- Circle the years in your table that had fewer than 100,000 cases of whooping cough.
- Based on this data, would you expect 1956 to have closer to 50,000 cases or closer to 100,000 cases?
Solution
For access, consult one of our IM Certified Partners.
Problem 2
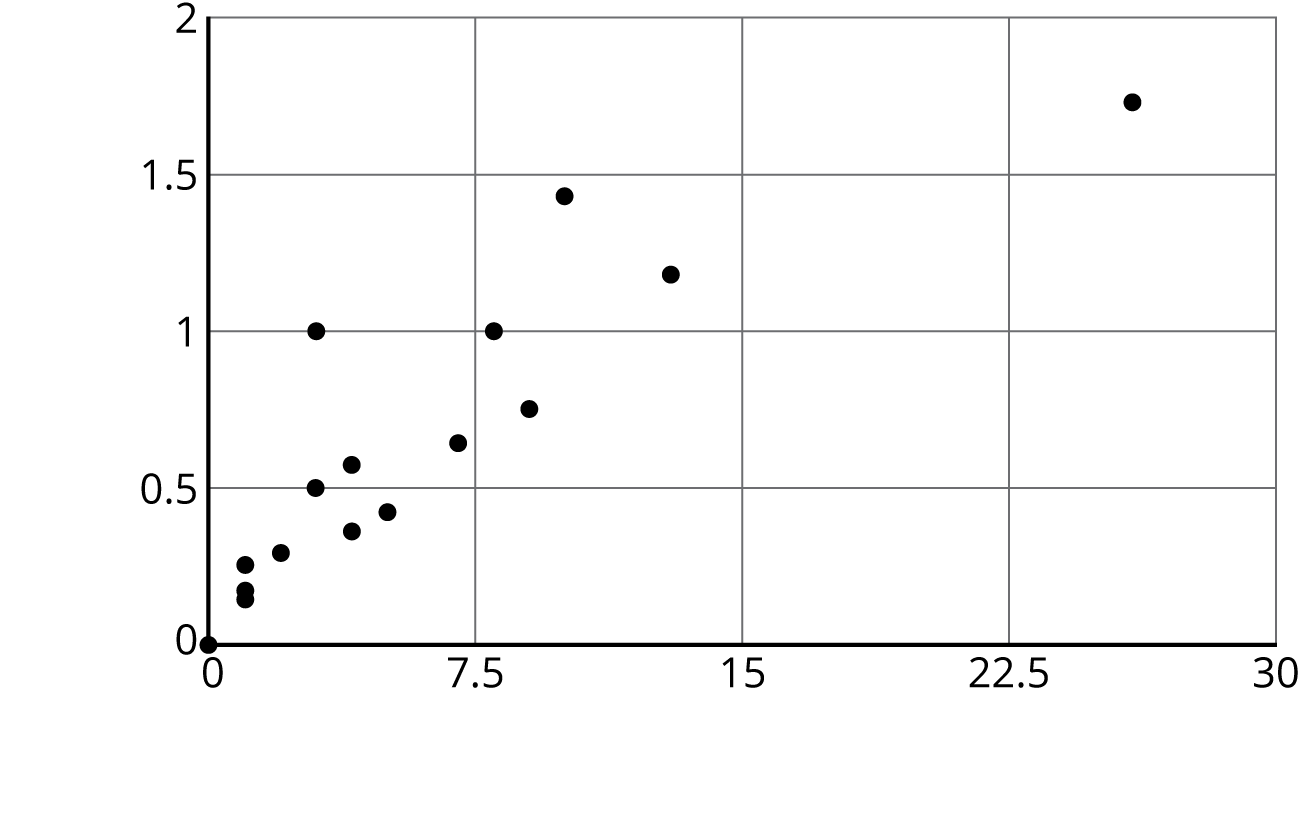
In volleyball statistics, a block is recorded when a player deflects the ball hit from the opposing team. Additionally, scorekeepers often keep track of the average number of blocks a player records in a game. Here is part of a table that records the number of blocks and blocks per game for each player in a women’s volleyball tournament. A scatter plot that goes with the table follows.
| blocks | blocks per game |
|---|---|
| 13 | 1.18 |
| 1 | 0.17 |
| 5 | 0.42 |
| 0 | 0 |
| 0 | 0 |
| 7 | 0.64 |

Label the axes of the scatter plot with the necessary information.
Solution
For access, consult one of our IM Certified Partners.
Problem 3
A cylinder has a radius of 4 cm and a height of 5 cm.
- What is the volume of the cylinder?
- What is the volume of the cylinder when its radius is tripled?
- What is the volume of the cylinder when its radius is halved?
Solution
For access, consult one of our IM Certified Partners.
(From Unit 5, Lesson 18.)