Lesson 8
Linear Functions
8.1: Bigger and Smaller (5 minutes)
Warm-up
The purpose of this warm-up is for students to reason about the values we can assign graphs based on which feature of the graph, such as slope and \(y\)-intercept, the viewer focuses on. Since there are no numbers on the graph, it is important for students to explain how they know the sign of the slope and \(y\)-intercept based on the position of the graph.
Launch
Display the three graphs for all to see. Tell students that all three graphs have the same scale. Give students 1–2 minutes of quiet work time, followed by a whole-class discussion.
Student Facing
Diego said that these graphs are ordered from smallest to largest. Mai said they are ordered from largest to smallest. But these are graphs, not numbers! What do you think Diego and Mai are thinking?

Student Response
For access, consult one of our IM Certified Partners.
Activity Synthesis
Display the three graphs for all to see. Invite students to share what they think Diego and Mai are thinking. Encourage students to reference the graphs in their explanation. Record and display their responses for all to see. Emphasize that even though there are no numbers shown, we can tell the sign of the slope and the sign of the \(y\)-intercept based on the position of the line.
8.2: Proportional Relationships Define Linear Functions (15 minutes)
Activity
This activity begins connecting proportional relationships, which students learned in previous grades, to functions. Students use function language with proportional relationships and make connections between what they know about functions and what they know about proportional relationships. Students use similar contexts from previous grades to learn that proportional relationships are linear functions. They are also asked to determine the independent and dependent variables and the equation of the function.
Monitor for students who made opposite decisions assigning the independent and dependent variables. For the first problem, some may have written \(M=7t\) and some may have written \(t= \frac17 M\). For the second problem, some may have written \(f = 3y\), and some may have written \(y = \frac13 f\).
Launch
Arrange students in groups of 2. Give students 3–5 minutes of quiet work time and then time to share responses with their partner. Follow with a whole-class discussion.
Supports accessibility for: Visual-spatial processing
For example, “______ is the independent variable, because_____.” or “______ depends on _____, because ______.”
Design Principle(s): Support sense-making, Optimize output (for justification)
Student Facing
- Jada earns $7 per hour mowing her neighbors’ lawns.
- Name the two quantities in this situation that are in a functional relationship. Which did you choose to be the independent variable? What is the variable that depends on it?
- Write an equation that represents the function.
- Here is a graph of the function. Label the axes. Label at least two points with input-output pairs.

- To convert feet to yards, you multiply the number of feet by \(\frac13\).
- Name the two quantities in this situation that are in a functional relationship. Which did you choose to be the independent variable? What is the variable that depends on it?
- Write an equation that represents the function.
- Draw the graph of the function. Label at least two points with input-output pairs.

Student Response
For access, consult one of our IM Certified Partners.
Anticipated Misconceptions
Students may use different scales on the axes and then try to compare rates. Point out that in order to compare the constant rate of change visually, the scales and labels on the axes must be the same. For example, students who use the representation \(M=7t\) versus the representation \(t=\frac{M}{7}\) may have graphs that look either very similar or very different depending on how they scaled the axes, and students who write the same equation but use different scales may have graphs that look different from each other.
If students appear to be stuck on this misconception, consider selecting two graphs of the same function that use different scales and adding a point to the discussion about using scale to compare representations of the graph. Consider asking, “What could we do to the scale on the axes to see the constant rate of change on each graph and accurately compare them?” (Use the same scale on each axis, or graph both axes using the same length to represent 1 unit.)
Activity Synthesis
The purpose of this discussion is for students to understand that proportional relationships are functions and to connect the parts of functions to what they know about proportional relationships. Select previously identified students to share their equations and graphs. Sequence student work so that at least one example of each representation is shown for each of the problems, starting with the most common representation. Display their responses for all to see. Consider asking some of the following questions to help students make connections between the different representations:
- “For the first problem, if we wanted to know how many hours Jada needs to work to make a certain amount of money, which equation would make more sense to use? Why?” (\(t = \frac17 M\), because in that equation, time worked, \(t\), is expressed as a function of money earned, \(M\).)
- “For the second problem, when would we want to use the equation \(f = 3y\)?” (When we know the number of yards and need to calculate the number of feet.)
- “How do we know that each of these situations are represented by functions?” (For each valid input, there is only one output. For example, no matter which equation I use for the relationship between feet and yards, a specific number of feet will always equal the same number of yards.)
8.3: Is it Filling Up or Draining Out? (10 minutes)
Activity
The purpose of this activity is to connect features of an equation representing a function to what that means in a context.
Students start with two functions that represent a tank being filled up and another being drained out and are asked to determine which equations represent which situation. This gives students the opportunity to connect initial value and slope, which they learned about in a previous unit, to the general form of the linear equation and to the fact that linear relationships are functions.
Launch
Arrange students in groups of 2. Give students 3–5 minutes of quiet work time and then time to share their responses with their partner and reach agreement on their answers. Encourage partners to talk about specific parts of the graph and equation that indicate whether the tank is filling up or draining out. Follow with a whole-class discussion.
Supports accessibility for: Organization; Attention
Design Principle(s): Maximize meta-awareness; Support sense-making
Student Facing
There are four tanks of water.
- The amount of water in gallons, \(A\), in Tank A is given by the function \(A = 200 + 8t\), where \(t\) is in minutes.
- The amount of water in gallons, \(B\), in Tank B starts at 400 gallons and is decreasing at 5 gallons per minute. These functions work when \(t \geq 0\) and \(t \leq 80\).
- Which tank started out with more water?
- Write an equation representing the relationship between \(B\) and \(t\).
- One tank is filling up. The other is draining out. Which is which? How can you tell?
- The amount of water in gallons, \(C\), in Tank C is given by the function \(C = 800 - 7t\). Is it filling up or draining out? Can you tell just by looking at the equation?
- The graph of the function for the amount of water in gallons, \(D\), in Tank D at time \(t\) is shown. Is it filling up or draining out? How do you know?

Student Response
For access, consult one of our IM Certified Partners.
Student Facing
Are you ready for more?
- Pick a tank that was draining out. How long did it take for that tank to drain? What percent full was the tank when 30% of that time had elapsed? When 70% of the time had elapsed?
- What point in the plane is 30% of the way from \((0,15)\) to \((5,0)\)? 70% of the way?
- What point in the plane is 30% of the way from \((3,5)\) to \((8,6)\)? 70% of the way?
Student Response
For access, consult one of our IM Certified Partners.
Activity Synthesis
Consider asking some of the following questions to begin the discussion:
- “For the second problem, what in the equation tells you that the slope is decreasing? Increasing?” (Decreasing: the slope in the equation is negative; Increasing: the slope in the equation is positive.)
- “For the third problem, what is similar between the equation in this problem and the decreasing equation in the previous problem?”
(Both slopes are negative.) - “For the last problem, what in the graph tells you that Tank D is draining out? What would a graph that has a tank filling up look like? What would be different?” (I know it is draining out because the graph is going down from left to right. If the tank were filling up, the graph would be going up from left to right.)
Tell students that a linear function can always be represented with an equation of the form \(y = mx+b\). The slope of the line, \(m\), is the rate of the change of the function and the initial value of the function is \(b\).
If time allows, give students the following scenario to come up with a possible equation for Tank D:
“Tank D started out with more water than Tank B but less water than Tank C. The water is draining from Tank D faster than from Tank B but slower than Tank C. What is a possible equation for the graph of the function for the amount of water \(D\) in Tank D over time \(t\)?” (Students should choose an initial value between 400 and 800, and a constant rate of change between -7 and -5. One possible such equation might be \(D=600-6t\).)
8.4: Which is Growing Faster? (10 minutes)
Optional activity
The purpose of this activity is for students to connect their work with linear equations to functions. The two linear functions in this activity are represented differently and students are asked to compare various features of each representation.
Identify students who use different methods to answer the questions.
For example, students may write an equation to represent Noah’s account, and others may make a table to show the value in each account at different numbers of weeks by reasoning about the rate of change and the amount in each account when they were opened.
Launch
Give students 1–2 minutes of quiet work time. Follow with a whole-class discussion.
Student Facing
Noah is depositing money in his account every week to save money. The graph shows the amount he has saved as a function of time since he opened his account.
Elena opened an account the same day as Noah. The amount of money \(E\) in her account is given by the function \(E=8w+60\), where \(w\) is the number of weeks since the account was opened.
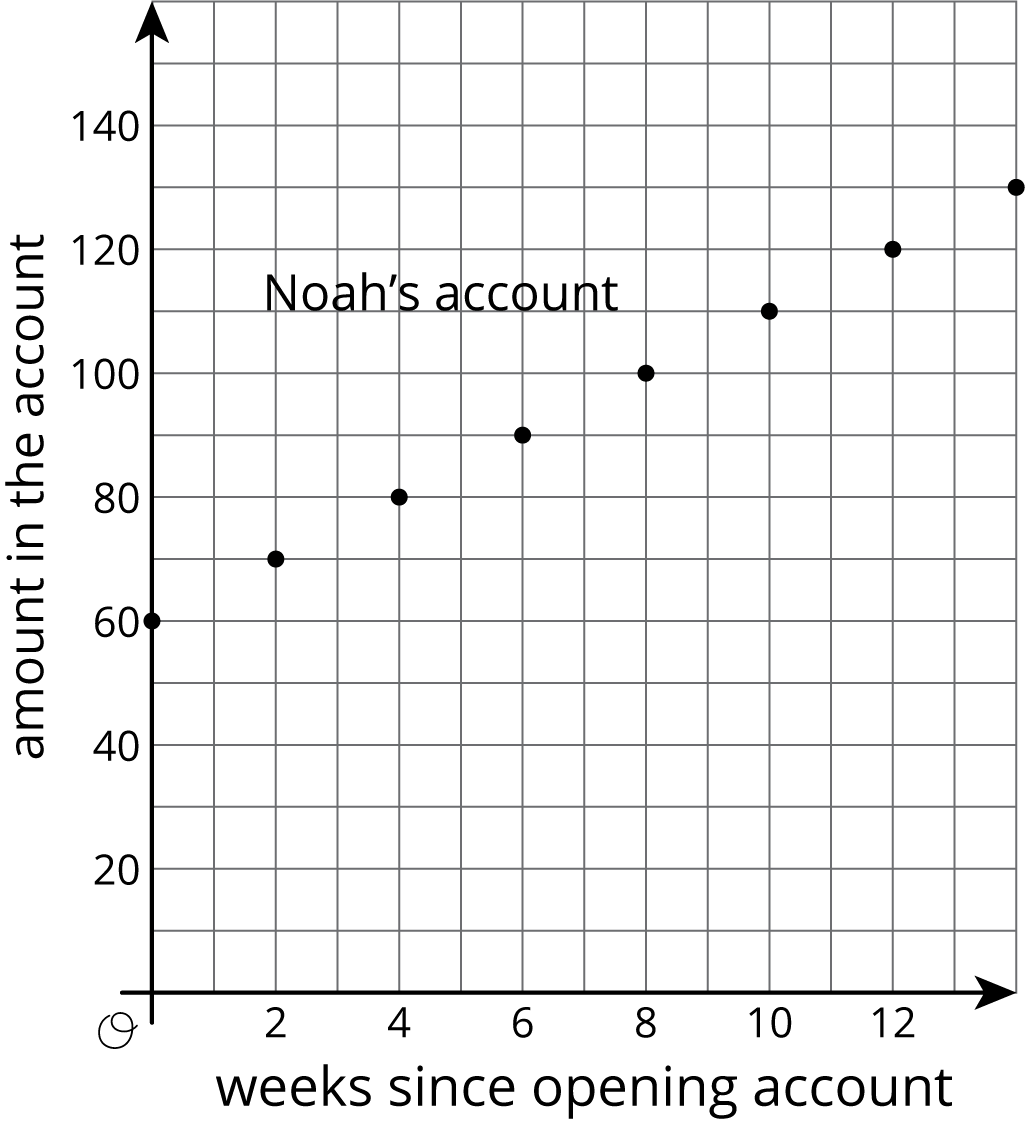
- Who started out with more money in their account? Explain how you know.
- Who is saving money at a faster rate? Explain how you know.
- How much will Noah save over the course of a year if he does not make any withdrawals? How long will it take Elena to save that much?
Student Response
For access, consult one of our IM Certified Partners.
Activity Synthesis
Display the graph of Noah’s savings over time and the equation for the amount of money in Elena’s account for all to see. Select students previously identified to share their responses.
Consider asking the following questions to help student make connections between the different representations:
- “How did you determine the amount Noah saved in a year?” (I used the graph to figure out that Noah saves $5 each week and multiplied that by 52 weeks.)
- “What equations could you use to solve the last question?” (I could use the equation \(N=60+5w\) for the amount of money in Noah’s account after \(w\) weeks. When \(w=52\), Noah has $320. If I solve the equation \(320=8w+60\) for \(w\), I would know how many weeks it would take Elena to have $320 in her account.)
- “How could you solve the last question without using an equation?”
(I could extend the graph out to 52 weeks and plot the value of each account over the year.)
Supports accessibility for: Attention; Social-emotional skills
Design Principle(s): Optimize output (for explanation)
Lesson Synthesis
Lesson Synthesis
To help students make connections between work they have done previously with linear equations and functions, consider asking some of the following questions:
- “How can we tell if a linear function is increasing from an equation? From a graph?” (In a linear equation \(y=mx+b\), if \(m\) is positive, the linear function is increasing. In a graph, if the line is going up from left to right, then the function is increasing.)
- “How can we tell from the graph if the initial value of the function is positive? How can I tell from the equation?” (If the graph of the function crosses the vertical axis above 0, then the initial value is positive. In the equation, \(y=mx+b\) of a linear function, the \(b\) is positive when the initial value is positive.)
8.5: Cool-down - Beginning to See Daylight (5 minutes)
Cool-Down
For access, consult one of our IM Certified Partners.
Student Lesson Summary
Student Facing
Suppose a car is traveling at 30 miles per hour. The relationship between the time in hours and the distance in miles is a proportional relationship. We can represent this relationship with an equation of the form \(d = 30t\), where distance is a function of time (since each input of time has exactly one output of distance). Or we could write the equation \(t = \frac{1}{30} d\) instead, where time is a function of distance (since each input of distance has exactly one output of time).
More generally, if we represent a linear function with an equation like \(y = mx + b\), then \(b\) is the initial value (which is 0 for proportional relationships), and \(m\) is the rate of change of the function. If \(m\) is positive, the function is increasing. If \(m\) is negative, the function is decreasing. If we represent a linear function in a different way, say with a graph, we can use what we know about graphs of lines to find the \(m\) and \(b\) values and, if needed, write an equation.