Lesson 6
Even More Graphs of Functions
6.1: Dog Run (5 minutes)
Warm-up
The purpose of this warm-up is for students to realize there are different dependent variables that can be used when making a model of a context and the choice of which we use affects how a graph of a function looks. In the warm-up, students compare two graphs and then determine what the creator of each graph chose as their dependent variable. During the partner discussion, students should listen to their partner’s argument and decide if they agree or disagree with what they are saying (MP3).
Launch
Display the 5 pictures of the dog from the print statement for all to see. Ask “What is happening in this succession of pictures?” After a brief quiet think time, invite students to share their answers. (As time elapses, the dog is moving.) Tell students they are going to consider two graphs describing the dog’s movement.
Arrange students in groups of 2. Give 1–2 minutes of quiet work time and then have them share their responses with their partner to see if they agree or disagree with what variables Diego and Lin graphed. If partners do not agree, encourage students to make sense of their partner’s thinking and reach a consensus. Follow with a whole-class discussion.
Student Facing
Here are five pictures of a dog taken at equal intervals of time.

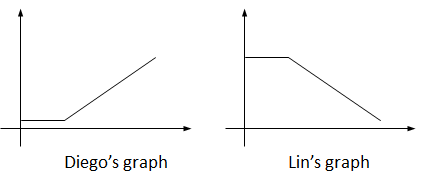
Diego and Lin drew different graphs to represent this situation:

They both used time as the independent variable. What do you think each one used for the dependent variable? Explain your reasoning.
Student Response
For access, consult one of our IM Certified Partners.
Activity Synthesis
The goal of this discussion is for students to understand that the same situation can be represented in different ways depending on what variables you choose to represent.
Select students to share the different variables that they think Lin and Diego used in their graphs. If any partners disagreed at first, ask those groups to share how they decided on their final response for what variables Diego and Lin were using.
6.2: Which Graph is It? (10 minutes)
Activity
The purpose of this activity is for students to sketch a graph showing the qualitative features of the function described in the problem. Building on the warm-up, in the first problem students decide what independent and dependent variables were used to create a given graph. In the second problem, students choose the variables and make their own sketch of the context. The problems are designed to have multiple correct solutions based on which quantities students identify in the descriptions. For example, Jada's information could be viewed from the perspective that the time it takes her to swim a lap depends on how much she practices. Alternatively, we could also say that the number of seconds she takes off her time depends on how much she practices.
Watch for groups choosing different graphs for the first problem and groups sketching different graphs for the last problem to share during discussion.
Launch
Tell students to close their books or devices (or to keep them closed). Arrange students in groups of 2. Display the statement and graphs for all to see:
Elena filled up the tub and gave her small dog a bath. Then she let the water out of the tub.

Ask groups to decide which graph best fits the provided context and what independent and dependent variables were used to create it. Give 1–2 minutes for partners to discuss and then select 2–3 groups to share their graph pick and choice for variables. (The second graph shows the amount of water increasing, then staying steady, then decreasing over time. The amount of water in the bath tub is a function of time.)
Supports accessibility for: Conceptual processing; Visual-spatial processing
Design Principle(s): Support sense-making; Optimize output (for explanation)
Student Facing
For each situation,
- name the independent and dependent variables
- pick the graph that best fits the situation, or sketch the graph if one isn't provided
- label the axes
- answer the question: which quantity is a function of which? Be prepared to explain your reasoning.
- Jada is training for a swimming race. The more she practices, the less time it takes for her to swim one lap.

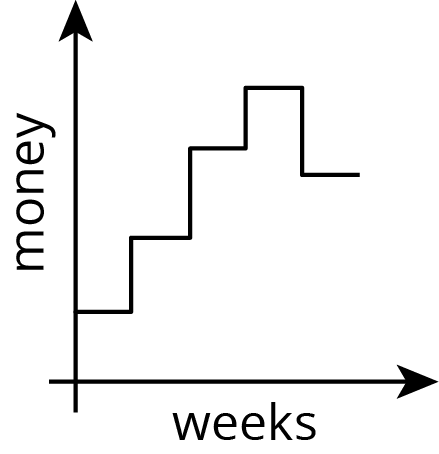
- Andre adds some money to a jar in his room each week for 3 weeks and then takes some out in week 4.

Student Response
For access, consult one of our IM Certified Partners.
Anticipated Misconceptions
Students may have a difficult time representing the “jump” when money is added to the jar. Remind them of some of the function graphs they have seen in the past, such as with only discrete points plotted, to remind them that graphs do not have to be a single, connected line.
Activity Synthesis
Select previously identified groups to share their responses and record and display their graphs for all to see.
If time allows, begin the discussion of the last problem by displaying this graph and asking students what they think of it as a possible representation of the amount of money in Andre's savings jar:

Give students 1 minute to consider the graph. Invite students to explain their thoughts about why it is or is not a good representation. (For example, the vertical lines would mean that at the same time the jar has two different amounts of money in it, which isn't possible, so this is not a good representation.) Remind students that functions only have one input for each output, so relationships whose graphs have vertical lines cannot be functions.
One way to represent a function that steps in this way uses open and closed circles to show that the function has only one value at each particular time. Discuss with students how to redraw this graph with open and closed circles so that the graph represents a function.
6.3: Sketching a Story about a Boy and a Bike (20 minutes)
Activity
The purpose of this task is for students to sketch a graph from a story. In order to make the sketch, students must select two quantities from the story to graph, decide which is the independent variable and which is the dependent variable, and create and label their axes based on their decisions (MP4).
Monitor for displays that are correct but different from each other in important ways for students to focus on during the discussion. For example, they may differ by what variables were graphed such as:
- distance from home as a function of time
- distance from park as a function of time
- total distance traveled as a function of time
Launch
Arrange students in groups of 2–3. Distribute tools for creating a visual display. Before students begin, it may be necessary to demonstrate how to “create a set of axes” so that a first-quadrant graph can be sketched and is large enough to be seen from a distance. Group work time followed by a whole-class discussion.
If using the digital activity, the Activity Narrative is still valid, and student graphs will be used to drive the class discussion. What varies from the print activity is students will have access to an applet to create their graphs. Students will be able to share their graphs by projecting their screen. They may need to save their graph by either exporting the image or “printscreen” to a word document.
Supports accessibility for: Organization; Conceptual processing; Attention
Design Principle(s): Support sense-making; Maximize meta-awareness
Student Facing
You will use the tools in the applet for creating a visual display that shows your response to each question.
Here is a story: “Noah was at home. He got on his bike and rode to his friend’s house and stayed there for awhile. Then he rode home again. Then he rode to the park. Then he rode home again.”
-
Sketch a graph of this story.
-
What are the two quantities? Label the axes with their names and units of measure. (For example, if this were a story about pouring water into a pitcher, one of your labels might say “volume (liters).”)
- Which quantity is a function of which? Explain your reasoning.
- Based on your graph, is his friend’s house or the park closer to Noah's home? Explain how you know.
- Read the story and all your responses again. Does everything make sense? If not, make changes to your work.
Note: To change the values on the axes, select the Move Graphics tool, click near the end of the axis you want to change, and drag it to grow or shrink it.

Student Response
For access, consult one of our IM Certified Partners.
Launch
Arrange students in groups of 2–3. Distribute tools for creating a visual display. Before students begin, it may be necessary to demonstrate how to “create a set of axes” so that a first-quadrant graph can be sketched and is large enough to be seen from a distance. Group work time followed by a whole-class discussion.
If using the digital activity, the Activity Narrative is still valid, and student graphs will be used to drive the class discussion. What varies from the print activity is students will have access to an applet to create their graphs. Students will be able to share their graphs by projecting their screen. They may need to save their graph by either exporting the image or “printscreen” to a word document.
Supports accessibility for: Organization; Conceptual processing; Attention
Design Principle(s): Support sense-making; Maximize meta-awareness
Student Facing
Your teacher will give you tools for creating a visual display. With your group, create a display that shows your response to each question.
Here is a story: “Noah was at home. He got on his bike and rode to his friend’s house and stayed there for awhile. Then he rode home again. Then he rode to the park. Then he rode home again.”
- Create a set of axes and sketch a graph of this story.
- What are the two quantities? Label the axes with their names and units of measure. (For example, if this were a story about pouring water into a pitcher, one of your labels might say “volume (liters).”)
- Which quantity is a function of which? Explain your reasoning.
- Based on your graph, is his friend’s house or the park closer to Noah's home? Explain how you know.
- Read the story and all your responses again. Does everything make sense? If not, make changes to your work.
Student Response
For access, consult one of our IM Certified Partners.
Student Facing
Are you ready for more?
It is the year 3000. Noah’s descendants are still racing around the park, but thanks to incredible technological advances, now with much more powerful gadgets at their disposal. How might their newfound access to teleportation and time-travel devices alter the graph of stories of their daily adventures? Could they affect whether or not the distance from home is a function of the time elapsed?
Student Response
For access, consult one of our IM Certified Partners.
Anticipated Misconceptions
Students may try and start graphing before they have clearly articulated and labeled their axes with their chosen variables. Encourage groups to make sure all are in agreement on what variables they are graphing before they create their display.
Activity Synthesis
Select previously identified groups to share their visual displays for all to see throughout the discussion. Give students 2–3 minutes of quiet think time to review the 3 displays and identify differences and similarities. Invite students to share what they identified and record and display the responses for all to see. If not brought up by students, ask:
- “What is the same and different about the two quantities that each group chose to use in their visual display?”
- “Did each group use the same units of measure? Why does it make sense to use the unit of measure seen in any of these examples?”
- “Why does it make sense to have time be the independent variable in this situation?"
- “Do all of these examples make sense in relation to the situation?”
Conclude the discussion by refocusing students on the input-output pairs described by the different graphs. For example, on a graph where distance from home is a function of time, there should be three inputs where the output is zero since he starts at home, returns home from his friend’s house, and ends at home.
Alternatively, have the class do a “gallery walk” in which students leave written feedback on sticky-notes for the other groups. Here is guidance for the kind of feedback students should aim to give each other:
- “What is one thing that group did that would have made your project better if you had done it?”
- “What is one thing your group did that would have improved their project if they did it too?”
- “Does their answer make sense in the situation?”
- “Is their answer about which house is closer to the park clear and correct?”
- “If there was a mistake, what could they be more careful about in similar problems?”
Lesson Synthesis
Lesson Synthesis
Keep students in the same groups. Remind them of the multiple representations of the situation in the last activity. Tell students to imagine a situation that could be modeled in at least two different ways, depending upon which variables are chosen for the axes. Give time for students to write a clear explanation of the situation, the variables chosen, and how the choices would affect the appearance of the graph. If time allows, have students sketch an example of each of their graphs and share.
6.4: Cool-down - Walking Home From School (5 minutes)
Cool-Down
For access, consult one of our IM Certified Partners.
Student Lesson Summary
Student Facing
Here is a graph showing Andre's distance as a function of time.

For a graph representing a context, it is important to specify the quantities represented on each axis. For example, if this is showing distance from home, then Andre starts at some distance from home (maybe at his friend’s house), moves further away (maybe to a park), then returns home. If instead the graph is showing distance from school, the story may be Andre starts out at home, moves further away (maybe to a friend's house), then goes to school. What could the story be if the graph is showing distance from a park?