Lesson 17
Scaling One Dimension
17.1: Driving the Distance (5 minutes)
Warm-up
The purpose of this warm-up is for students to jump back into recognizing functions and determining if two quantities are a function of each other. Students are asked questions similar to these throughout this lesson, and the discussion of this warm-up is meant to get students using the language of functions, which continues throughout the rest of the activities.
Launch
Give students 1–2 minutes of quiet work time, followed by a whole-class discussion.
Student Facing
Here is a graph of the amount of gas burned during a trip by a tractor-trailer truck as it drives at a constant speed down a highway:
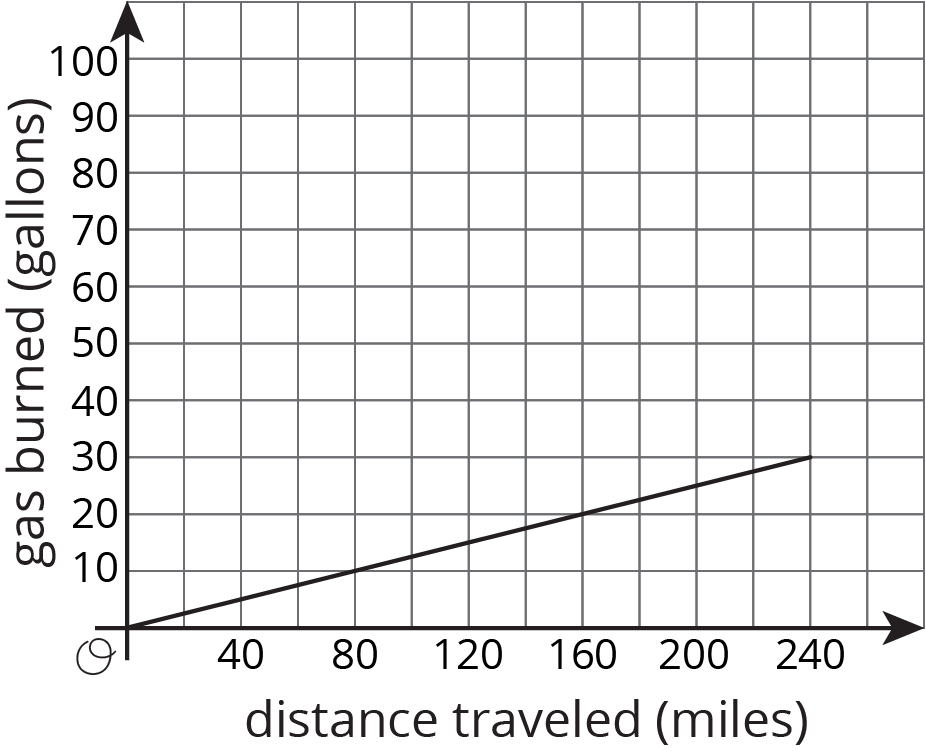
- At the end of the trip, how far did the truck drive, and how much gas did it use?
- If a truck traveled half this distance at the same rate, how much gas would it use?
- If a truck traveled double this distance at the same rate, how much gas would it use?
- Complete the sentence: ___________ is a function of _____________.
Student Response
For access, consult one of our IM Certified Partners.
Anticipated Misconceptions
If students struggle with the second and third questions, ask them if this is an example of a proportional relationship. Remind them what they learned previously about proportional relationships and how that can be used to answer these questions.
Activity Synthesis
Invite students to share their answers and their reasoning for why gas burned is a function of distance traveled. Questions to further the discussion around functions:
- “Looking at the graph, what information do you need in order to determine how much gas was used?” (We need to know the number of miles traveled.)
- “What is the independent variable? Dependent variable? How can you tell from the graph?” (The independent value is the distance traveled. The dependent value is the gas burned. By convention, the independent is on the \(x\)-axis and the dependent is on the \(y\)-axis.)
- “What are some ways that we can tell from the graph that the relationship between gas burned and distance traveled is proportional?” (The graph is a line that goes through the origin, we can see a constant ratio between \(y\) and \(x\) in some points like \((80,10), (160, 20)\), and \((240, 30)\).)
17.2: Double the Edge (10 minutes)
Optional activity
This activity is optional. The purpose of this activity is for students to apply what they know about functions and their representations in order to investigate the effect of a change in one dimension on the volume of a rectangular prism. Students use graphs and equations to represent the volume of a rectangular prism with one unknown edge length. They then use these representations to investigate what happens to the volume when one of the edge lengths is doubled. Groups make connections between the different representations by pointing out how the graph and the equation reflect an edge length that is doubled. Identify groups who make these connections and ask them to share during the discussion.
Launch
Arrange students in groups of 2. Give students 2–3 minutes of quiet work time, followed by time to discuss the last question with their partner. Follow with a whole-class discussion.
Students using the digital activity can generate the graph using the digital applet.
Supports accessibility for: Organization; Conceptual processing; Attention
Student Facing
There are many right rectangular prisms with one edge of length 5 units and another edge of length 3 units. Let \(s\) represent the length of the third edge and \(V\) represent the volume of these prisms.
-
Write an equation that represents the relationship between \(V\) and \(s\).
-
Graph this equation.
- What happens to the volume if you double the edge length \(s\)? Where do you see this in the graph? Where do you see it algebraically?
Student Response
For access, consult one of our IM Certified Partners.
Launch
Arrange students in groups of 2. Give students 2–3 minutes of quiet work time, followed by time to discuss the last question with their partner. Follow with a whole-class discussion.
Students using the digital activity can generate the graph using the digital applet.
Supports accessibility for: Organization; Conceptual processing; Attention
Student Facing
There are many right rectangular prisms with one edge of length 5 units and another edge of length 3 units. Let \(s\) represent the length of the third edge and \(V\) represent the volume of these prisms.
- Write an equation that represents the relationship between \(V\) and \(s\).
- Graph this equation and label the axes.
- What happens to the volume if you double the edge length \(s\)? Where do you see this in the graph? Where do you see it algebraically?
Student Response
For access, consult one of our IM Certified Partners.
Anticipated Misconceptions
If students struggle to see how the change in volume is reflected in the equation, have them start with values from the graph and put those into the equation to see how the volume changes.
Activity Synthesis
The goal of the discussion is to ensure that students use function representations to support the idea that the volume doubles when \(s\) is doubled.
Select previously identified groups to share what happens to the volume when you double \(s\). Display the graph and equation for all to see and have students point out where they see the effect of doubling \(s\) in the graph (by looking at any two edge lengths that are double each other, their volume will be double also). Ask students:
- “Which of your variables is the independent? The dependent?” (The side length, \(s\), is the independent variable, and volume, \(V\), is dependent variable.)
- “Which variable is a function of which?” (Volume is a function of side length.)
If it has not been brought up in students’ explanations, ask what the volume equation looks like when we double the edge length \(s\). Display volume equation \(V=15(2s)\) for all to see. Ask, “How can we write this equation to show that the volume doubled when \(s\) doubled?” (Using algebra, we can rewrite \(V=15(2s)\) as \(V=2(15s)\). Since the volume for \(s\) was \(15s\), this shows that the volume for \(2s\) is twice the volume for \(s\)).
Design Principle(s): Optimize output (for explanation)
17.3: Halve the Height (10 minutes)
Optional activity
This activity is optional. This activity is similar to the previous (optional) one from a function point of view, but now students investigate the volume of a cylinder instead of a rectangular prism. Students continue working with functions to investigate what happens to the volume of a cylinder when you halve the height. The exploration and representations resemble what was done in the previous activity, and students continue to identify the effect of the changing dimension on the graph and the equation of this function. As groups work on the task, identify those who make the connection between the graph and equation representations, and encourage groups to look for similarities and differences between what they see in this activity and what they saw in the previous activity. Invite these groups to share during the whole-class discussion.
Launch
Keep students in the same groups. Tell students that this activity is similar to the previous one, but they will work with a cylinder instead of a rectangular prism. Give students 2–3 minutes of quiet work time followed by time to discuss the last question with their partner. Follow with a whole-class discussion.
Students using the digital activity can graph their equations using the applet.
Student Facing
There are many cylinders with radius 5 units. Let \(h\) represent the height and \(V\) represent the volume of these cylinders.
-
Write an equation that represents the relationship between \(V\) and \(h\). Use 3.14 as an approximation of \(\pi\).
-
Graph this equation.
- What happens to the volume if you halve the height, \(h\)? Where can you see this in the graph? How can you see it algebraically?
Student Response
For access, consult one of our IM Certified Partners.
Launch
Keep students in the same groups. Tell students that this activity is similar to the previous one, but they will work with a cylinder instead of a rectangular prism. Give students 2–3 minutes of quiet work time followed by time to discuss the last question with their partner. Follow with a whole-class discussion.
Students using the digital activity can graph their equations using the applet.
Student Facing
There are many cylinders with radius 5 units. Let \(h\) represent the height and \(V\) represent the volume of these cylinders.
- Write an equation that represents the relationship between \(V\) and \(h\). Use 3.14 as an approximation of \(\pi\).
- Graph this equation and label the axes.
- What happens to the volume if you halve the height, \(h\)? Where can you see this in the graph? How can you see it algebraically?
Student Response
For access, consult one of our IM Certified Partners.
Student Facing
Are you ready for more?
Suppose we have a rectangular prism with dimensions 2 units by 3 units by 6 units, and we would like to make a rectangular prism of volume 216 cubic units by stretching one of the three dimensions.
- What are the three ways of doing this? Of these, which gives the prism with the smallest surface area?
- Repeat this process for a starting rectangular prism with dimensions 2 units by 6 units by 6 units.
- Can you give some general tips to someone who wants to make a box with a certain volume, but wants to save cost on material by having as small a surface area as possible?
Student Response
For access, consult one of our IM Certified Partners.
Activity Synthesis
Ask previously identified groups to share their graphs and equations.
If students completed the optional activity, display student graphs from both activities and ask:
- “Compare the graph in this activity to the graph in the last activity. How are they alike? How are they different?”
- “Compare the equation in this activity to the equation in the last activity. How are they alike? How are they different?”
- “How can you tell that this is a linear relationship?”
For the last question, make sure students understand that “looks like a line” is insufficient evidence for saying a relationship is linear since the scale of the axes can make non-linear graphs look linear. It is important students connect that the equation is linear (of the form y=mx+b) or relate back to the relationship between the height and volume: that the volume is \(25\pi\), or about 78.5, times the height.
If students did not complete the optional activity, ask:
- “Which of your variables is the independent? The dependent?” (The height, \(h\), is the independent variable, and volume, V, is dependent variable.)
- “Which variable is a function of which?” (Volume is a function of height.)
- “How can you tell that this is a linear relationship?”
See notes above on the last question in this list. If it has not been brought up in students’ explanations, ask what the volume equation looks like when we double the height \(h\). Display volume equation \(V=78.5(2h)\) for all to see. Ask how we can write this equation to show that the volume doubled when \(h\) doubled (using algebra, we can rewrite \(V=78.5(2h)\) as \(V=2(78.5h)\). Since the volume for \(h\) was \(78.5h\), this shows that the volume for \(2h\) is twice the volume for \(h\)).
Design Principle(s): Optimize output; Maximize meta-awareness
17.4: Figuring Out Cone Dimensions (10 minutes)
Optional activity
This activity is optional. The purpose of this activity is for students to use representations of functions to explore more about the volume of a cone. This activity differs from the previous ones because students are given a graph that shows the relationship between the volume of a cone and the height of a cone. They use the graph to reason about the coordinates and their meaning. Students use the equation for the volume of a cone and coordinates from the graph to determine the radius of this cone and discuss the answer to this last question with their partners. Identify students to share their strategies during the discussion.
Launch
Arrange students in groups of 2. Give students 2–3 minutes of quiet work time followed by time to discuss the answer and their strategies for the last question with their partner. Follow with a whole-class discussion.
Supports accessibility for: Visual-spatial processing
Design Principle(s): Maximize meta-awareness; Support sense-making
Student Facing
Here is a graph of the relationship between the height and the volume of some cones that all have the same radius:
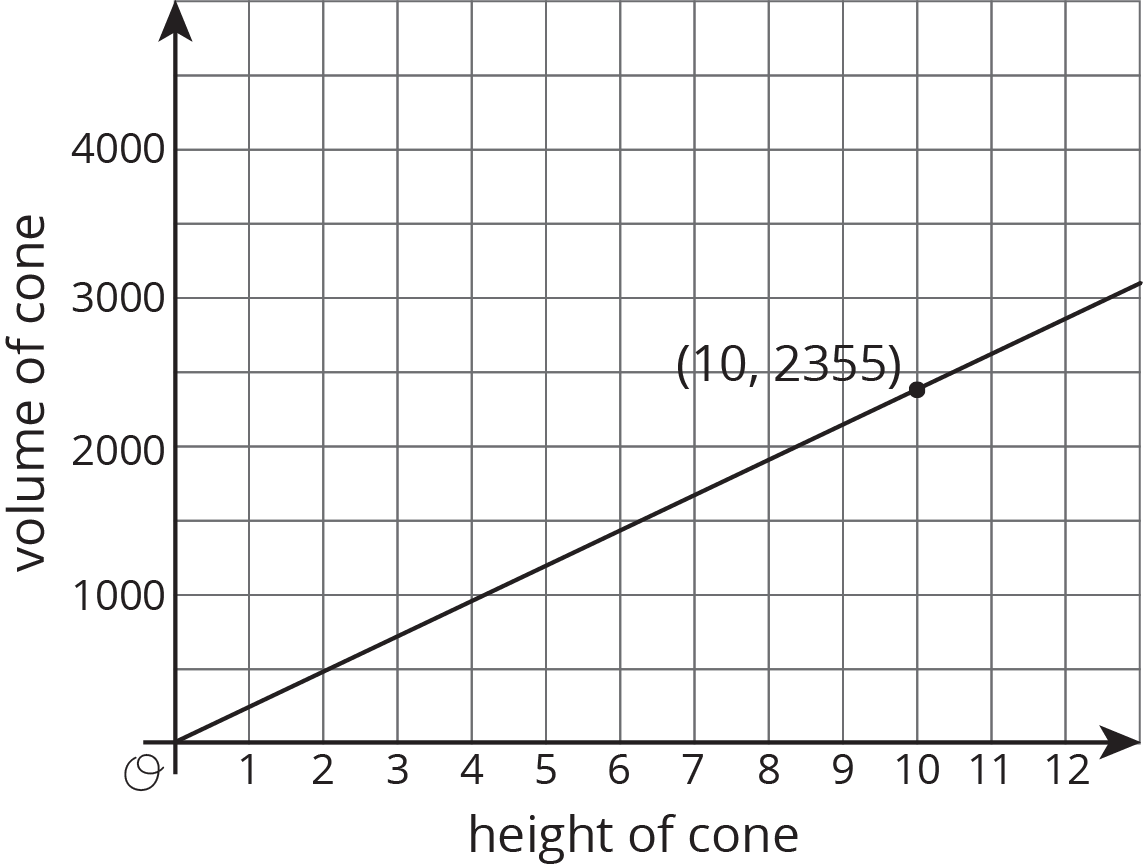
- What do the coordinates of the labeled point represent?
- What is the volume of the cone with height 5? With height 30?
- Use the labeled point to find the radius of these cones. Use 3.14 as an approximation for \(\pi\).
- Write an equation that relates the volume \(V\) and height \(h\).
Student Response
For access, consult one of our IM Certified Partners.
Anticipated Misconceptions
Students may round \(\pi\) at different points during their work, leading to slightly different answers.
Students can solve the equation \(2,355=\frac13 \pi r^2 10\) with different series of steps. If they choose to first multiply the numbers on the side with \(r\), they may round the expression \(\frac13 \pi r^2 10\) to \(10.47 r^2\). This would give \(224.9=r^2\), making \(r\) slightly less than 15, though it rounds to 15. Solving by multiplying each side by \(3\boldcdot \frac{1}{\pi}\boldcdot \frac{1}{10}\) yields \(r^2=225\), making \(r\) equal 15 exactly (if we accept 3.14 as the value of \(\pi\)). This is an opportunity to discuss how rounding along the way in a solution can introduce imprecision.
Activity Synthesis
Ask previously identified students to share their answers and their strategies for finding the radius in the last question.
To further the discussion, consider asking some of the following questions:
- “How did you deal with the \(\frac13\) in the equation?”
- “How did you deal with \(\pi\) when you were trying to solve for the radius?”
- “How do you know that the relationship between volume and height for these cones is a function? How is this shown in the graph? In the equation?”
- “Identify the independent and dependent variables in this relationship. If they were switched, would we still have a function? Explain how you know.”
Lesson Synthesis
Lesson Synthesis
Tell students to imagine a cylindrical water tank with a radius \(r\) units and a height \(h\) units. Display the following prompts and ask students to respond to them in writing, encouraging them to include sketches:
- “How can you change a dimension of the water tank so that the volume of the tank increases by a factor of 2?”
- “How can you change a dimension of the water tank so that the volume of the tank increases by a factor of \(a\)?”
After quiet work time, invite students to share their responses. If students made a sketch, display them for all to see.
17.5: Cool-down - A Missing Radius (5 minutes)
Cool-Down
For access, consult one of our IM Certified Partners.
Student Lesson Summary
Student Facing
Imagine a cylinder with a radius of 5 cm that is being filled with water. As the height of the water increases, the volume of water increases.
We say that the volume of the water in the cylinder, \(V\), depends on the height of the water \(h\). We can represent this relationship with an equation: \(V= \pi \boldcdot 5^2h\) or just
\(\displaystyle V = 25\pi h\)
This equation represents a proportional relationship between the height and the volume. We can use this equation to understand how the volume changes when the height is tripled.
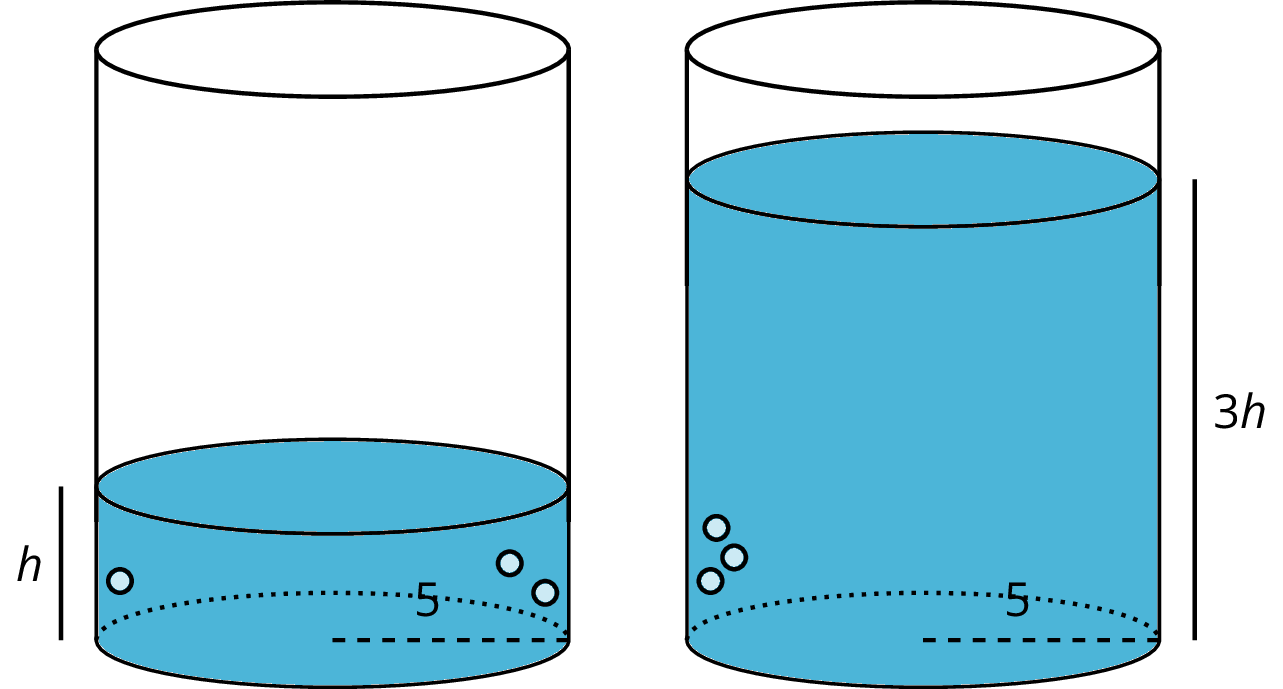
The new volume would be \(V = 25 \pi (3h) = 75 \pi h\), which is precisely 3 times as much as the old volume of \(25\pi h\). In general, when one quantity in a proportional relationship changes by a given factor, the other quantity changes by the same factor.
Remember that proportional relationships are examples of linear relationships, which can also be thought of as functions. So in this example \(V\), the volume of water in the cylinder, is a function of the height \(h\) of the water.