Lesson 22
Volume As a Function of . . .
22.1: Missing Information? (5 minutes)
Warm-up
In this warm-up, students reason about the volume and dimensions of a cylinder based on information given about a sphere of the same height. The purpose of this warm-up is for students to recognize when they do not have enough information to reach a single answer. While they can determine the height of the cylinder, the radius is completely undefined, which means the volume of the cylinder could be anything.
Launch
Give students quiet work time followed by a whole-class discussion.
Student Facing
A cylinder and sphere have the same height.
- If the sphere has a volume of \(36\pi\) cubic units, what is the height of the cylinder?
- What is a possible volume for the cylinder? Be prepared to explain your reasoning.
Student Response
For access, consult one of our IM Certified Partners.
Anticipated Misconceptions
Some students may not understand why the second problem talks about “possible” volumes if they assume the radius of the cylinder is the same as the sphere. Ask these students to explain how they found the radius of the cylinder to help them notice that the problem never gives that information.
Activity Synthesis
Ask students to share how they calculated the height of the cylinder. If any students made a sketch, display these for all to see.
Select at least 5 students to give a possible volume for the cylinder and record these for all to see. Ask students,
- “Why do we not know what the volume of the cylinder is?” (We don’t know the radius, only the height, so the volume could be anything.)
- “Is knowing the height of a sphere enough information to determine the volume?” (Yes. The volume of a sphere is based on the radius, which is half the height.)
Tell students that in the next activity, they will investigate how changes to the radius of a sphere changes the volume of the sphere.
22.2: Scaling Volume of a Sphere (15 minutes)
Optional activity
Building on work in previous lessons where students investigated how changing one or two dimensions affects the volume of a shape, in this activity, students scale the radius of a sphere and compare the resulting volumes. They will predict how doubling or halving the radius of a sphere affects the volume.
Identify students using different reasoning to answer the last question. For example, some students may calculate the radius of the larger sphere in order to find \(\frac15\) of that value to get to the volume of the smaller sphere while others may reason about the volume formula and how volume changes when the radius goes from \(r\) to \(\frac15r\).
Launch
Arrange students in groups of 2. Give 2–3 minutes of quiet work time to complete the first problem on their own, then time to discuss their solutions with a partner. Groups then finish the remaining problems together followed by a whole-group discussion.
Supports accessibility for: Language; Organization
Design Principle(s): Optimize output (for explanation)
Student Facing
- Fill in the missing volumes in terms of \(\pi\). Add two more radius and volume pairs of your choosing.
radius 1 2 3 \(\frac12\) \(\frac13\) 100 r volume \(\frac43 \pi\) - How does the volume of a sphere with radius 2 cm compare to the volume of a sphere with radius 1 cm?
- How does the volume of a sphere with radius \(\frac12\) cm compare to the volume of a sphere with radius 1 cm?
- How does the volume of a sphere with radius 2 cm compare to the volume of a sphere with radius 1 cm?
- A sphere has a radius of length \(r\).
- What happens to the volume of this sphere if its radius is doubled?
- What happens to the volume of this sphere if its radius is halved?
- What happens to the volume of this sphere if its radius is doubled?
- Sphere Q has a volume of 500 cm3. Sphere S has a radius \(\frac15\) as large as Sphere Q. What is the volume of Sphere S?
Student Response
For access, consult one of our IM Certified Partners.
Anticipated Misconceptions
Students may not correctly use exponent rules for \((2r)^3\). Students also may need to be reminded of exponent rules for fractions.
Activity Synthesis
Display the completed table for all to see, and invite groups to share a pair they added to the table along with their responses to the first two problems.
Select previously identified students to share their responses to the last question. If students did not reason about the question using the formula for volume of a sphere (that is, by reasoning that if the radius is \(\frac15\) as large then \(v=\frac43 \pi \left(\frac15 r\right)^3=\frac{1}{125} \left(\frac43 \pi r^3\right)\)), ask students to consider their responses to the second part of the second question, but replace \(\frac12\) with \(\frac15\).
22.3: A Cylinder, a Cone, and a Sphere (25 minutes)
Optional activity
The purpose of this activity is for students to bring together several ideas they have been working with. In particular: calculating volume and dimensions of round objects, comparing functions represented in different ways, interpreting the slope of a graph in context, reasoning about specific function values, and reasoning about when functions have the same value.
While students are only instructed to add a graph of the cylinder to the given axes, watch for students who plot the values for the sphere as well and ask to share their graphs during the Activity Synthesis.
Launch
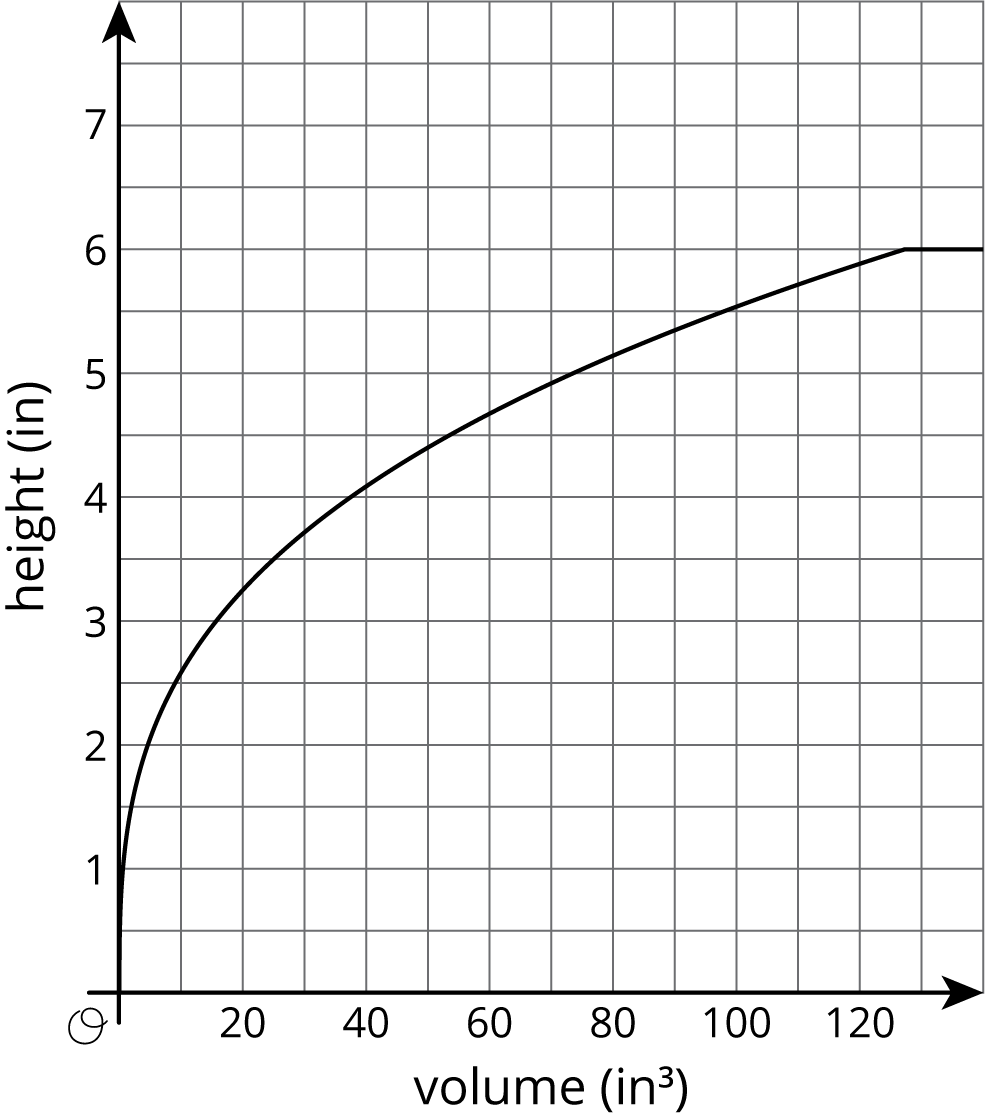
Tell students to close their books or devices and display the graph in the activity for all to see. Tell students that the graph represents water filling a container.
Tell students that their job is to think of at least one thing they notice and at least one thing they wonder. Ask students to give a signal when they have noticed or wondered about something. Give students 1 minute of quiet think time, and then 1 minute to discuss the things they notice with their partner. Possible responses:
Things students may Notice:
- The graph is not a linear function.
- The graph is a piecewise function.
- The maximum height of the function is 6 inches.
Things students may Wonder:
- What is the shape of the container?
- What is happening when the height stops at 6 inches?
- Why does the volume increase but the height stay constant on the far right?
Discuss possible responses for questions that students wondered. If not suggested by students, ask what would happen if you kept pouring water into a container even though the water level had reached the top. Ensure students understand that the height stops at 6 inches because that is how tall the container is. Any more water poured into the container at that point just overflows.
Arrange students in groups of 2–3. Provide access to straightedges. Give groups work time followed by a whole-class discussion.
Supports accessibility for: Organization; Attention
Student Facing
Three containers of the same height were filled with water at the same rate. One container is a cylinder, one is a cone, and one is a sphere. As they were filled, the relationship between the volume of water and the height of the water was recorded in different ways, shown here:
- Cylinder: \(h=\frac{V}{4\pi}\)
- Cone:
- Sphere:
volume (in3) height (in) 0 0 8.38 1 29.32 2 56.55 3 83.76 4 104.72 5 113.04 6 120 6 200 6
- The maximum volume of water the cylinder can hold is \(24\pi\). What is the radius of the cylinder?
-
Graph the relationship between the volume of water poured into the cylinder and the height of water in the cylinder on the same axes as the cone. What does the slope of this line represent?
- Which container can fit the largest volume of water? The smallest?
- About how much water does it take for the cylinder and the sphere to have the same height? The cylinder and the cone? Explain how you know.
- For what approximate range of volumes is the height of the water in the cylinder greater than the height of the water in the cone? Explain how you know.
- For what approximate range of volumes is the height of the water in the sphere less than the height of the water in the cylinder? Explain how you know.
Student Response
For access, consult one of our IM Certified Partners.
Anticipated Misconceptions
Watch for students struggling to compare in different representations and suggest graphing the points in the table.
For the fourth question, if students calculate volume of water when the height is 6 inches for each shape, direct them to determine whether there is a time when any of the containers have the same height and the same volume of water. (Another way to think of this is an intersection in the graph.)
Activity Synthesis
Select previously identified students who graphed the data from the table in order to complete the problems. Display one or two of these representations for all to see.
Consider asking the following questions:
- “If I showed you this graph without telling you which function represented each shape, how could you figure out which one represents the cone, the cylinder, and the sphere?” (The graph of the cylinder must be linear, since the shape of the container as the water level rises never changes. The graph of the cone would first fill quickly, but then fill more slowly as it got wider near the top. (Note: it helps to know the cone is tip down here.) The graph of the sphere would change partway through, since it would start fast, slow down toward the middle where the sphere is widest, then speed up again as the sphere narrows, and the table data, or discrete points, is the only representation that does that.)
- “Can you use the information provided about each function to determine the radius of the sphere and cone?” (The radius of the sphere is half the height, so the radius is 3 in. The cone has a volume of 127.23 in3, so we can tell that \(r^2\) is about 20.25. We can use guess-and-check to find \(r\), since 20.25 is between 16 and 25. We can check what happens when \(r=4.5\), which does give a value of 20.25 for \(r^2\). So the radius of the cone is about 4.5 in.)
- “For each of these graphs, is volume a function of height?” (No, when the height reaches 6 inches, the extra water spills out, so the volume keeps increasing. Therefore, if height is the input, there are multiple outputs of volume for each graph.)
- “What could we change in order to make volume a function of height for this scenario?” (If we stopped pouring when height was 6 inches, there would not be multiple volumes for one height.)
Design Principle(s): Support sense-making; Optimize output (for justification)