Lesson 11
Filling Containers
11.1: Which One Doesn’t Belong: Solids (5 minutes)
Warm-up
The purpose of this warm-up is for students to compare different objects that may not be familiar and think about how they are similar and different from objects they have encountered in previous activities and grade levels. To allow all students to access the activity, each object has one obvious reason it does not belong. Encourage students to move past the obvious reasons (e.g., Figure A has a point on top) and find reasons based on geometrical properties (e.g., Figure D when looked at from every side is a rectangle). During the discussion, listen for important ideas and terminology that will be helpful in upcoming work of the unit.
Launch
Arrange students in groups of 2. Display the image for all to see. Ask students to indicate when they have noticed one object that does not belong and can explain why. Give students 2 minutes of quiet think time and then time to share their thinking with their partner.
Student Facing
These are drawings of three-dimensional objects. Which one doesn’t belong? Explain your reasoning.

Student Response
For access, consult one of our IM Certified Partners.
Activity Synthesis
Ask students to share one reason why a particular object might not belong. Record and display the responses for all to see. After each response, ask the rest of the class if they agree or disagree. Since there is no single correct answer to the question of which one does not belong, attend to students’ explanations and ensure the reasons given are correct. During the discussion, prompt students to explain the meaning of any terminology they use, such as diameter, radius, vertex, edge, face, or specific names of the figures: sphere, cylinder, cone, rectangular prism.
11.2: Height and Volume (20 minutes)
Activity
In this activity, students investigate how the height of water in a graduated cylinder is a function of the volume of water in the graduated cylinder. Students make predictions about how the graph will look and then test their prediction by filling the graduated cylinder with different amounts of water, gathering and graphing the data (MP4).
Launch
Arrange students in groups of 3–4. Be sure students know how to measure using a graduated cylinder. If needed, display a graduated cylinder filled to a specific measurement for all to see and demonstrate to students how to read the measurement. Give each group access to a graduated cylinder and water.
Give groups 8–10 minutes to work on the task, follow with a whole-class discussion.
For classrooms with access to the digital materials or those with no access to graduated cylinders, an applet is included here. Physical measurement tools and an active lab experience are preferred.
Design Principle(s): Support sense-making; Optimize output for (explanation)
Student Facing
Use the applet to investigate the height of water in the cylinder as a function of the water volume.
-
Before you get started, make a prediction about the shape of the graph.
-
Check Reset and set the radius and height of the graduated cylinder to values you choose.
-
Let the cylinder fill with different amounts of water and record the data in the table.
- Create a graph that shows the height of the water in the cylinder as a function of the water volume.
- Choose a point on the graph and explain its meaning in the context of the situation.
Student Response
For access, consult one of our IM Certified Partners.
Launch
Arrange students in groups of 3–4. Be sure students know how to measure using a graduated cylinder. If needed, display a graduated cylinder filled to a specific measurement for all to see and demonstrate to students how to read the measurement. Give each group access to a graduated cylinder and water.
Give groups 8–10 minutes to work on the task, follow with a whole-class discussion.
For classrooms with access to the digital materials or those with no access to graduated cylinders, an applet is included here. Physical measurement tools and an active lab experience are preferred.
Design Principle(s): Support sense-making; Optimize output for (explanation)
Student Facing
Your teacher will give you a graduated cylinder, water, and some other supplies. Your group will use these supplies to investigate the height of water in the cylinder as a function of the water volume.
- Before you get started, make a prediction about the shape of the graph.
- Fill the cylinder with different amounts of water and record the data in the table.
volume (ml) height (cm) - Create a graph that shows the height of the water in the cylinder as a function of the water volume.

- Choose a point on the graph and explain its meaning in the context of the situation.
Student Response
For access, consult one of our IM Certified Partners.
Activity Synthesis
Select groups to share the graph for the third question and display it for all to see. Consider asking students the following questions:
- “What do you notice about the shape of your graph?”
- “What is the independent variable of your graph? Dependent variable?”
- “How does this graph differ from what you predicted the shape would be?”
- “For the last question, what point did you choose, and what does that point mean in the context of this activity?”
- “What would the endpoint of the graph be?” (There is a maximum possible volume for the cylinder. Once it’s filled, any extra water will spill out and not raise the water height.)
11.3: What Is the Shape? (10 minutes)
Activity
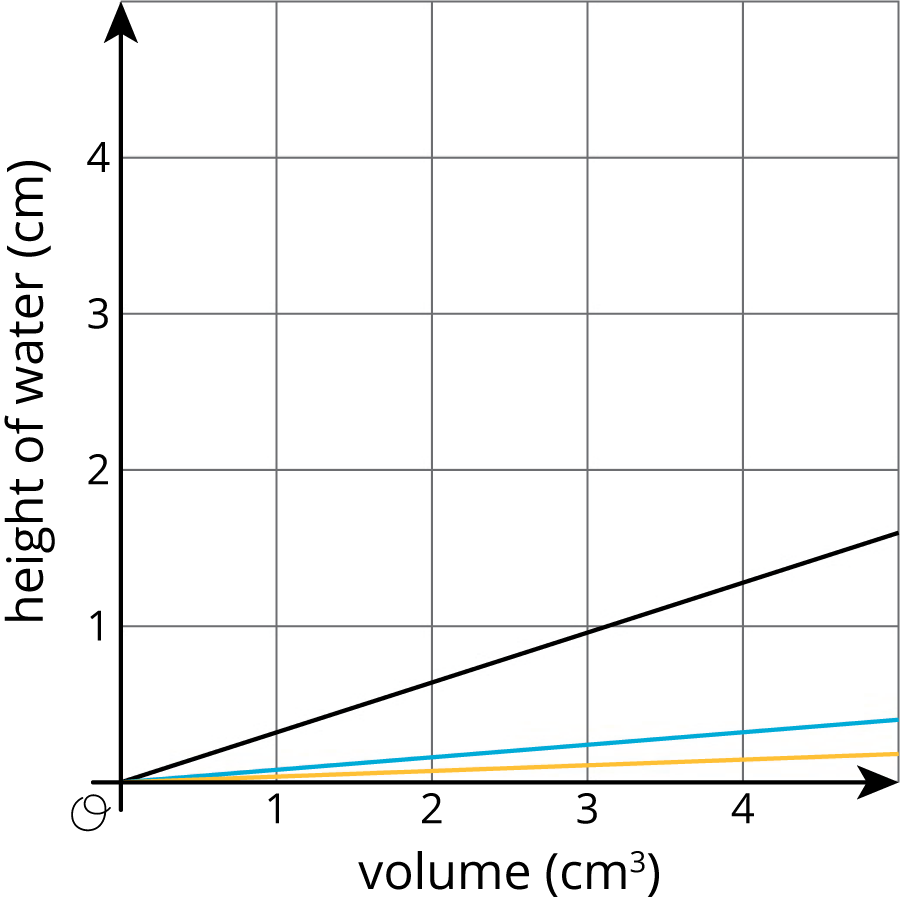
In the previous activity, students were given a container and asked to draw the graph of the height as a function of the volume. In this activity, students are given the graph and asked to draw a sketch of the container that could have generated that height function. Since students have worked on the two previous activities, they have an idea of what the data for a graduated cylinder and a graduated cylinder with twice the diameter looks like and can use that information to compare to while working on this task.
Launch
Arrange students in groups of 2. Give students 3–5 minutes of quiet work time and then time to share their drawings with their partner. Follow with a whole-class discussion.
If time is short, consider having half of the class work on the first question and the other half work on the second question and then complete the last question as part of the Activity Synthesis.
Supports accessibility for: Conceptual processing
Design Principle(s): Optimize output (for explanation)
Student Facing
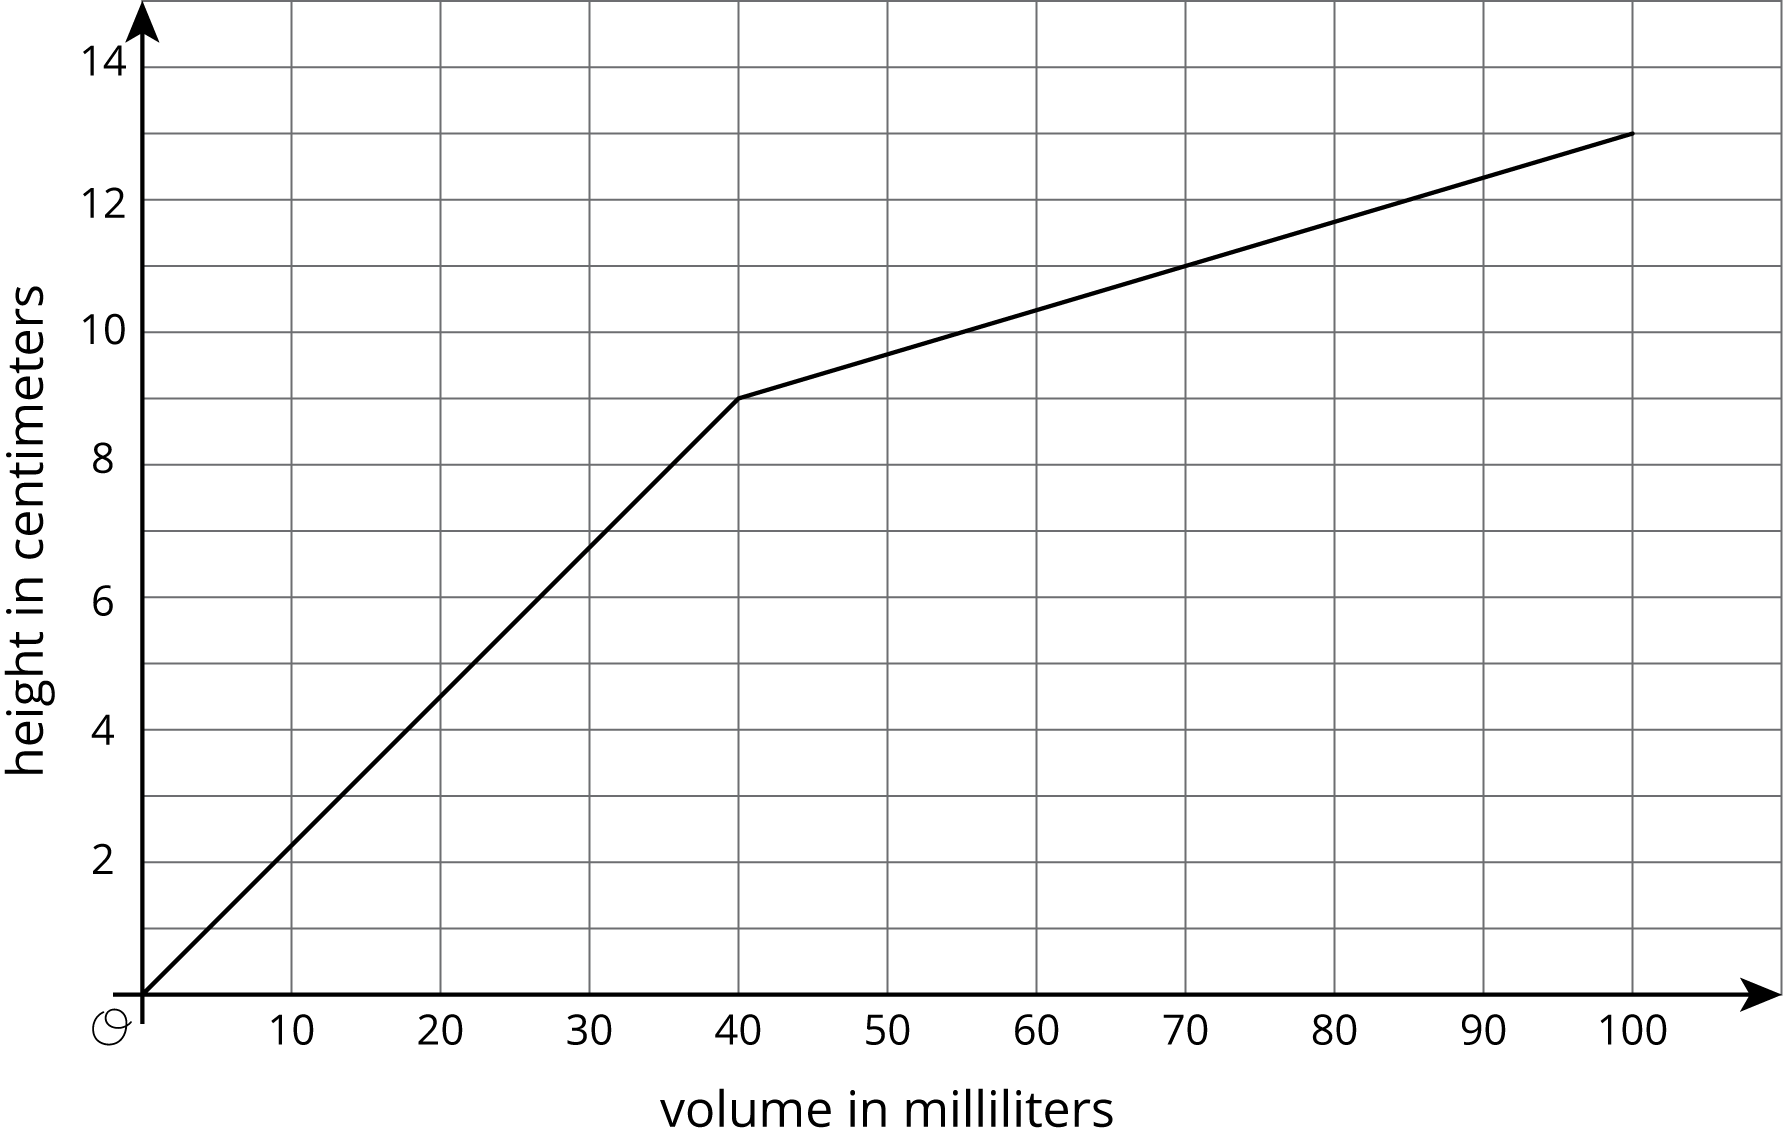
- The graph shows the height vs. volume function of an unknown container. What shape could this container have? Explain how you know and draw a possible container.
- The graph shows the height vs. volume function of a different unknown container. What shape could this container have? Explain how you know and draw a possible container.
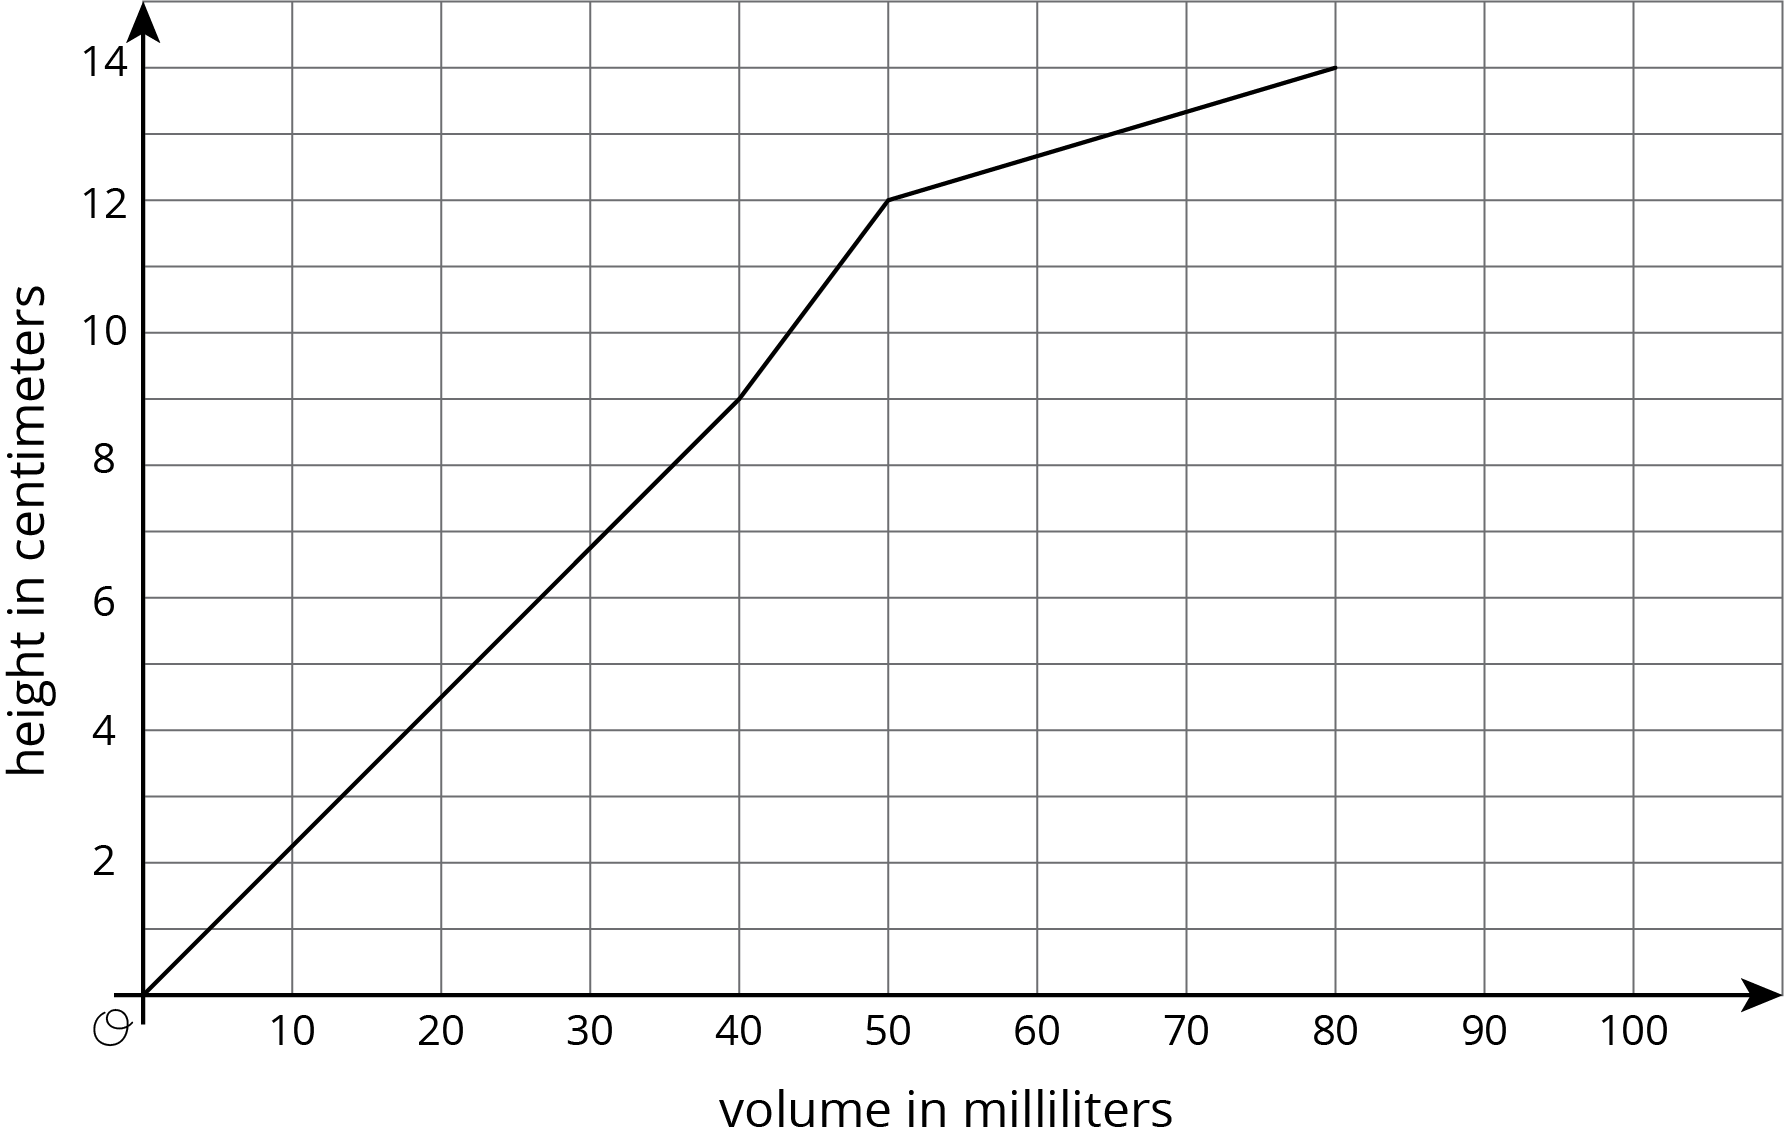
- How are the two containers similar? How are they different?
Student Response
For access, consult one of our IM Certified Partners.
Student Facing
Are you ready for more?
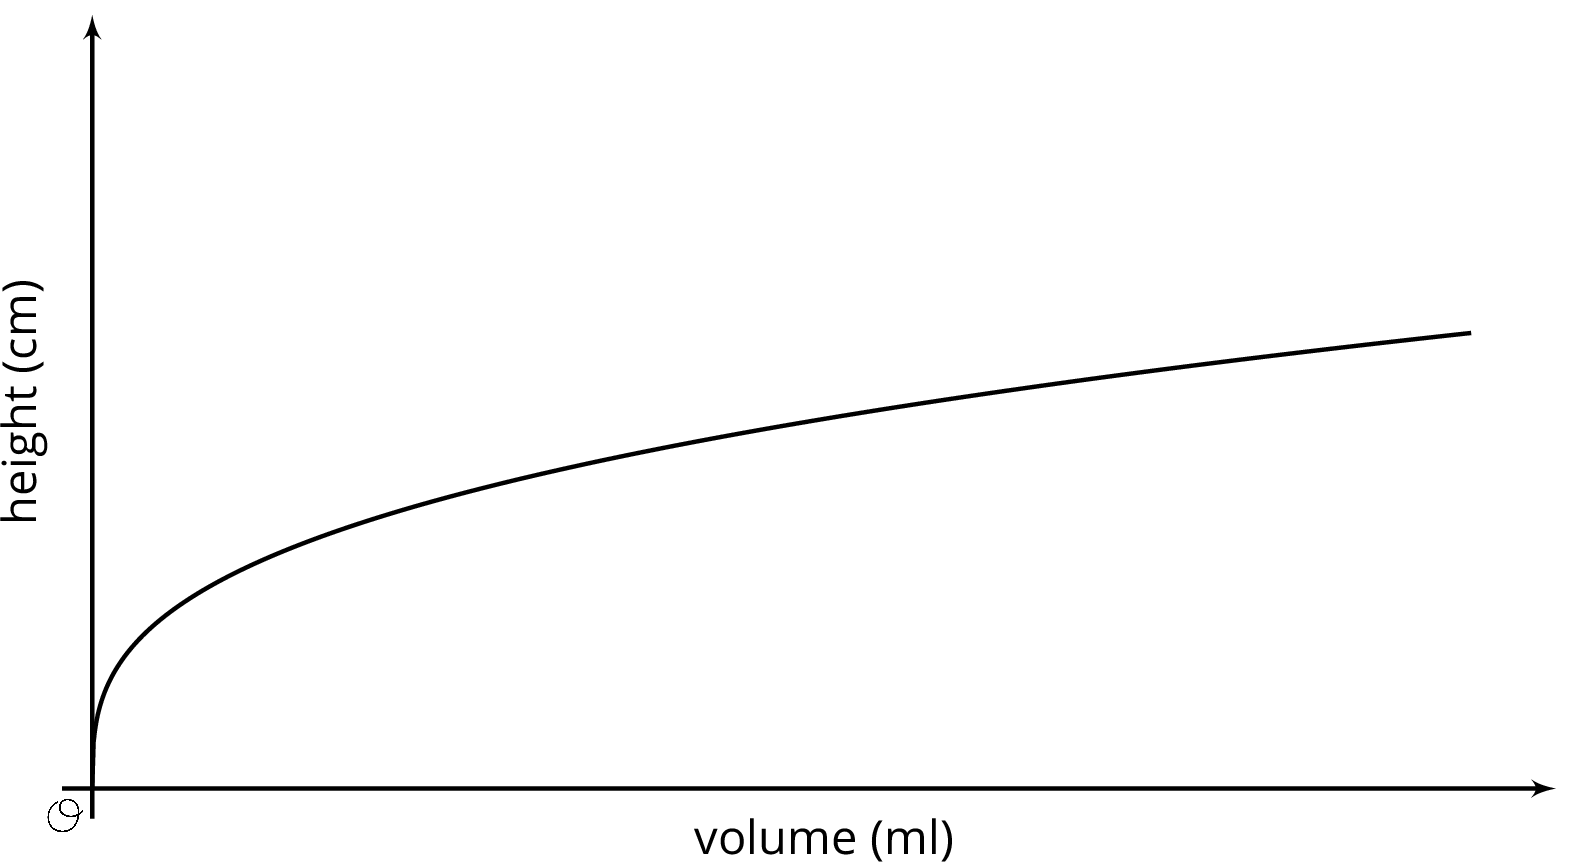
The graph shows the height vs. volume function of an unknown container. What shape could this container have? Explain how you know and draw a possible container.
Student Response
For access, consult one of our IM Certified Partners.
Activity Synthesis
Select students to share the different containers they drew. Display their drawings and the graph for all to see. Ask students to explain how they came up with their drawing and refer to parts in the graph that determined the shape of their container.
Lesson Synthesis
Lesson Synthesis
Have students make their own graph showing the height and volume of a container. Tell students to use 2–5 lines for their container. Once the graphs are made, have students swap with a partner and try to draw the shape of their partner’s container. Ask a few groups to share their graphs and container drawings.
11.4: Cool-down - Which Cylinder? (5 minutes)
Cool-Down
For access, consult one of our IM Certified Partners.
Student Lesson Summary
Student Facing
When filling a shape like a cylinder with water, we can see how the dimensions of the cylinder affect things like the changing height of the water. For example, let's say we have two cylinders, \(D\) and \(E\), with the same height, but \(D\) has a radius of 3 cm and \(E\) has a radius of 6 cm.
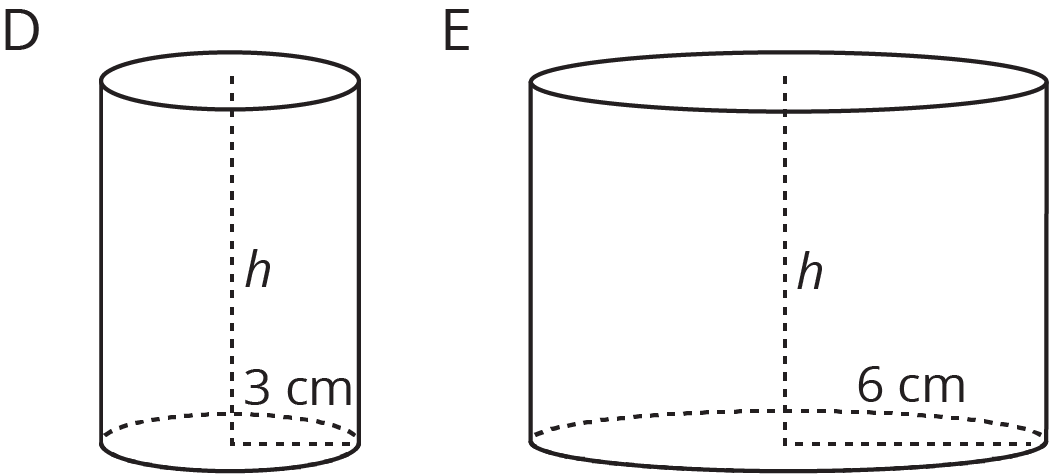
If we pour water into both cylinders at the same rate, the height of water in \(D\) will increase faster than the height of water in \(E\) due to its smaller radius. This means that if we made graphs of the height of water as a function of the volume of water for each cylinder, we would have two lines and the slope of the line for cylinder \(D\) would be greater than the slope of the line for cylinder \(E\).