Lesson 12
Using Graphs to Compare Relationships
Problem 1
The graphs below show some data from a coffee shop menu. One of the graphs shows cost (in dollars) vs. drink volume (in ounces), and one of the graphs shows calories vs. drink volume (in ounces).
__________________ vs volume
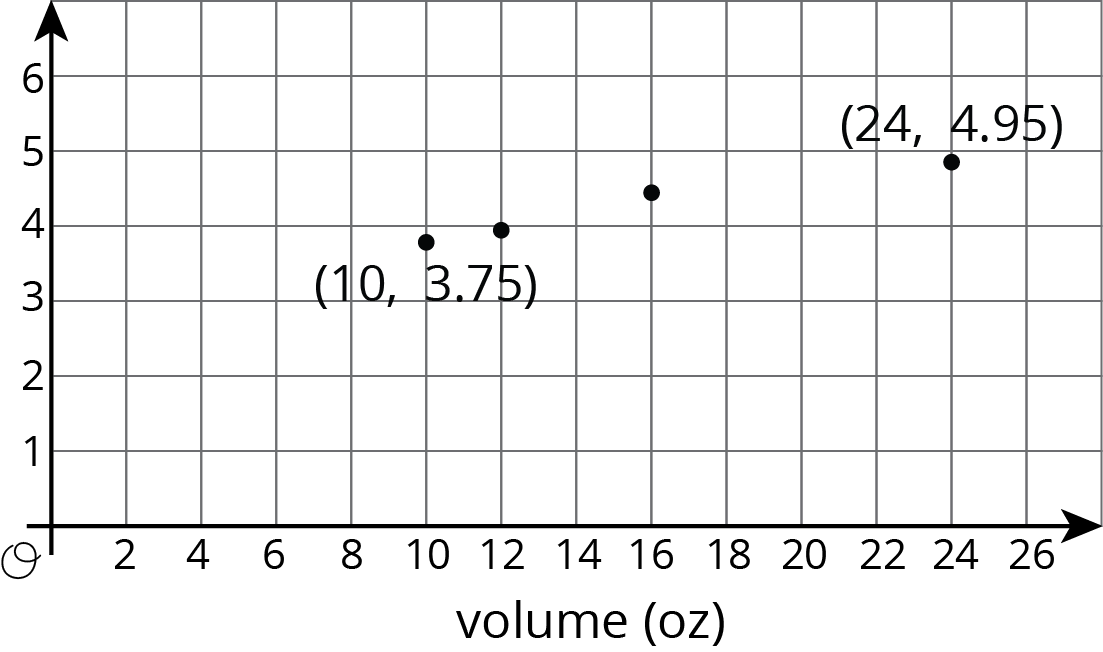
_____________________ vs volume
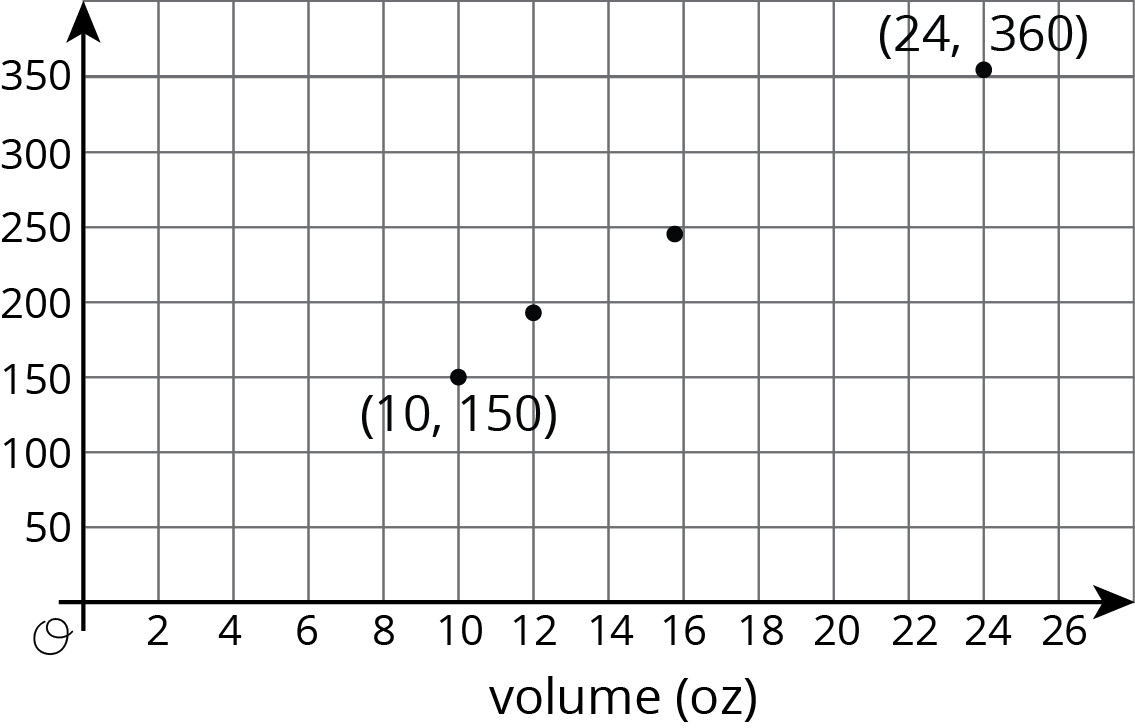
- Which graph is which? Give them the correct titles.
- Which quantities appear to be in a proportional relationship? Explain how you know.
- For the proportional relationship, find the constant of proportionality. What does that number mean?
Solution
For access, consult one of our IM Certified Partners.
Problem 2
Lin and Andre biked home from school at a steady pace. Lin biked 1.5 km and it took her 5 minutes. Andre biked 2 km and it took him 8 minutes.
- Draw a graph with two lines that represent the bike rides of Lin and Andre.
- For each line, highlight the point with coordinates \((1,k)\) and find \(k\).
- Who was biking faster?
Solution
For access, consult one of our IM Certified Partners.
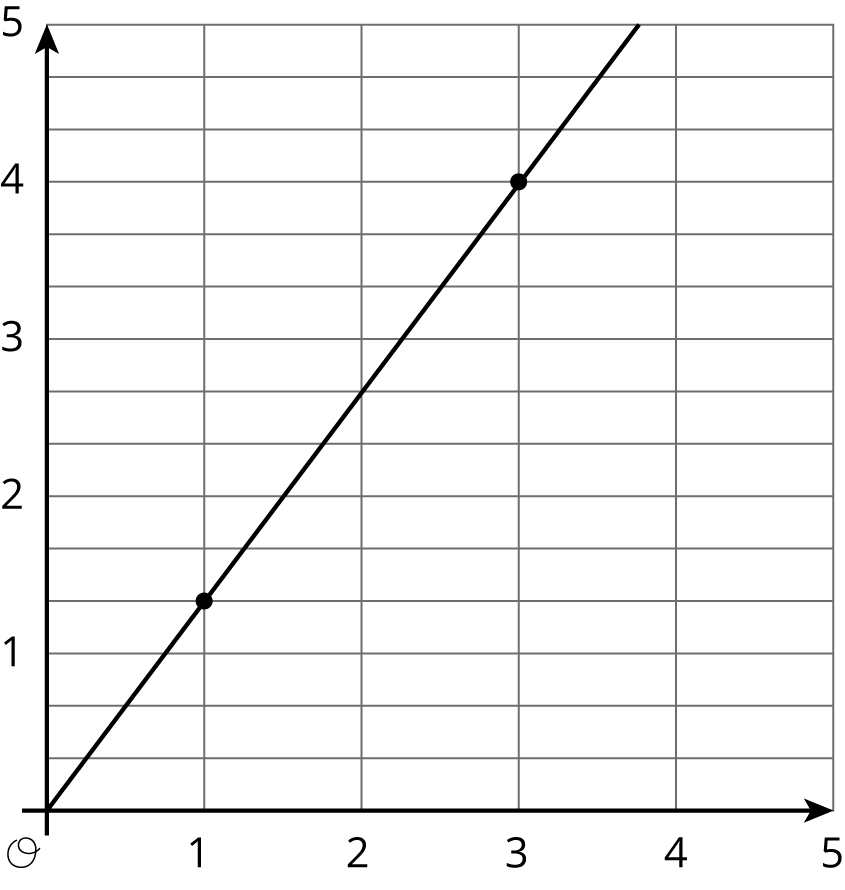
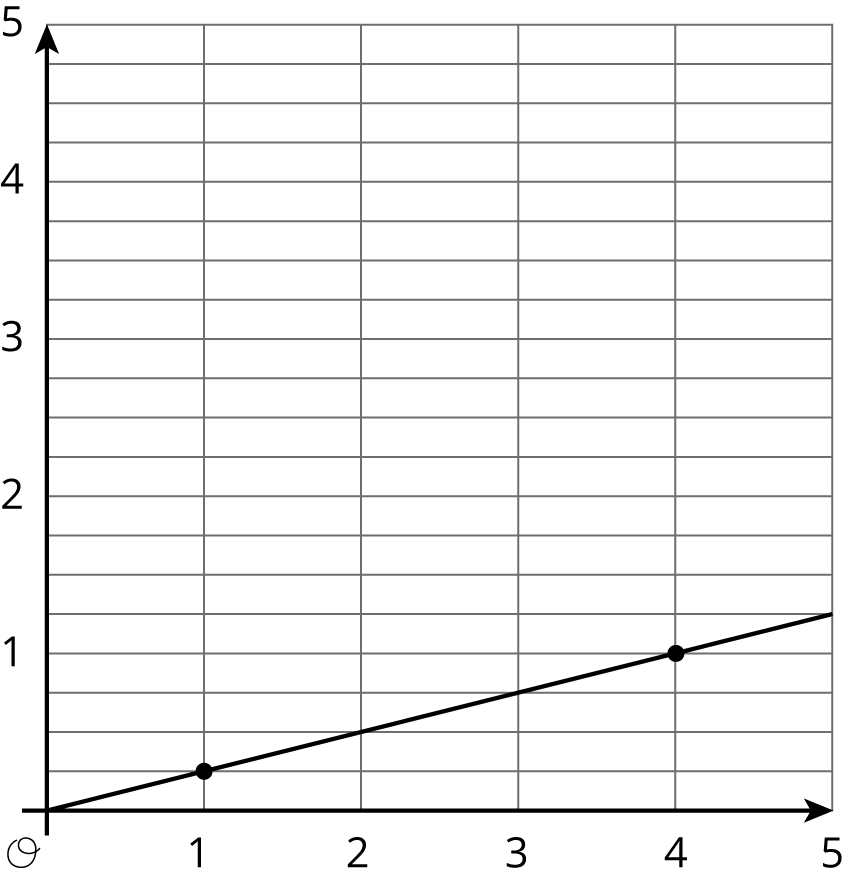
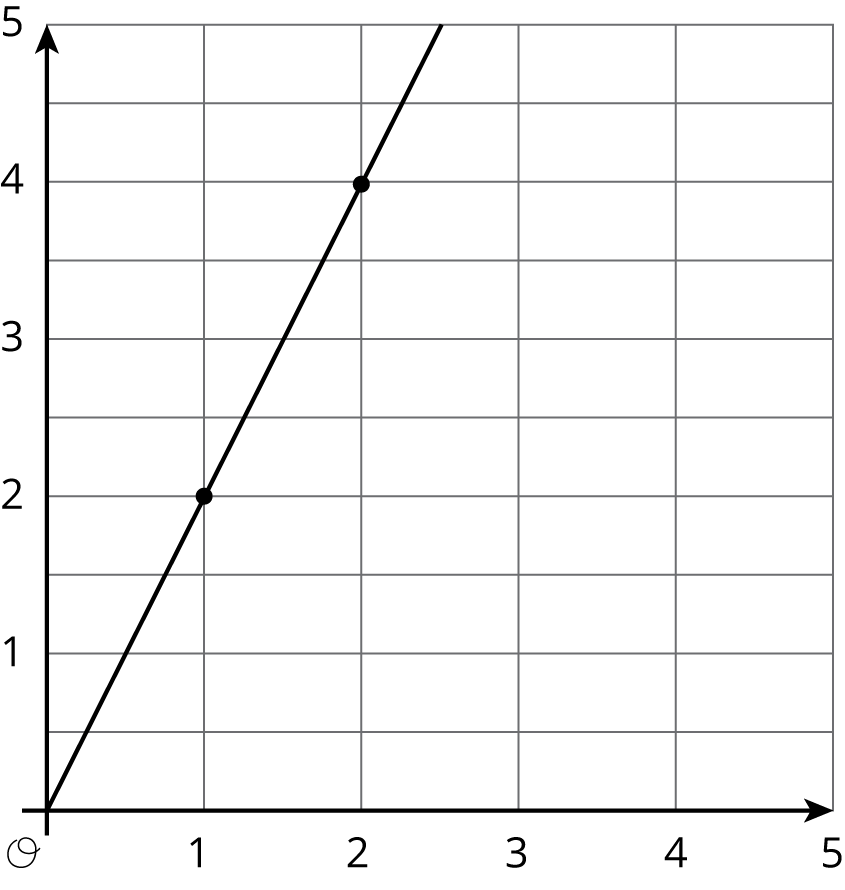
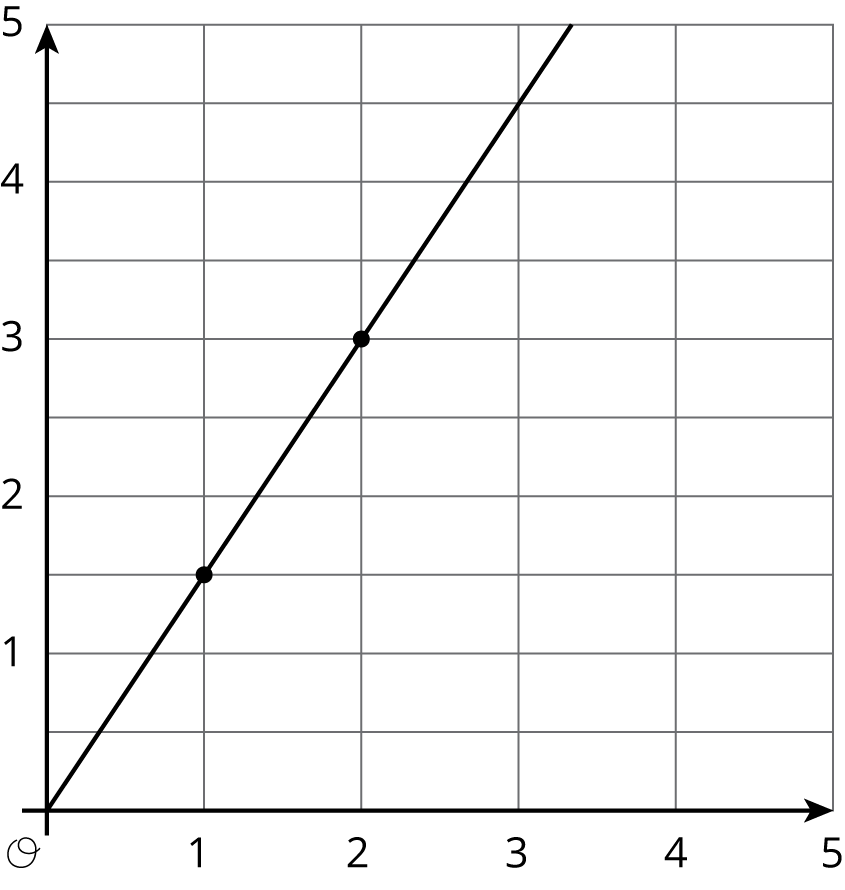
Problem 3
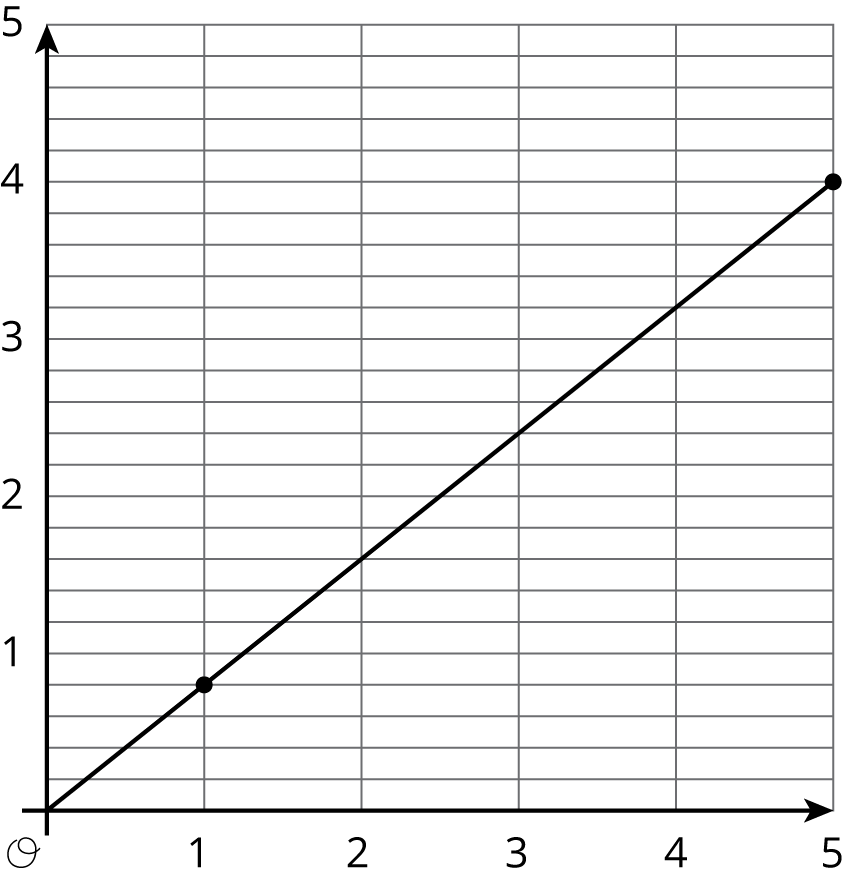
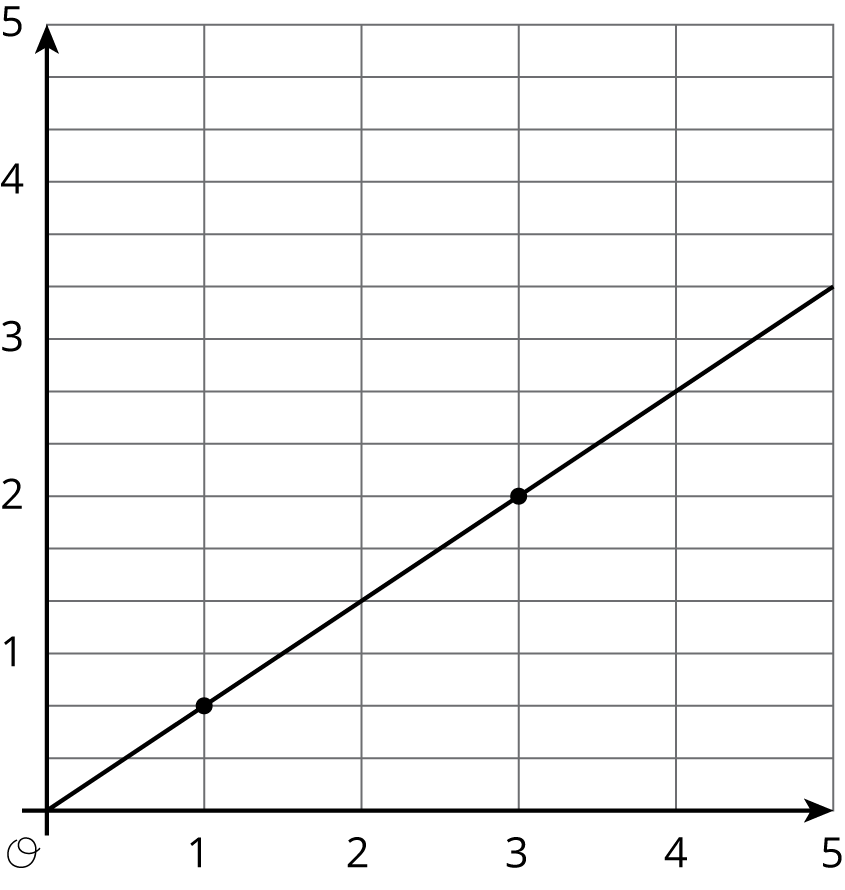
Match each equation to its graph.
- \(y = 2x\)
- \(y = \frac45 x\)
- \(y = \frac14 x\)
- \(y = \frac23 x\)
- \(y = \frac43 x\)
- \(y = \frac32 x\)
1
2
3
4
5
6
Solution
For access, consult one of our IM Certified Partners.