Lesson 10
Introducing Graphs of Proportional Relationships
10.1: Notice These Points (5 minutes)
Warm-up
This warm-up prepares students for graphing proportional relationships in the coordinate plane. They practice graphing coordinate points and notice that all points lie on a straight line.
Launch
Give students 3 minutes quiet work time followed by a whole-class discussion.
Student Facing
- Plot the points \((0,10), (1,8), (2,6), (3,4), (4,2)\).
- What do you notice about the graph?
Student Response
For access, consult one of our IM Certified Partners.
Launch
Give students 3 minutes quiet work time followed by a whole-class discussion.
Student Facing
- Plot the points \((0,10), (1,8), (2,6), (3,4), (4,2)\).
- What do you notice about the graph?
Student Response
For access, consult one of our IM Certified Partners.
Activity Synthesis
Invite students to share their observations. Ask if other students agree. If some students do not agree that the points lie on a straight line, ask which points break the pattern and give students a chance to self-correct their work.
10.2: T-shirts for Sale (10 minutes)
Activity
This introductory activity asks students to plot points using tables of values that represent scenarios familiar from previous lessons. This activity is intended as a review of the coordinate plane, its axes, and plotting ordered pairs.
Launch
Arrange students in groups of 2. Provide access to rulers. Give students 5 minutes of quiet work time followed by students discussing responses with a partner, followed by whole-class discussion.
The second question reviews work from grades 5 and 6, but it is important that students understand how to plot points in the coordinate plane. Display the graph for all to see. Show students how to plot the pair from the first row in the table in the coordinate plane. Ask students to plot the remaining pairs and check with nearby students as they work. Be on the lookout for students plotting coordinates in the wrong order.
Student Facing
Some T-shirts cost $8 each.
| \(x\) | \(y\) |
|---|---|
| 1 | 8 |
| 2 | 16 |
| 3 | 24 |
| 4 | 32 |
| 5 | 40 |
| 6 | 48 |
-
Use the table to answer these questions.
- What does \(x\) represent?
- What does \(y\) represent?
- Is there a proportional relationship between \(x\) and \(y\)?
-
Plot the pairs in the table on the coordinate plane.
-
What do you notice about the graph?
Student Response
For access, consult one of our IM Certified Partners.
Launch
Arrange students in groups of 2. Provide access to rulers. Give students 5 minutes of quiet work time followed by students discussing responses with a partner, followed by whole-class discussion.
The second question reviews work from grades 5 and 6, but it is important that students understand how to plot points in the coordinate plane. Display the graph for all to see. Show students how to plot the pair from the first row in the table in the coordinate plane. Ask students to plot the remaining pairs and check with nearby students as they work. Be on the lookout for students plotting coordinates in the wrong order.
Student Facing
Some T-shirts cost $8 each.
| \(x\) | \(y\) |
|---|---|
| 1 | 8 |
| 2 | 16 |
| 3 | 24 |
| 4 | 32 |
| 5 | 40 |
| 6 | 48 |
-
Use the table to answer these questions.
- What does \(x\) represent?
- What does \(y\) represent?
- Is there a proportional relationship between \(x\) and \(y\)?
- Plot the pairs in the table on the coordinate plane.
- What do you notice about the graph?
Student Response
For access, consult one of our IM Certified Partners.
Activity Synthesis
Discuss the first question if students had trouble with it.
Ask students to share their observations about the plotted points. Ask, “Could we buy 0 shirts? 7 T-shirts? 10 T-shirts? Can we buy half of a T-shirt?” Note that the graph consists of discrete points because only whole numbers of T-shirts make sense in this context; however, people often connect discrete points with a line to make the relationship more clear, even when the in-between values don’t make sense.
Ask the students, “Suppose instead of price per shirt, this graph displayed the cost of cherries that are \$8 per pound. Given that context, how should we change the graph?” Weights need not have integer values, so the graph is not restricted to discrete points. If you haven’t done so already, draw the ray starting at \((0,0)\) that passes through the points.
Design Principle(s): Support sense-making, Optimize output (for explanation)
10.3: Matching Tables and Graphs (25 minutes)
Activity
Students work in pairs to match tables to graphs and to practice articulating their reasoning (MP3). This task is intended to foster understanding of correspondences between tables and graphs.
Students sort the graphs and justify their sorting schemes. Then, they compare the way they sorted their graphs with a different group. The purpose of this activity is to illustrate the idea that the graph of a proportional relationships is a line through the origin. Students will not have the tools for a formal explanation until grade 8.
Demonstrate how the matching activity works and how to have mathematical dialogue about the decisions being made (see the instructions in the task statement). When students finish the activity, they use an answer key to check their answers. If adjustments need to be made, students discuss any errors they made.
While students are working to match graphs to written descriptions and tables, circulate and ask them to justify their choices.
Launch
Arrange students in groups of 2. Place copies of answer keys in envelopes.
Ask students to observe similarities and differences in the graphs and to create a rationale for sorting them. Provide access to sticky notes. If necessary, specify how the groups will trade places after they finish sorting their graphs into categories.
Demonstrate how to set up and conduct the matching activity. Choose a student to act as your partner. Mix up the cards and place them face-up. Point out that the cards contain either tables or graphs. Select one of each style of card and then explain to your partner why you think the cards do or do not match. Demonstrate productive ways to agree or disagree, e.g. by explaining your mathematical thinking, asking clarifying questions, etc.
Give each group cut-up slips for matching. Tell students to check their matches after they complete the activity using the answer keys.
Supports accessibility for: Conceptual processing; Organization
Design Principle(s): Optimize output (for justification)
Student Facing
Your teacher will give you papers showing tables and graphs.
- Examine the graphs closely. What is the same and what is different about the graphs?
- Sort the graphs into categories of your choosing. Label each category. Be prepared to explain why you sorted the graphs the way you did.
-
Take turns with a partner to match a table with a graph.
- For each match you find, explain to your partner how you know it is a match.
- For each match your partner finds, listen carefully to their explanation. If you disagree, work to reach an agreement.
Pause here so your teacher can review your work.
- Trade places with another group. How are their categories the same as your group's categories? How are they different?
- Return to your original place. Discuss any changes you may wish to make to your categories based on what the other group did.
- Which of the relationships are proportional?
- What have you noticed about the graphs of proportional relationships? Do you think this will hold true for all graphs of proportional relationships?
Student Response
For access, consult one of our IM Certified Partners.
Student Facing
Are you ready for more?
- All the graphs in this activity show points where both coordinates are positive. Would it make sense for any of them to have one or more coordinates that are negative?
- The equation of a proportional relationship is of the form \(y = kx\), where \(k\) is a positive number, and the graph is a line through \((0,0)\). What would the graph look like if \(k\) were a negative number?
Student Response
For access, consult one of our IM Certified Partners.
Anticipated Misconceptions
If students struggle to get starting making any matches, ask questions like “How would we expect this row in the table to look on the graph?” Or, “See this point on the graph? What corresponds to it in the table?”
A common misunderstanding is to assume that if the points lie on a line, then the graph represents a proportional relationship. Ask questions about the table to assist students in realizing the error.
Activity Synthesis
Ask students how they determined which relationships were proportional. Invite volunteers to share the proportional relationships to ensure common understanding. Address any discrepancies through questioning: “How do you know the relationship is proportional? What have you learned about proportional relationships that applies here?”
Select students to share what they noticed about the characteristics of graphs of proportional relationships. Some observations might conclude:
- Points whose coordinates satisfy the relationship lie on a line.
- The line passes through the point \((0,0)\).
This would be a good place to either introduce the term origin to refer to the point \((0,0)\) (or to remind students of it, if they have encountered it before).
If time permits, discuss which written descriptions of proportional relationships would warrant “connecting the dots.” In other words, which proportional relationships are best represented with dots, and which are best represented with an unbroken line? Of the cards which describe a proportional relationship, it makes sense to draw an unbroken line for 7 and 8. The rest should use dots that are not connected. None include negative values without some assumptions (e.g., scenarios that involve owing money for card 2). Students should realize that even when the graph of a proportional relationship is represented by unconnected points, they lie on a line through the origin.
Lesson Synthesis
Lesson Synthesis
At the end of the lesson, make sure that students know that the graph of a proportional relationship lies on a line through the origin. (They will be able to explain why this is true in grade 8.) Students should understand that the context sometimes restricts which points on the line should be included in the graph.
10.4: Cool-down - Which Are Not Proportional (5 minutes)
Cool-Down
For access, consult one of our IM Certified Partners.
Student Lesson Summary
Student Facing
One way to represent a proportional relationship is with a graph. Here is a graph that represents different amounts that fit the situation, “Blueberries cost \$6 per pound.”
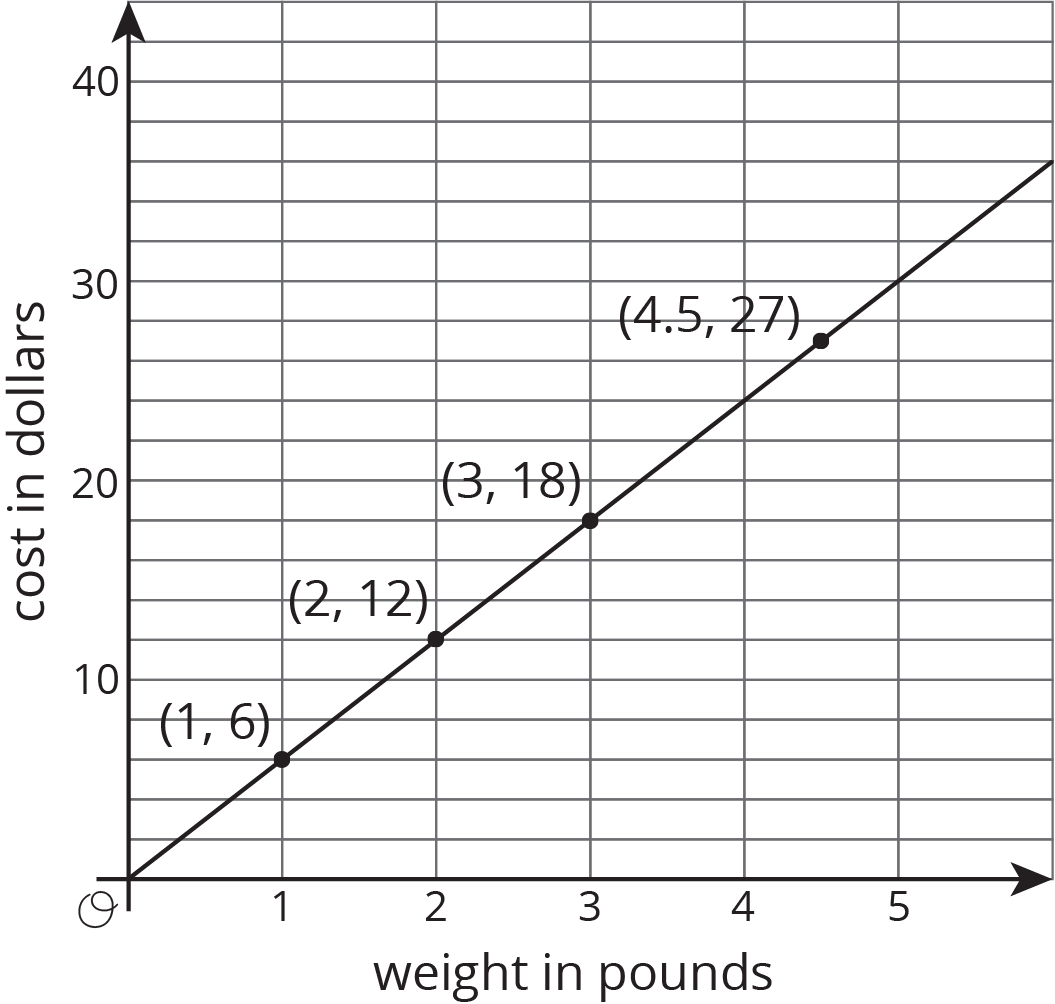
Different points on the graph tell us, for example, that 2 pounds of blueberries cost \$12, and 4.5 pounds of blueberries cost \$27.
Sometimes it makes sense to connect the points with a line, and sometimes it doesn’t. We could buy, for example, 4.5 pounds of blueberries or 1.875 pounds of blueberries, so all the points in between the whole numbers make sense in the situation, so any point on the line is meaningful.
If the graph represented the cost for different numbers of sandwiches (instead of pounds of blueberries), it might not make sense to connect the points with a line, because it is often not possible to buy 4.5 sandwiches or 1.875 sandwiches. Even if only points make sense in the situation, though, sometimes we connect them with a line anyway to make the relationship easier to see.
Graphs that represent proportional relationships all have a few things in common:
- Points that satisfy the relationship lie on a straight line.
- The line that they lie on passes through the origin, \((0,0)\).
Here are some graphs that do not represent proportional relationships:
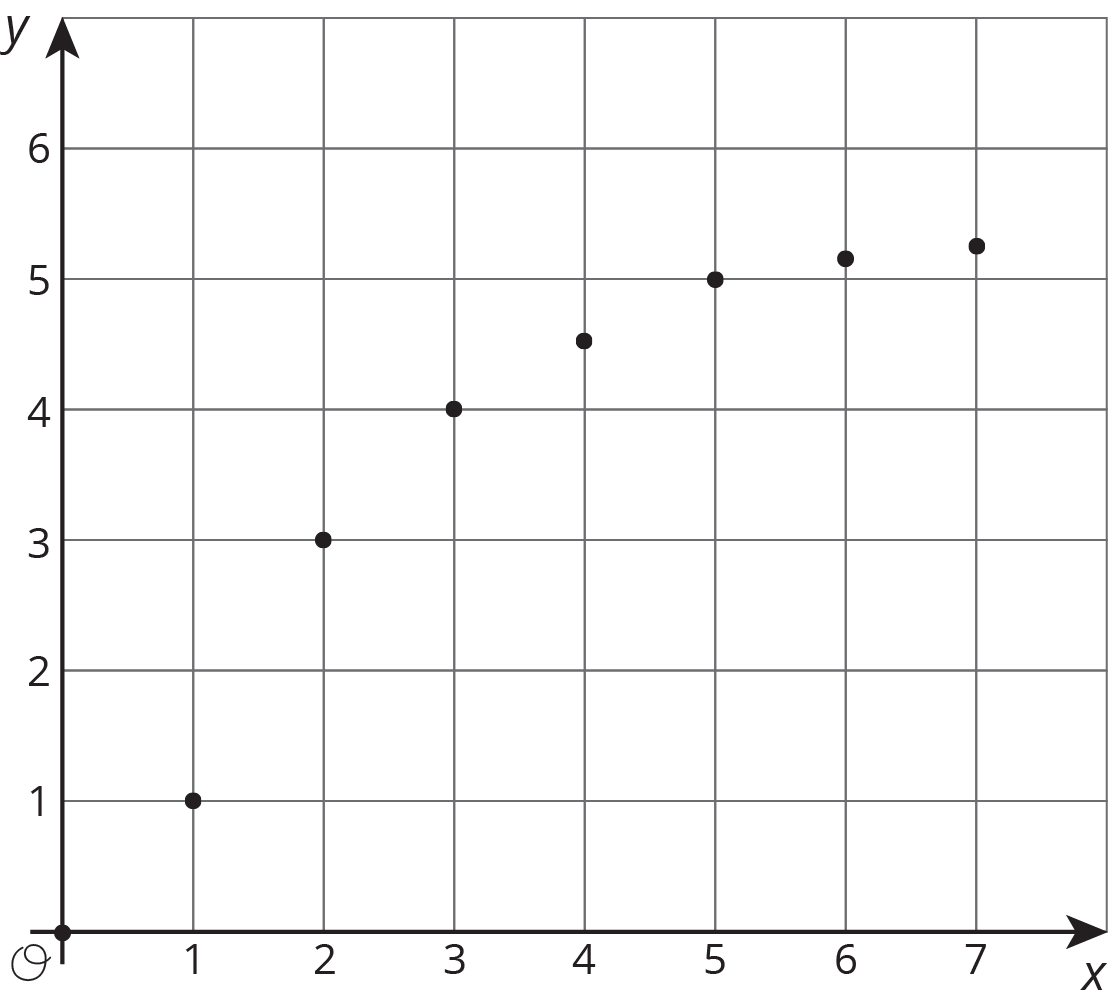
These points do not lie on a line.
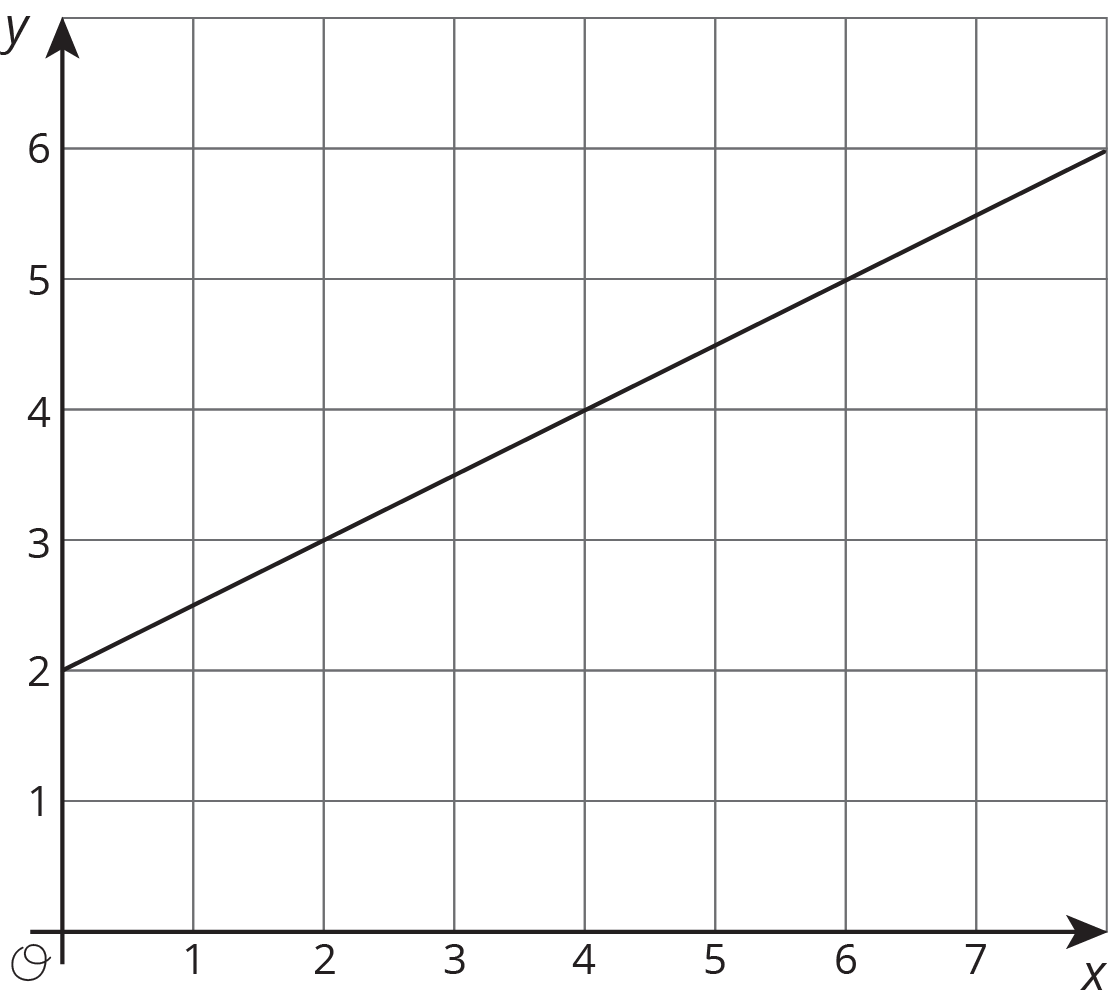
This is a line, but it doesn’t go through the origin.