Lesson 2
Introducing Proportional Relationships with Tables
2.1: Notice and Wonder: Paper Towels by the Case (5 minutes)
Warm-up
The purpose of this warm-up is to elicit the idea that you can use a table to see patterns between related quantities, which will be useful when students discuss how to use tables to learn about proportional relationships in a later activity. While students may notice and wonder many things about these images, the relationship between the rows (multiply both entries by the same number to get another row) and the relationship between the columns (multiply the number of cases by 12 to get the number of paper towels) are the important discussion points.
Launch
Arrange students in groups of 2. Tell students that they will look at an image, and their job is to think of at least one thing they notice and at least one thing they wonder. Display the image for all to see. Ask students to give a signal when they have noticed or wondered about something. Give students 1 minute of quiet think time, and then 1 minute to discuss the things they notice with their partner, followed by a whole-class discussion.
Student Facing
Here is a table that shows how many rolls of paper towels a store receives when they order different numbers of cases.
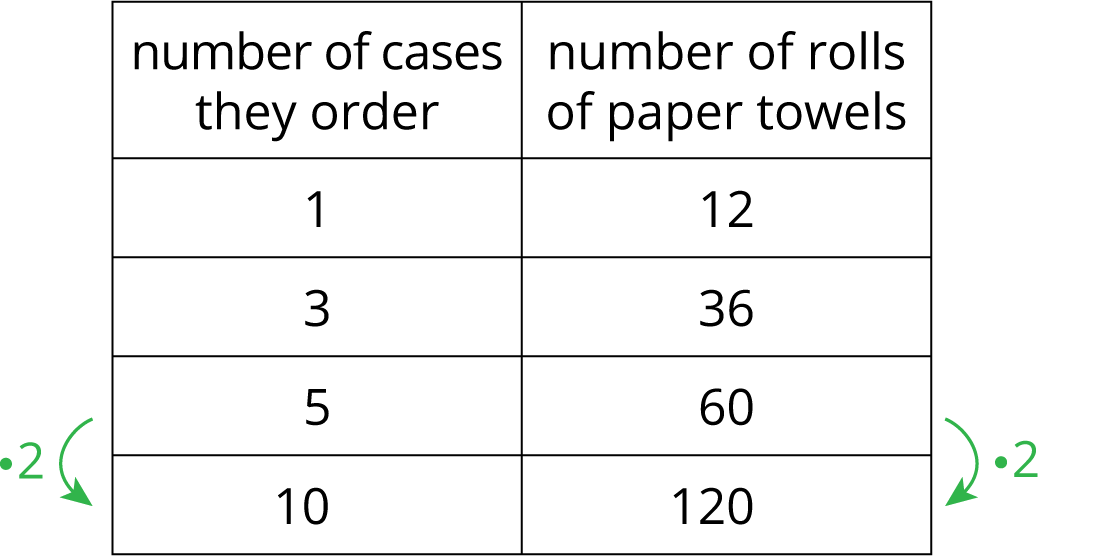
What do you notice about the table? What do you wonder?
Student Response
For access, consult one of our IM Certified Partners.
Activity Synthesis
Ask students to share the things they noticed and wondered. Record and display their responses for all to see. If possible, record the relevant reasoning on or near the image. After each response, ask the class if they agree or disagree and to explain alternative ways of thinking, referring back to the images each time. If the relationship between the number of cases and the number of paper towels does not come up during the conversation, ask students to discuss this idea.
2.2: Feeding a Crowd (15 minutes)
Activity
The purpose of this task is to introduce students to the idea of a proportional relationship. From previous work, students should be familiar with the idea of equivalent ratios, and they may very well recognize the table as a set of equivalent ratios. Here, we are starting to expand this concept and the language associated with it to say that there is a proportional relationship between the cups of rice and number of people as well as the number of spring rolls and number of people. More generally, there is a proportional relationship between two quantities when the quantities are characterized by a set of equivalent ratios.
The context in this activity and the numbers used are intended to be accessible to all students so that they can focus on its mathematical structure (MP7) and the new terms introduced in the lesson without being distracted.
While students are working, monitor for groups using each of these approaches:
- Drawing that depicts 15 cups of rice and 45 people, organized into three people per cup. This representation of the problem can support all learners in moving forward. The teacher should highlight the organization of three people per cup, and identify correspondences between parts of the drawing and numbers in the table.
- Moving down the table, multiplying both numbers in a row by the same number. “Since I multiply 2 by 5 to get 10, I will multiply 6 by 5 and get 30. Since 9 times 5 is 45, I will also multiply 3 by 5 to get 15.” If it comes up, the most appropriate name for the multiplier would be scale factor, but it is not necessary for students to call it this.
- Calculation and use of a unit rate. “I reasoned that 1 cup of rice must serve 3 people. So 10 cups of rice must serve 30, and 15 cups must serve 45.”
- Moving across the table. “It looks like we always multiply number of cups of rice by 3 to get the number of people it serves, so I will multiply 10 cups by 3 to get 30, and divide the 45 by 3 to get 15.”
Launch
Say, “Rice is a big part of the traditions and cultures of many families. Does your family cook rice, and if so, how?" Invite a student to describe the process (measure rice, measure water, simmer for a while). You use more rice for more people and less rice for fewer people. If students have trouble understanding or representing the context, show them the measuring cup so that they have a sense of its size, or draw a literal diagram that looks something like this:

Similarly, ask students if they have ever eaten a spring roll and invite them to describe what they are. While some spring rolls can be very large, the ones referred to in this activity are smaller.
Supports accessibility for: Language; Social-emotional skills
Student Facing
-
A recipe says that 2 cups of dry rice will serve 6 people. Complete the table as you answer the questions. Be prepared to explain your reasoning.
-
How many people will 10 cups of rice serve?
- How many cups of rice are needed to serve 45 people?
cups of rice number of people 2 6 3 9 10 45 -
- A recipe says that 6 spring rolls will serve 3 people. Complete the table.
number of spring rolls number of people 6 3 30 40 28
Student Response
For access, consult one of our IM Certified Partners.
Activity Synthesis
Select students to share their approaches using the sequence listed in the Activity Narrative.
After students have shared their reasoning and connections have been drawn between the different approaches, introduce the term proportional relationship. For example, “Whenever we have a situation like this where two quantities are always in the same ratio, we say there is a proportional relationship between the quantities. So the relationship between the number of cups of rice and the number of people is a proportional relationship. The number of cups of rice is proportional to the number of people.” Write out some of these statements for all to see (in the next activity, students will need to write a statement like these about a different relationship). If the class has a word wall or students keep track of mathematical vocabulary in their notebooks, these new terms can be included there.
Notice that methods 2 and 3 involve identifying relationships of column entries, namely that the entry in the right-hand column is three times the corresponding entry in the left-hand column. This pattern can be explained in terms of the unit rate (people per cup of rice), which tells us how many people we can serve with a given amount of rice. The next activity is intended to build the understanding underlying this explanation.
After discussing the rice context thoroughly, ask students to share their solution approaches to the spring roll context. Ask students to identify and interpret the unit rate in this situation (0.5 people per spring roll may sound strange, but it means that 1 spring roll only halfway satisfies a person.)
2.3: Making Bread Dough (10 minutes)
Activity
In this activity, students grapple with finding missing values for ratios of whole numbers presented in a table where identifying a usable scale factor is not as easy as in the previous activity. This task is designed to encourage students to use a unit rate. Its context is intended to be familiar so that students can focus on mathematical structure (MP7) and the new terms (MP6) constant of proportionality and proportional relationship. If students are having difficulty understanding the scenario, consider drawing discrete diagrams like this:

This can be followed by a double number line diagram. Correspondences among the diagrams can be identified.

Anticipated approaches include use of scale factors, unit rate, and moving across columns. Because 13 is not a multiple of 4 or 8, students are more likely to use and see the value of using the unit rate or the relationship of the columns. Unit rates might be used: \(\frac54\) or 1.25 cups of flour per tablespoon of honey, or \(\frac45\) or 0.8 tablespoon of honey per cup of flour. Both approaches are correct, but the numbers are easier for the first approach, so this is the solution to have students share. While students are working, monitor the approaches used by each student or group.
Launch
Tell students that in this activity, they will think about a different proportional relationship. If necessary, show students the measuring cup and the tablespoon side by side to help make the context more concrete. You could even pantomime the first sentence in the activity: “measuring” 8 tablespoons of invisible honey and 10 cups of invisible flour.
Reading: MLR6 Three Reads. This is the first time Math Language Routine 6 is suggested as a support in this course. In this routine, students are supported in reading a mathematical text, situation, or word problem three times, each with a particular focus. During the first read, students focus on comprehending the situation; during the second read, students identify quantities; during the third read, students brainstorm possible strategies to answer the question. The question to be answered does not become a focus until the third read so that students can make sense of the whole context before rushing to a solution. The purpose of this routine is to support students’ reading comprehension as they make sense of mathematical situations and information through conversation with a partner.
Design Principle(s): Support sense-making
How It Happens:
-
In the first read, students read the problem with the goal of comprehending the situation.
Invite a student to read the problem aloud while everyone else reads with them and then ask, “What is this situation about?”
Allow one minute to discuss with a partner, and then share with the whole class. A clear response would be: “A bakery uses a recipe to make bread. The recipe includes honey and flour.”
-
In the second read, students analyze the mathematical structure of the story by naming quantities.
Invite students to read the problem aloud with their partner or select a different student to read to the class and then prompt students by asking, “What can be counted or measured in this situation? For now we don’t need to focus on how many or how much of anything, but what can we count in this situation?” Give students one minute of quiet think time followed by another minute to share with their partner. Quantities may include: number of tablespoons of honey, number of cups of flour, size of the batches.
Listen for, and amplify, student language about the relationships among the amount of honey, the amount of flour, and the size of the the batches. Invite students to sketch a diagram to represent these relationships.
-
In the third read, students brainstorm possible strategies to complete the table.
Invite students to read the problem aloud with their partner or select a different student to read to the class. Instruct students to think of ways to approach the questions without actually completing the table. Consider using these questions to prompt students: “How would you approach this question?,” and “What strategy would you try first?”
Give students one minute of quiet think time followed by another minute to discuss with their partner. Provide these sentence frames as partners discuss: “To figure out how much flour is needed for a given amount of honey….”, “One way a constant of proportionality could help is….”
Sample responses include: “I would try to find the factor that gets us from 8 tablespoons to 20 tablespoons,” “I would draw a diagram to figure out how much flour is needed for 1 tablespoon of honey,” and, “I know that 10 to 8 is the same as 5 to 4 is the same as 1.25, and that is the constant of proportionality, so I know I need to multiply by 1.25.” This will help students concentrate on making sense of the situation before rushing to a solution or method. -
As partners are discussing their strategies, select 1–2 students to share their ideas with the whole class.
As students are presenting ideas to the whole class, create a display that summarizes their ideas about how to complete the table. Listen for quantities that were mentioned during the second read, and include these on the display.
-
Post the summary where all students can use it as a reference.
Student Facing
A bakery uses 8 tablespoons of honey for every 10 cups of flour to make bread dough. Some days they bake bigger batches and some days they bake smaller batches, but they always use the same ratio of honey to flour. Complete the table as you answer the questions. Be prepared to explain your reasoning.
-
How many cups of flour do they use with 20 tablespoons of honey?
-
How many cups of flour do they use with 13 tablespoons of honey?
-
How many tablespoons of honey do they use with 20 cups of flour?
- What is the proportional relationship represented by this table?
| honey (tbsp) | flour (c) |
|---|---|
| 8 | 10 |
| 20 | |
| 13 | |
| 20 |
Student Response
For access, consult one of our IM Certified Partners.
Activity Synthesis
Select students to share their solution approaches in this order:
- Double each entry in the first row to get to row 4.
- Divide each entry in the first row by 8, yielding the pair \((1, 1.25)\). (1.25 can be called the unit rate, since 1.25 cups of flour are needed for 1 tablespoon of honey.) Multiply by 20 and 13 to get rows 2 and 3.
- Notice any entry in the first column can be multiplied by \(\frac54\) or 1.25 to get the corresponding entry in the second column. Name this value the constant of proportionality for the proportional relationship.
Ensure that these are highlighted as part of the discussion and that students describe their methods using mathematical language (MP6). For example,
- Note that even though you multiply by a different scale factor to go from row to row in the table, the unit rate is always the same. Rename this “the constant of proportionality.” Note that it can always be found by finding how much of the second quantity per one of the first quantity.
- Ask students what the proportional relationship is in this situation.
- Ask students to interpret the constant of proportionality in the context: “What does the 1.25 tell us about?” (That there are 1.25 cups of flour per tablespoon of honey.) Because this can help them connect it to their work in grade 6 and prepare them for the next activity.
Supports accessibility for: Language; Social-emotional skills
2.4: Quarters and Dimes (10 minutes)
Optional activity
The purpose of this optional activity is to practice using a proportional relationship in another context. The chosen numbers make the unit rate a useful tool to answer the questions.
Launch
Remind students of the value of a quarter and a dime.
Student Facing
4 quarters are equal in value to 10 dimes.
- How many dimes equal the value of 6 quarters?
- How many dimes equal the value of 14 quarters?
- What value belongs next to the 1 in the table? What does it mean in this context?
| number of quarters |
number of dimes |
|---|---|
| 1 | |
| 4 | 10 |
| 6 | |
| 14 |
Student Response
For access, consult one of our IM Certified Partners.
Student Facing
Are you ready for more?
Pennies made before 1982 are 95% copper and weigh about 3.11 grams each. (Pennies made after that date are primarily made of zinc). Some people claim that the value of the copper in one of these pennies is greater than the face value of the penny. Find out how much copper is worth right now, and decide if this claim is true.
Student Response
For access, consult one of our IM Certified Partners.
Activity Synthesis
Ask students for the value that belongs next to the 1 in the table. Invite several students to explain the significance of this number.
Design Principle(s): Cultivate conversation
Lesson Synthesis
Lesson Synthesis
Briefly revisit the two activities, demonstrating the use of the new terms. It would be helpful to display a filled-in table for each to facilitate the conversation. For example,
- In the first activity, we looked at a proportional relationship between the amount of rice and the number of people served. Some people found missing values in the table by multiplying both values in one of the rows by a number, others used a unit rate—the number of people served per cup of rice. What was the constant of proportionality in that situation?
- In the second activity, we looked at a proportional relationship between the amount of honey and the amount of flour in a recipe. Some people found missing values in the table by multiplying both values in one of the rows by a number, others used a unit rate—the number of cups of flour per tablespoon of honey. What was the constant of proportionality in that situation?
If this has not already happened during the discussion, write a third column in each table that shows the constant of proportionality and label it.
2.5: Cool-down - Green Paint (5 minutes)
Cool-Down
For access, consult one of our IM Certified Partners.
Student Lesson Summary
Student Facing
If the ratios between two corresponding quantities are always equivalent, the relationship between the quantities is called a proportional relationship.
This table shows different amounts of milk and chocolate syrup. The ingredients in each row, when mixed together, would make a different total amount of chocolate milk, but these mixtures would all taste the same.
Notice that each row in the table shows a ratio of tablespoons of chocolate syrup to cups of milk that is equivalent to \(4:1\).
About the relationship between these quantities, we could say:
| tablespoons of chocolate syrup |
cups of milk |
|---|---|
| 4 | 1 |
| 6 | \(1\frac{1}{2}\) |
| 8 | 2 |
| \(\frac{1}{2}\) | \(\frac{1}{8}\) |
| 12 | 3 |
| 1 | \(\frac{1}{4}\) |
- The relationship between amount of chocolate syrup and amount of milk is proportional.
- The relationship between the amount of chocolate syrup and the amount of milk is a proportional relationship.
- The table represents a proportional relationship between the amount of chocolate syrup and amount of milk.
- The amount of milk is proportional to the amount of chocolate syrup.
We could multiply any value in the chocolate syrup column by \(\frac14\) to get the value in the milk column. We might call \(\frac14\) a unit rate, because \(\frac14\) cup of milk is needed for 1 tablespoon of chocolate syrup. We also say that \(\frac14\) is the constant of proportionality for this relationship. It tells us how many cups of milk we would need to mix with 1 tablespoon of chocolate syrup.