Lesson 12
Using Graphs to Compare Relationships
Let’s graph more than one relationship on the same grid.
12.1: Number Talk: Fraction Multiplication and Division
Find each product or quotient mentally.
\(\frac23 \boldcdot \frac12\)
\(\frac43 \boldcdot \frac14\)
\(4 \div \frac15\)
\(\frac96 \div \frac12\)
12.2: Race to the Bumper Cars
Diego, Lin, and Mai went from the ticket booth to the bumper cars.
1. Use each description to complete the table representing that person’s journey.
- Diego left the ticket booth at the same time as Tyler. Diego jogged ahead at a steady pace and reached the bumper cars in 30 seconds.
- Lin left the ticket booth at the same time as Tyler. She ran at a steady pace and arrived at the bumper cars in 20 seconds.
- Mai left the booth 10 seconds later than Tyler. Her steady jog enabled her to catch up with Tyler just as he arrived at the bumper cars.
| Diego's time (seconds) | Diego's distance (meters) |
|---|---|
| 0 | |
| 15 | |
| 30 | 50 |
| 1 |
| Lin's time (seconds) | Lin's distance (meters) |
|---|---|
| 0 | |
| 25 | |
| 20 | 50 |
| 1 |
| Mai's time (seconds) | Mai's distance (meters) |
|---|---|
| 0 | |
| 25 | |
| 40 | 50 |
| 1 |
2. Using a different color for each person, draw a graph of all four people’s journeys (including Tyler's from the other day).
- Drag the names to the correct lines to label them.
- If you choose to, you can use the Paint Brush tool to change the color of each line. Select the tool, click on a color in the palette below the graph, and then click on a line. Click on the Move tool (the arrow) before changing to a new paint brush color.
- You can hide any points you create with the checkbox below the graph.
3. Which person is moving the most quickly? How is that reflected in the graph?
Write equations to represent each person’s relationship between time and distance.
12.3: Space Rocks and the Price of Rope
-
Meteoroid Perseid 245 and Asteroid x travel through the solar system. Explore the applet to learn about the distance they had each traveled after a given time.
Is Asteroid x traveling faster or slower than Perseid 245? Explain how you know.
-
The graph shows the price of different lengths of two types of rope.
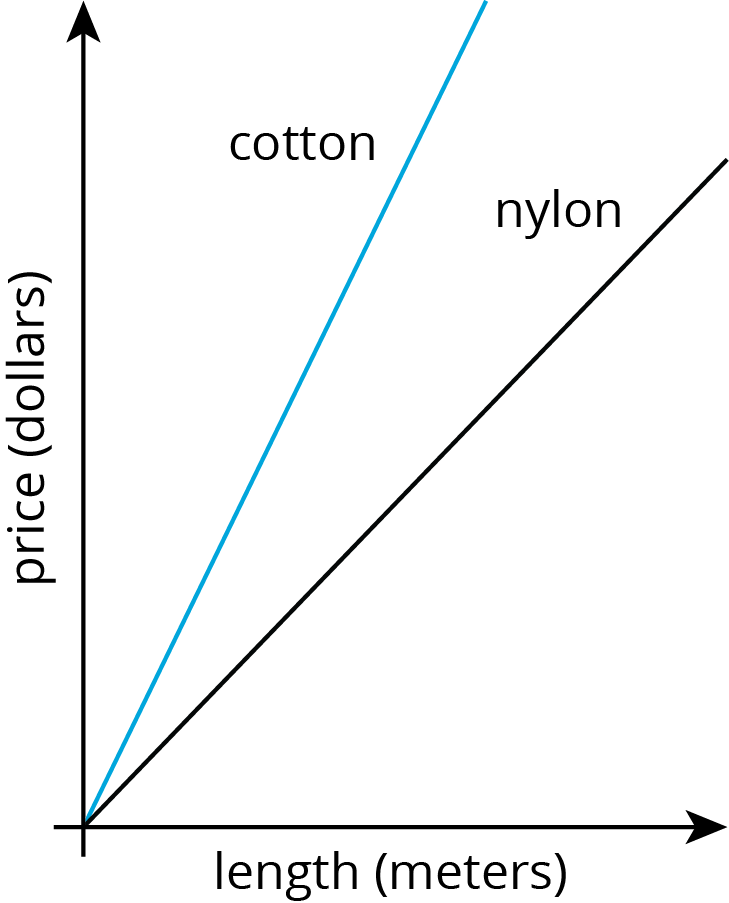
If you buy $1.00 of each kind of rope, which one will be longer? Explain how you know.
Summary
Here is a graph that shows the price of blueberries at two different stores. Which store has a better price?
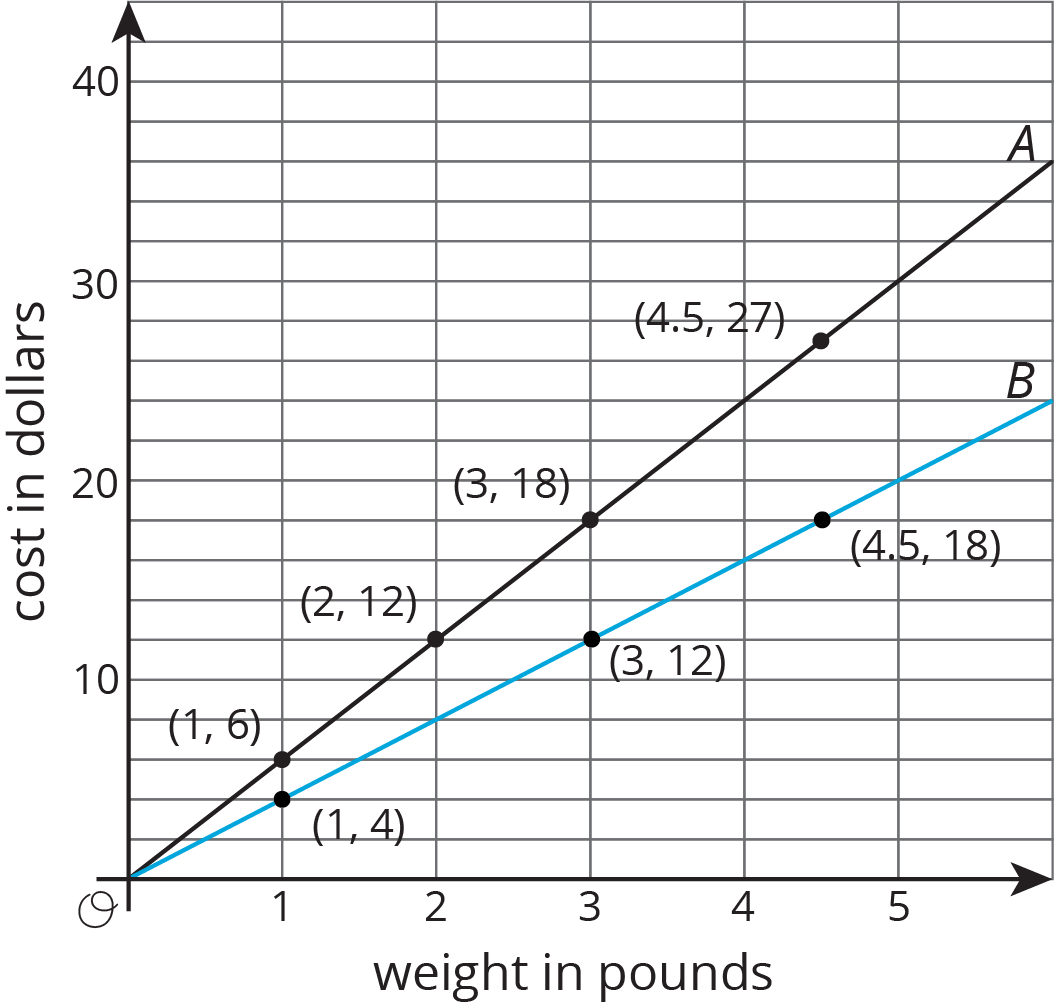
We can compare points that have the same \(x\) value or the same \(y\) value. For example, the points \((2, 12)\) and \((3, 12)\) tell us that at store B you can get more pounds of blueberries for the same price.
The points \((3, 12)\) and \((3, 18)\) tell us that at store A you have to pay more for the same quantity of blueberries. This means store B has the better price.
We can also use the graphs to compare the constants of proportionality. The line representing store B goes through the point \((1, 4)\), so the constant of proportionality is 4. This tells us that at store B the blueberries cost \$4 per pound. This is cheaper than the \$6 per pound unit price at store A.
Glossary Entries
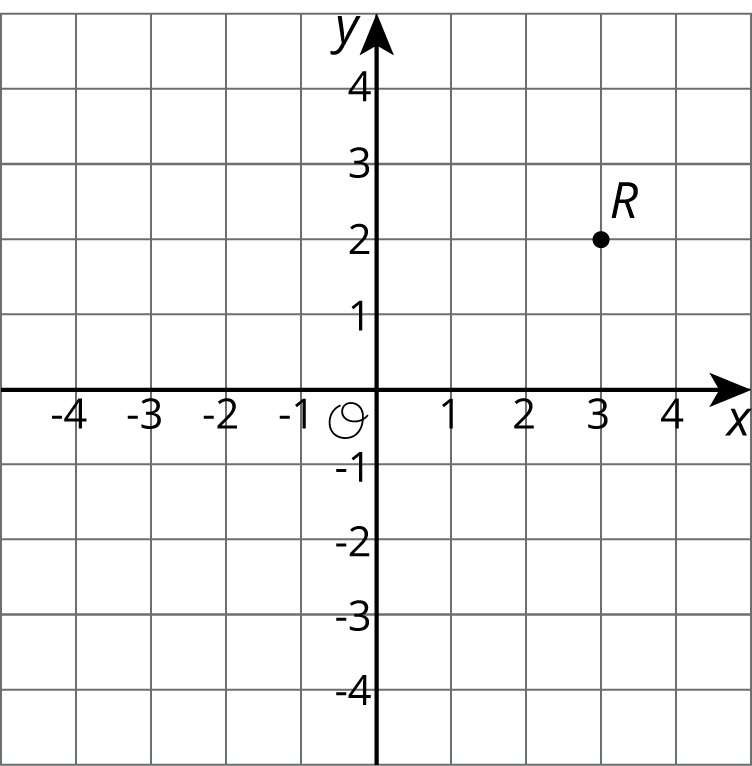
- coordinate plane
The coordinate plane is a system for telling where points are. For example. point \(R\) is located at \((3, 2)\) on the coordinate plane, because it is three units to the right and two units up.
- origin
The origin is the point \((0,0)\) in the coordinate plane. This is where the horizontal axis and the vertical axis cross.
