Lesson 10
Introducing Graphs of Proportional Relationships
Lesson Narrative
This lesson introduces an important way of representing a proportional relationship: its graph. Students plot points on the graph from tables, and, by the end of the lesson, start to see that the graph of a proportional relationship always lies on a line that passes through \((0,0)\). They match tables and graphs of given situations and articulate their reasons for each match (MP3).
Learning Goals
Teacher Facing
- Compare and contrast (orally) graphs of relationships.
- Generalize (orally and in writing) that a proportional relationship can be represented in the coordinate plane by a line that includes the “origin” or by a collection of points that lie on such a line.
- Justify (orally) that a table and a graph represent the same relationship.
Student Facing
Let’s see how graphs of proportional relationships differ from graphs of other relationships.
Required Materials
Required Preparation
Prepare Matching Tables and Graphs activity by printing one copy for each group of 2 students and cutting them up ahead of time. Prepare a few copies of an answer key and place them in envelopes for students to access to check their work when they finish.
Learning Targets
Student Facing
- I know that the graph of a proportional relationship lies on a line through $(0,0)$.
CCSS Standards
Glossary Entries
-
coordinate plane
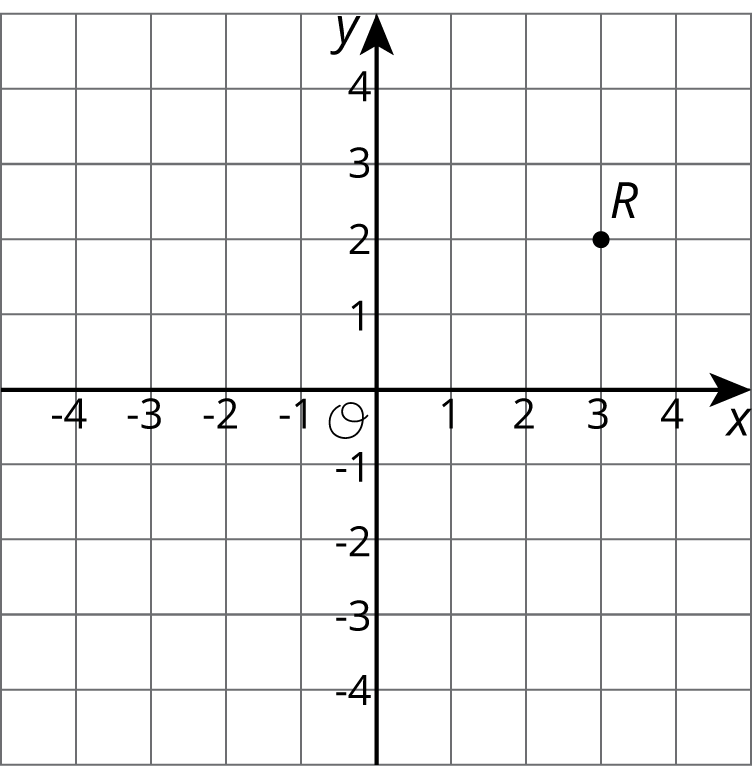
The coordinate plane is a system for telling where points are. For example. point \(R\) is located at \((3, 2)\) on the coordinate plane, because it is three units to the right and two units up.

-
origin
The origin is the point \((0,0)\) in the coordinate plane. This is where the horizontal axis and the vertical axis cross.
Print Formatted Materials
For access, consult one of our IM Certified Partners.
Additional Resources
| Google Slides | For access, consult one of our IM Certified Partners. |
|
| PowerPoint Slides | For access, consult one of our IM Certified Partners. |
