Lesson 10
Introducing Graphs of Proportional Relationships
Problem 1
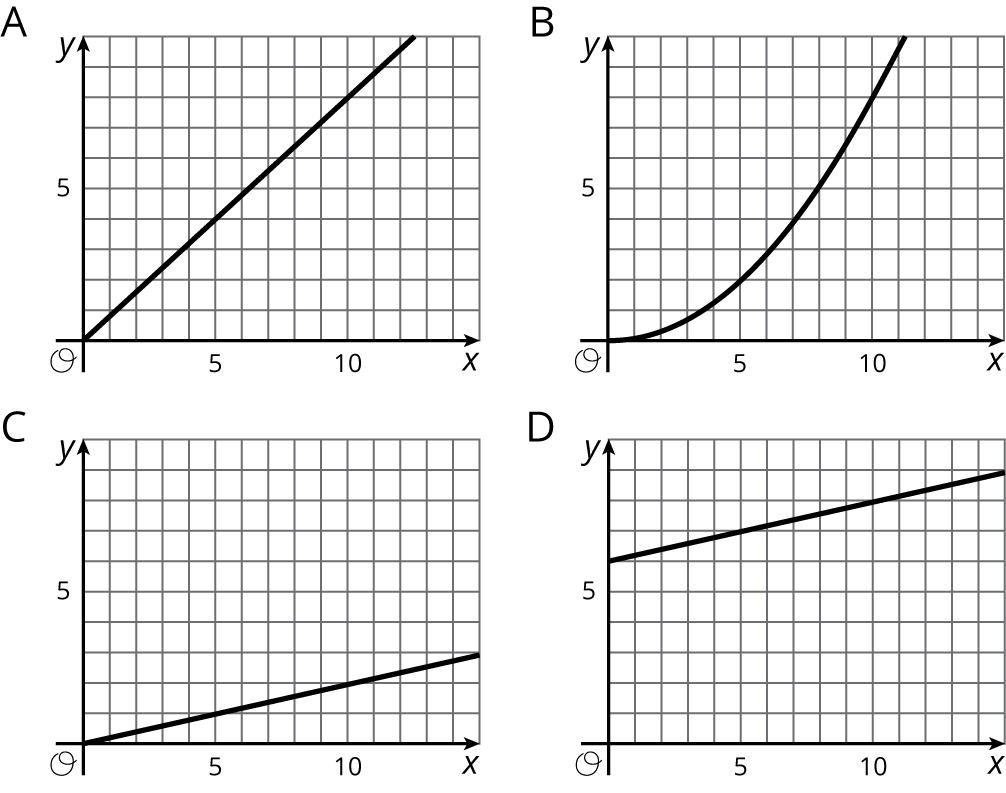
Which graphs could represent a proportional relationship?

A
B
C
D
Solution
For access, consult one of our IM Certified Partners.
Problem 2
A lemonade recipe calls for \(\frac14\) cup of lemon juice for every cup of water.
- Use the table to answer these questions.
- What does \(x\) represent?
- What does \(y\) represent?
- Is there a proportional relationship between \(x\) and \(y\)?
- Plot the pairs in the table in a coordinate plane.
| \(x\) | \(y\) |
|---|---|
| 1 | \(\frac14\) |
| 2 | \(\frac12\) |
| 3 | \(\frac34\) |
| 4 | 1 |
Solution
For access, consult one of our IM Certified Partners.
Problem 3
Select all the pieces of information that would tell you \(x\) and \(y\) have a proportional relationship. Let \(y\) represent the distance in meters between a rock and a turtle's current position and \(x\) represent the time in minutes the turtle has been moving.
\(y = 3x\)
After 4 minutes, the turtle has walked 12 feet away from the rock.
The turtle walks for a bit, then stops for a minute before walking again.
The turtle walks away from the rock at a constant rate.
Solution
For access, consult one of our IM Certified Partners.
(From Unit 2, Lesson 9.)Problem 4
Decide whether each table could represent a proportional relationship. If the relationship could be proportional, what would be the constant of proportionality?
-
The sizes you can print a photo.
width of photo (inches) height of photo (inches) 2 3 4 6 5 7 8 10 -
The distance from which a lighthouse is visible.
height of a lighthouse (feet) distance it can be seen (miles) 20 6 45 9 70 11 95 13
Solution
For access, consult one of our IM Certified Partners.
(From Unit 2, Lesson 7.)