Lesson 2
Using Diagrams to Represent Addition and Subtraction
Problem 1
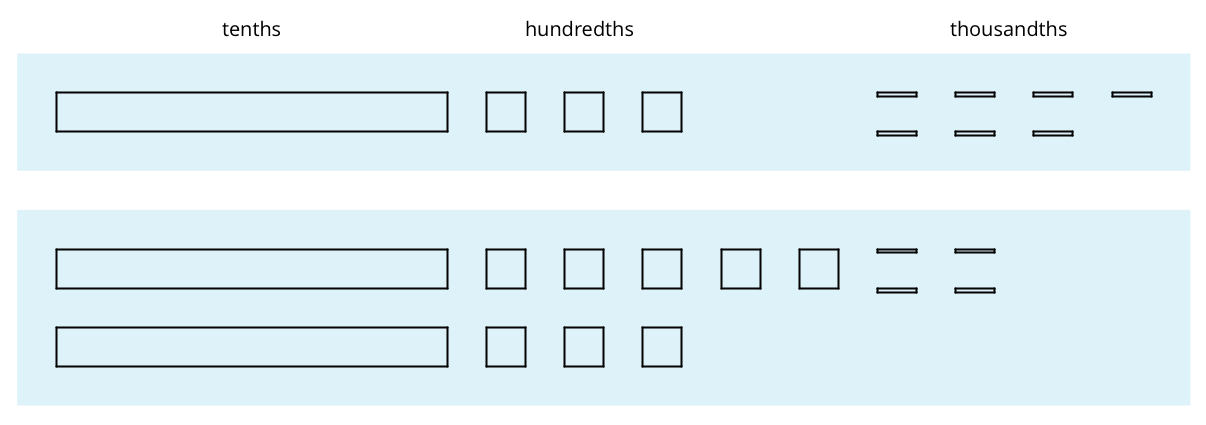
Use the given key to answer the questions.

- What number does this diagram represent?

-
Draw a diagram that represents 0.216.
-
Draw a diagram that represents 0.304.
Solution
For access, consult one of our IM Certified Partners.
Problem 2
Here are diagrams that represent 0.137 and 0.284.
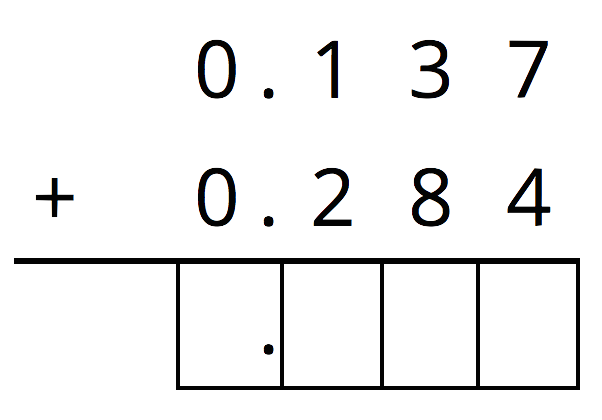
- Use the diagram to find the value of \(0.137 + 0.284\). Explain your reasoning.
-
Calculate the sum vertically.
- How was your reasoning about \(0.137 + 0.284\) the same with the two methods? How was it different?
Solution
For access, consult one of our IM Certified Partners.
Problem 3
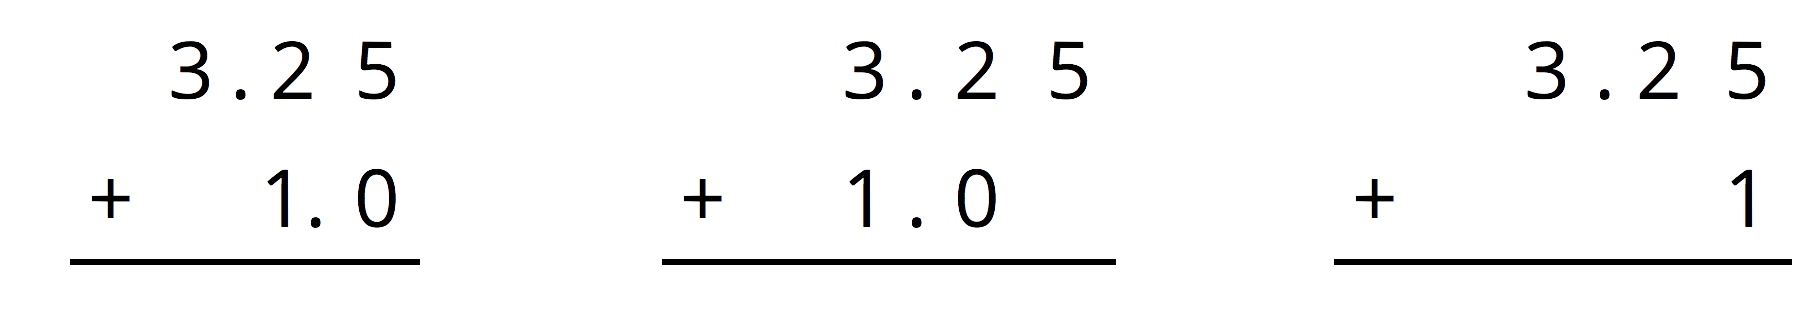
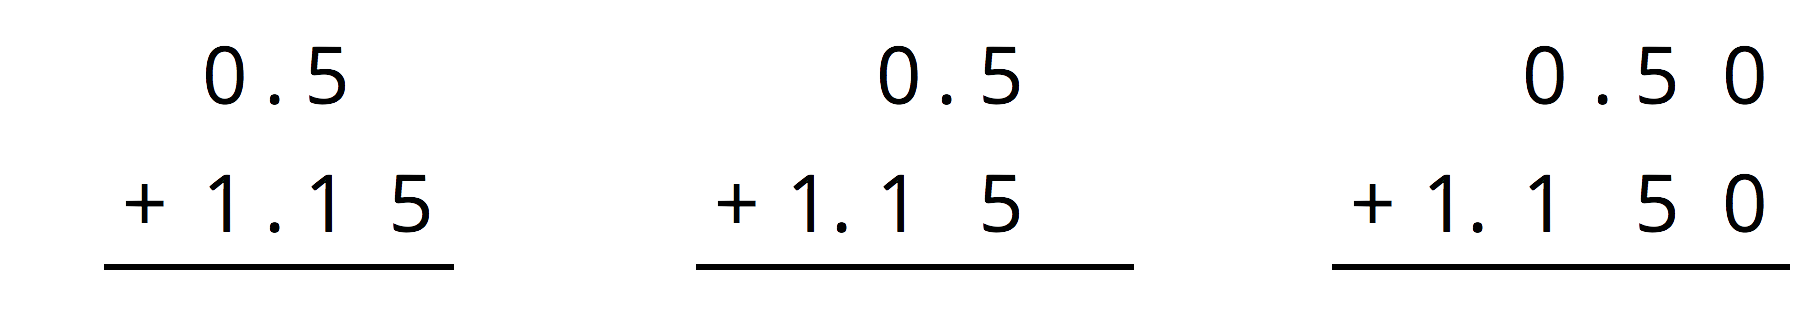
For the first two problems, circle the vertical calculation where digits of the same kind are lined up. Then, finish the calculation and find the sum. For the last two problems, find the sum using vertical calculation.
-
\(3.25+1\)
-
\(0.5+1.15\)
-
\(10.6+ 1.7\)
- \(123+0.2\)
Solution
For access, consult one of our IM Certified Partners.
Problem 4
Andre has been practicing his math facts. He can now complete 135 multiplication facts in 90 seconds.
- If Andre is answering questions at a constant rate, how many facts can he answer per second?
- Noah also works at a constant rate, and he can complete 75 facts in 1 minute. Who is working faster? Explain or show your reasoning.
Solution
For access, consult one of our IM Certified Partners.
(From Unit 2, Lesson 9.)