Lesson 2
Using Diagrams to Represent Addition and Subtraction
2.1: Changing Values (5 minutes)
Warm-up
The purpose of this warm-up is for students to review place value when working with decimals. There are many ways students might find the numbers represented by the large rectangle and large square. However, the focus as students work should be on understanding that each place represents a unit that is 10 times larger than the unit immediately to its right. This understanding can be represented by diagrams or by multiplication expressions (MP8).
Launch
Arrange students in groups of 2. Tell students to look for patterns as they work. Give students 1–2 minute of quiet think time, followed by a brief partner discussion. Tell the partners to share their responses, come to an agreement on each answer, and discuss any patterns they noticed. Select students with correct responses to share during the whole-class discussion.
Student Facing
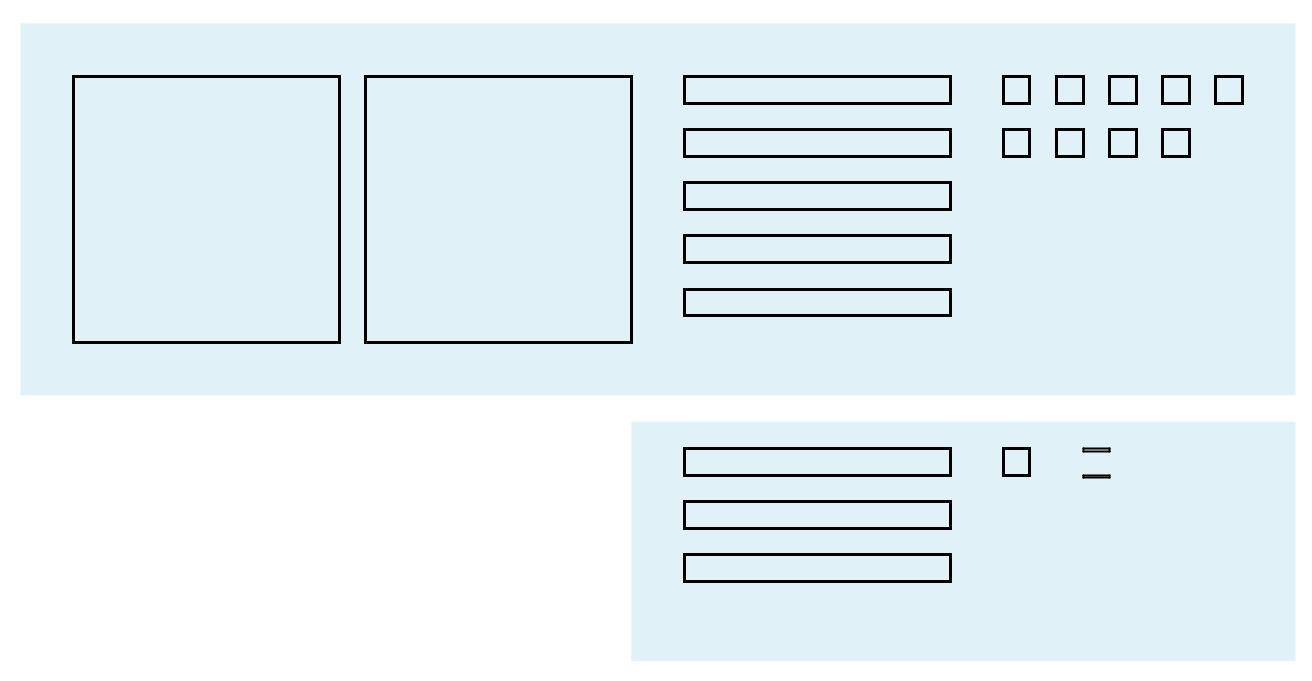
- Here is a rectangle.

What number does the rectangle represent if each small square represents:
-
1
-
0.1
-
0.01
-
0.001
-
- Here is a square.

What number does the square represent if each small rectangle represents:
-
10
-
0.1
- 0.00001
-
Student Response
For access, consult one of our IM Certified Partners.
Anticipated Misconceptions
Some students may continually use skip counting (by 10, by 0.1, etc.) to find the value of the rectangle and the square, rather than making connections to place value. To help these students see a pattern connected to their skip counting, ask them to also write the multiplication expression that relates the value of each of the smaller units to that of the larger unit they compose.
Activity Synthesis
Ask selected students to share their values for the diagrams, how they found them, and what patterns they noticed. Record and display these values for all to see. Ask other students for the multiplication equation that represents each response to highlight that each decimal place value is 10 times the value of the unit to its right. For example, the recording for the first question should look like this:
\(10 \boldcdot 1=10\)
\(10 \boldcdot 0.1=1\)
\(10 \boldcdot 0.01=0.1\)
\(10 \boldcdot 0.001=0.01\)
If time permits, discuss some of these questions:
- “When you change what each small square represents, how did the change affect the value of the large rectangle?”
- “What might be some other numbers that the small square or long rectangle could represent?”
- “Why could these representations be called ‘base-ten diagrams’?”
2.2: Squares and Rectangles (15 minutes)
Optional activity
In this activity, students reinforce their understanding of the meaning of place value, i.e., that the value in ones place is 10 times the value of the place to its right (and \(\frac {1}{10}\) the value of the place to its left). They draw base-ten diagrams to represent addition of decimals; they connect the process of regrouping numbers in the addition algorithm to the “bundling” of pieces in the diagram. For example, they see that 10 medium squares (0.01) can be composed or “bundled” to make 1 medium rectangle (0.1). Likewise, when the numbers in the ones place add up to be at least 10, we can group them and add 1 to the tens place.
As alternatives to drawing diagrams, consider having students use physical base-ten blocks (if available), a paper version of the base-ten figures (from the blackline master), or this digital applet https://ggbm.at/FXEZD466.
Launch
Give students 1 minute of quiet time to study the diagrams and notice how they are structured. Then, have students identify the value of various units by pointing to them. For example, point to the medium square, and ask what it represents and how it relates to the large rectangle. Once students are familiar with the various pieces and their values, give students 10 minutes of quiet work time. Provide access to physical pattern blocks, cut-up paper copies of the base-ten figures, or the digital applet for representing base-ten numbers, if needed.

Supports accessibility for: Conceptual processing
Student Facing
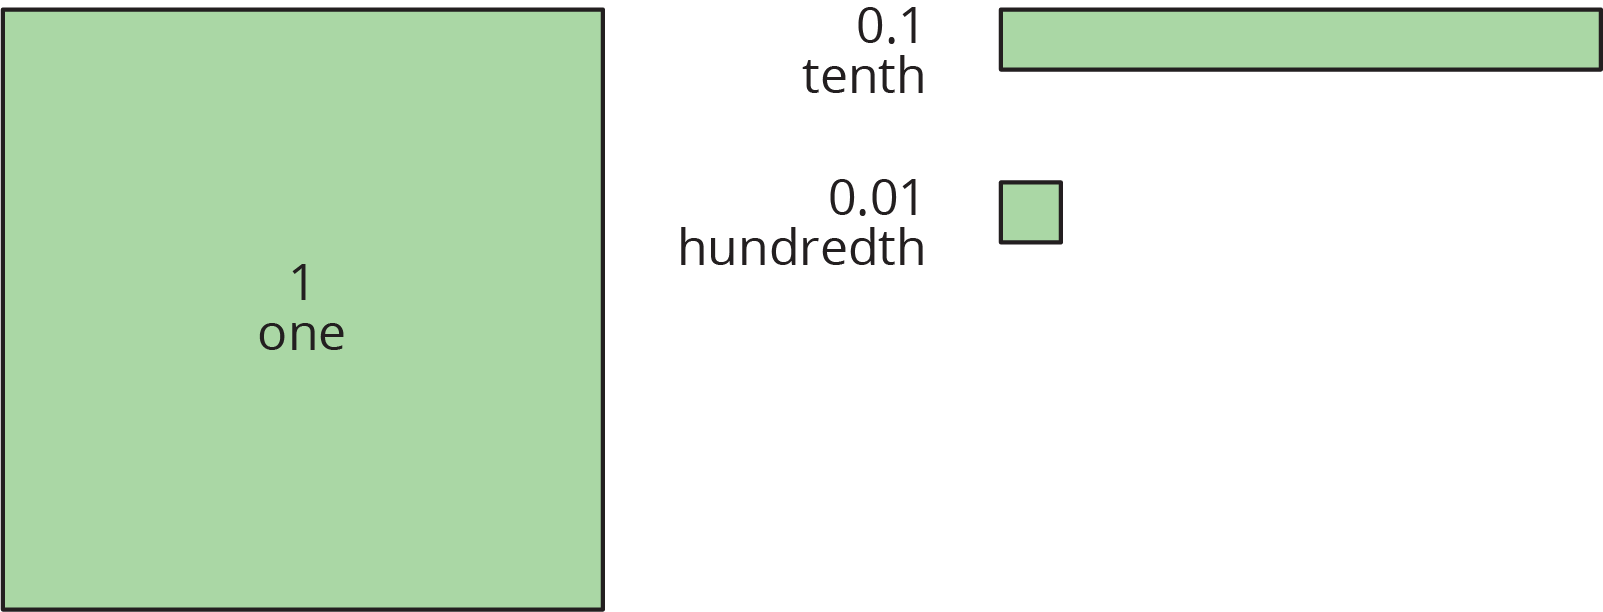
You may be familiar with base-ten blocks that represent ones, tens, and hundreds. Here are some diagrams that we will use to represent digital base-ten units. A large square represents 1 one. A rectangle represents 1 tenth. A small square represents 1 hundredth.
The applet has tools that create each of the base-ten blocks.
Select a Block tool, and then click on the screen to place it.

One

Tenth

Hundredth
Click on the Move tool when you are done choosing blocks.

-
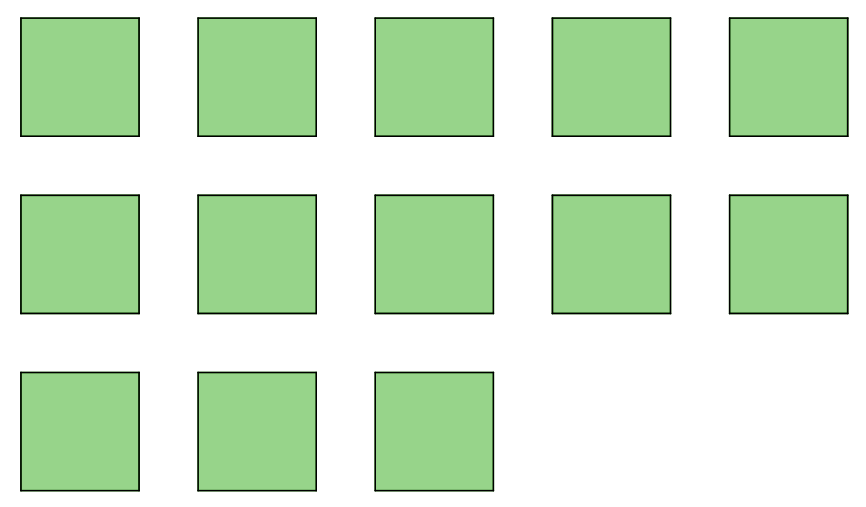
Here is the diagram that Priya drew to represent 0.13. Draw a different diagram that represents 0.13. Explain why your diagram and Priya’s diagram represent the same number.
-
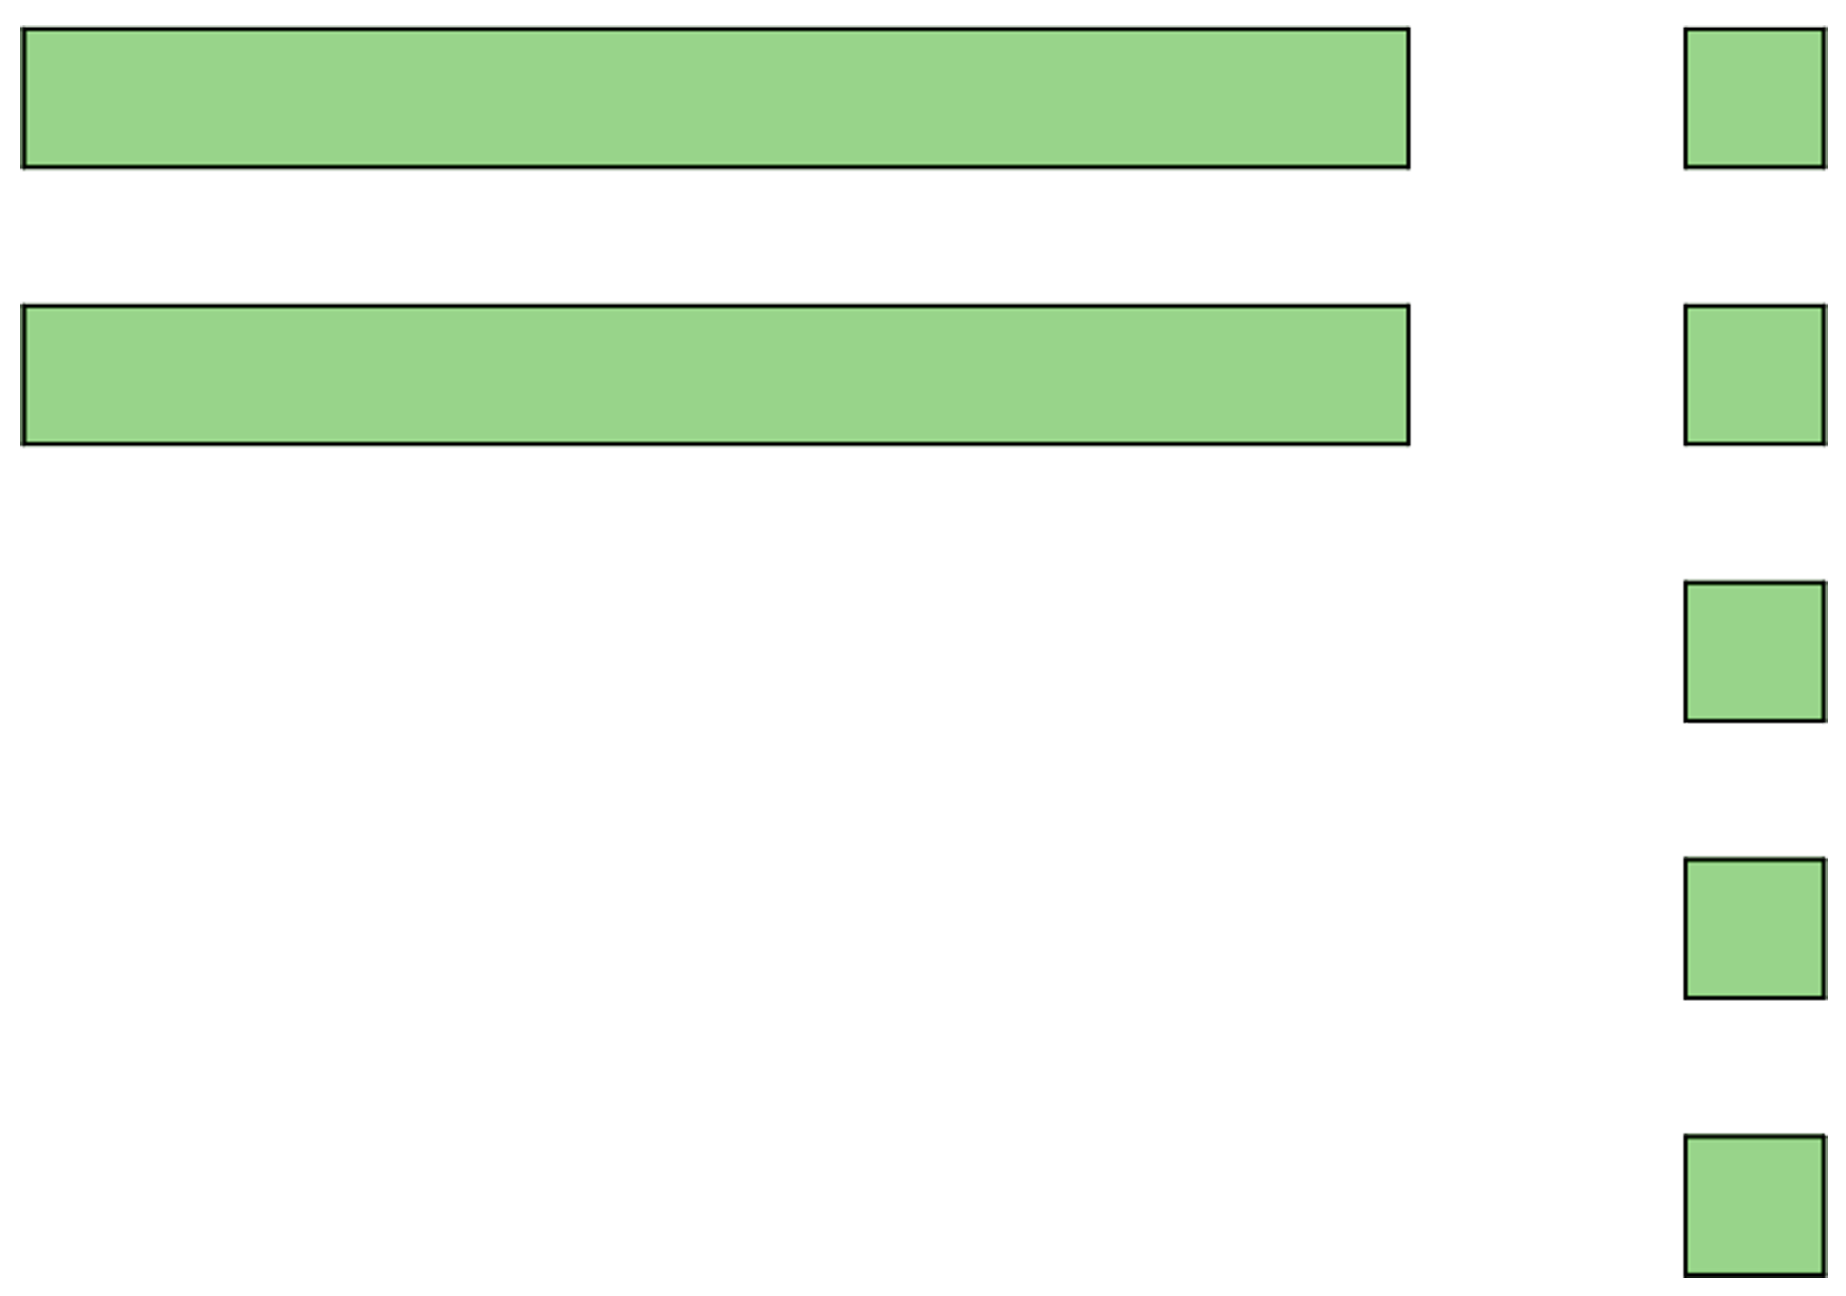
Here is the diagram that Han drew to represent 0.25. Draw a different diagram that represents 0.25. Explain why your diagram and Han’s diagram represent the same number.
-
For each of these numbers, draw or describe two different diagrams that represent it.
- 0.1
- 0.02
- 0.43
-
Use diagrams of base-ten units to represent the following sums and find their values. Think about how you could use as few units as possible to represent each number.
-
\(0.03 + 0.05\)
-
\(0.06 + 0.07\)
-
\(0.4 + 0.7\)
-
Student Response
For access, consult one of our IM Certified Partners.
Launch
Give students 1 minute of quiet time to study the diagrams and notice how they are structured. Then, have students identify the value of various units by pointing to them. For example, point to the medium square, and ask what it represents and how it relates to the large rectangle. Once students are familiar with the various pieces and their values, give students 10 minutes of quiet work time. Provide access to physical pattern blocks, cut-up paper copies of the base-ten figures, or the digital applet for representing base-ten numbers, if needed.

Supports accessibility for: Conceptual processing
Student Facing
You may be familiar with base-ten blocks that represent ones, tens, and hundreds. Here are some diagrams that we will use to represent base-ten units.
- A large square represents 1 one.
- A medium rectangle represents 1 tenth.
- A medium square represents 1 hundredth.
- A small rectangle represents 1 thousandth.
- A small square represents 1 ten-thousandth.

- Here is the diagram that Priya drew to represent 0.13. Draw a different diagram that represents 0.13. Explain why both diagrams represent the same number.

- Here is the diagram that Han drew to represent 0.025. Draw a different diagram that represents 0.025. Explain why both diagrams represent the same number.

-
For each number, draw or describe two different diagrams that represent it.
- 0.1
- 0.02
- 0.004
-
Use diagrams of base-ten units to represent each sum. Think about how you could use as few units as possible to represent each number.
-
\(0.03 + 0.05\)
-
\(0.006 + 0.007\)
- \(0.4 + 0.7\)
-
Student Response
For access, consult one of our IM Certified Partners.
Anticipated Misconceptions
Students will need a solid understanding of place value to be successful with the activity. If they are unclear about the terms tenths, hundredths, thousandths, and ten thousandths, review place value before proceding with the activity. Consider having students practice by counting by a certain base-ten unit (6 and 8 tenths, 6 and 9 tenths, 7, 7 and 1 tenth. . .), completing place value charts, reading decimals aloud, or by matching a decimal that is read aloud to its written numerical representation.
Activity Synthesis
Select a few students to share their responses to the questions, or display the correct answers for all to see. Discuss the following questions:
- “Is it always helpful or important to use as few base-ten figures as possible when representing addition of two numbers?” (Yes: fewer pieces mean less counting and smaller likelihood of making a counting mistake. No: once the pieces are bundled, it is harder to see the two numbers that make up the sum.)
- “When can you bundle a base-ten figure?” (When there are at least 10 of a unit.)
- “What would a figure that represents 10 look like?” (An extra-large rectangle, composed of 10 big squares.) “What about 100?” (A giant square made from 10 of the extra-large rectangles representing 10.)
- “Why might using base-ten diagrams for addition be cumbersome with larger multi-digit numbers?” (We would have to draw a lot of squares and rectangles. When there are more units, the diagrams become more complex.)
2.3: Finding Sums in Different Ways (15 minutes)
Optional activity
In this activity, students use symbols and diagrams to find a sum that requires regrouping of base-ten units. Use this activity to give students more explicit instruction on how to bundle smaller units into a larger one and additional practice on using addition algorithm to add decimals.
Again, consider having physical base-ten blocks, a paper version of the base-ten figures, or this digital applet ggbm.at/n9yaWPQj available as alternatives to diagram drawing, or to more concretely illustrate the idea of bundling and unbundling.
Launch
Arrange students in groups of 2. Give groups 4–5 minutes to discuss and answer the first question, and then 7–8 minutes of quiet time to complete the remaining questions. Provide access to base-ten representations, if needed.

Supports accessibility for: Organization; Attention
Student Facing
-
Here are two ways to calculate the value of \(0.26 + 0.07\). In the diagram, each rectangle represents 0.1 and each square represents 0.01.
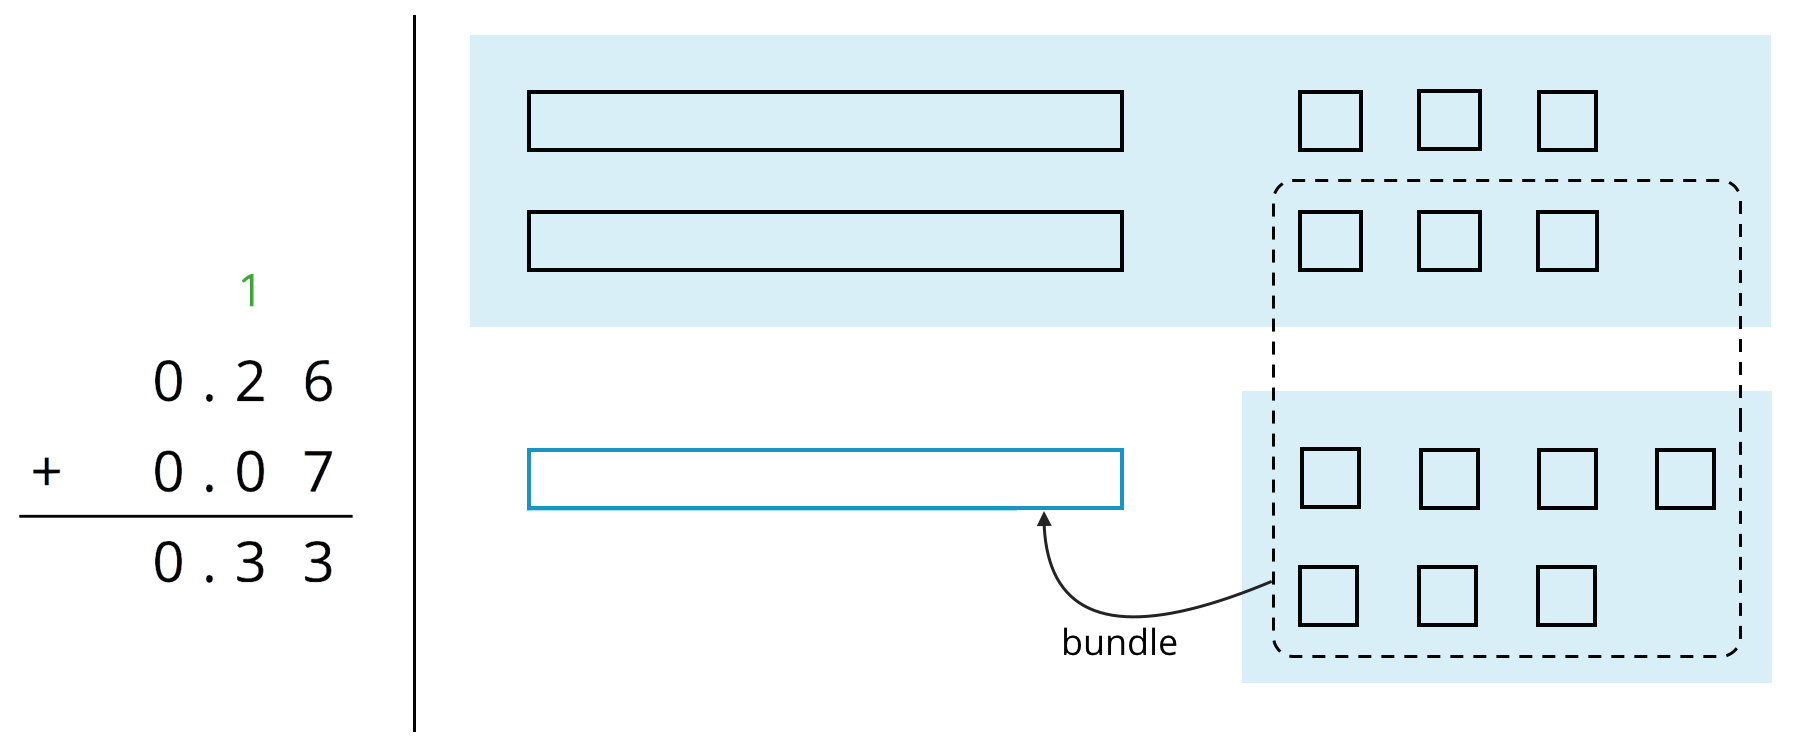
Use what you know about base-ten units and addition of base-ten numbers to explain:
-
Why ten squares can be “bundled” into a rectangle.
-
How this “bundling” is reflected in the computation.
The applet has tools that create each of the base-ten blocks. Select a Block tool, and then click on the screen to place it.

One

Tenth

Hundredth
Click on the Move tool when you are done choosing blocks.

-
-
Find the value of \(0.38 + 0.69\) by drawing a diagram. Can you find the sum without bundling? Would it be useful to bundle some pieces? Explain your reasoning.
-
Calculate \(0.38 + 0.69\). Check your calculation against your diagram in the previous question.
-
Find each sum. The larger square represents 1, the rectangle represents 0.1, and the smaller square represents 0.01.
-
Student Response
For access, consult one of our IM Certified Partners.
Launch
Arrange students in groups of 2. Give groups 4–5 minutes to discuss and answer the first question, and then 7–8 minutes of quiet time to complete the remaining questions. Provide access to base-ten representations, if needed.

Supports accessibility for: Organization; Attention
Student Facing
- Here are two ways to calculate the value of \(0.26 + 0.07\). In the diagram, each rectangle represents 0.1 and each square represents 0.01.

Use what you know about base-ten units and addition to explain:
- Why ten squares can be “bundled” into a rectangle.
- How this “bundling” is represented in the vertical calculation.
- Find the value of \(0.38 + 0.69\) by drawing a diagram. Can you find the sum without bundling? Would it be useful to bundle some pieces? Explain your reasoning.
- Calculate \(0.38 + 0.69\). Check your calculation against your diagram in the previous question.
-
Find each sum. The larger square represents 1.
-
Student Response
For access, consult one of our IM Certified Partners.
Student Facing
Are you ready for more?
A distant, magical land uses jewels for their bartering system. The jewels are valued and ranked in order of their rarity. Each jewel is worth 3 times the jewel immediately below it in the ranking. The ranking is red, orange, yellow, green, blue, indigo, and violet. So a red jewel is worth 3 orange jewels, a green jewel is worth 3 blue jewels, and so on.
-
If you had 500 violet jewels and wanted to trade so that you carried as few jewels as possible, which jewels would you have?
-
Suppose you have 1 orange jewel, 2 yellow jewels, and 1 indigo jewel. If you’re given 2 green jewels and 1 yellow jewels, what is the fewest number of jewels that could represent the value of the jewels you have?
Student Response
For access, consult one of our IM Certified Partners.
Anticipated Misconceptions
If students have difficulty drawing the diagrams to represent bundling, it might be helpful for them to work with actual base-ten blocks, paper printouts of base-ten blocks, or digital base-ten blocks so that they can physically trade 10 hundredths for 1 tenth or 10 tenths for 1 whole.
Activity Synthesis
Focus the whole-class debriefing on the idea of choosing appropriate tools to solve a problem, which is an important part of doing mathematics (MP5). Highlight how drawings can effectively help us understand what is happening when we add base-ten numbers before moving on to a more generalized method. Discuss:
- “In which place(s) did bundling happen when adding 0.38 and 0.69?” (In the hundredth and tenth places.) “Why?” (There is a total of 17 hundredths, and 10 hundredths can be bundled to make 1 tenth. This 1 tenth is added to the 3 tenths and 6 tenths, which makes 10 tenths. Ten tenths can be bundled into 1 one.)
- “How can the bundling process be represented in vertical calculations?” (We can show that the 8 hundredths and 9 hundredths make 1 tenth and 7 hundredths by recording 7 hundredths and writing a 1 above the 3 tenths in 0.38.)
- “Which method of calculating is more efficient?” (It depends on the complexity and size of the numbers. The drawings become hard when there are lots of digits or when the digits are large. The algorithm works well in all cases, but it is more abstract and requires that all bundling be recorded in the right places.)
Design Principle(s): Support sense-making; Maximize meta-awareness
2.4: Representing Subtraction (15 minutes)
Optional activity
In this activity, students use base-ten diagrams and vertical calculations to perform subtraction. As with addition of decimals, students need to pay close attention to place value when calculating differences. They identify the need to pair the digits of like base-ten units when subtracting decimals and why it is helpful to line up the decimal points.
There is no decomposition or “unbundling” of a base-ten unit into smaller units in this activity, that will come up in the next activity.
As in previous activities, consider having students use physical base-ten blocks (if available), a paper version of the base-ten diagrams (from the blackline master), or this digital applet https://ggbm.at/n9yaWPQj, as alternatives to drawing diagrams.
Launch
Arrange students in groups of 2. Review that the term “difference” means the result of a subtraction. Tell students that in this lesson they will use base-ten diagrams to determine differences and, in the diagrams, use X’s to indicate what is being taken away.
Give students 10 minutes of quiet work time. Ask them to pause after the third question, share their diagrams and calculations with a partner, and resolve any differences before finishing the activity.
Student Facing
-
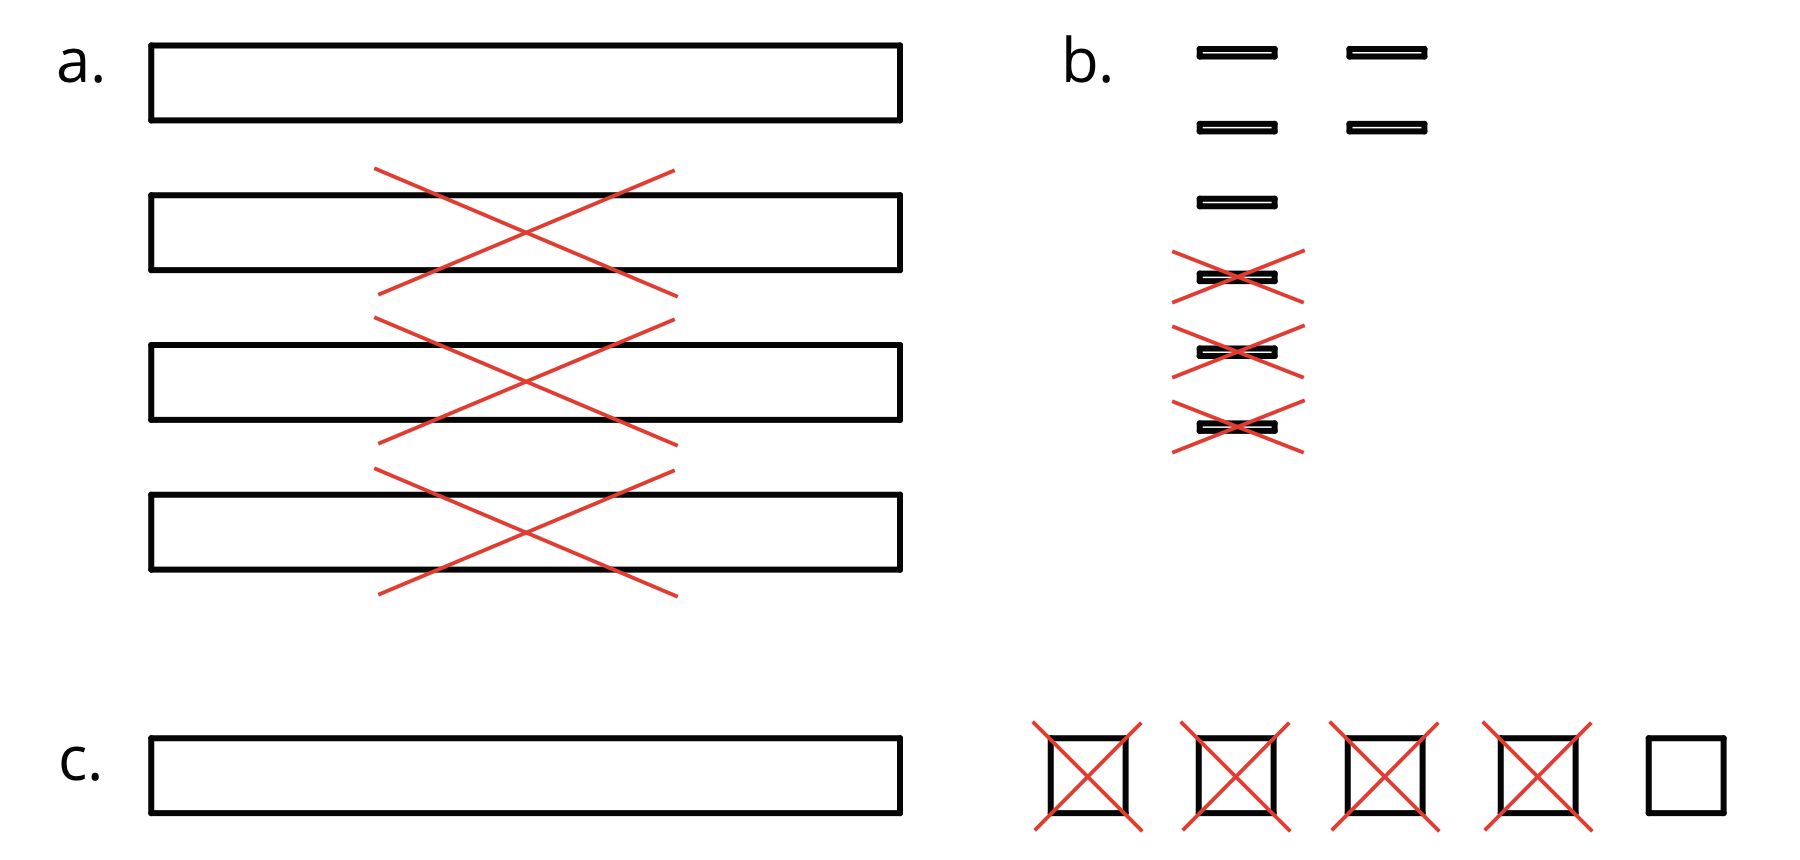
Here are diagrams that represent differences. Removed pieces are marked with Xs. The larger rectangle represents 1 tenth. For each diagram, write a numerical subtraction expression and determine the value of the expression.
-
Express each subtraction in words.
-
\(0.05 - 0.02\)
-
\(0.024 - 0.003\)
-
\(1.26 - 0.14\)
-
-
Find each difference by drawing a diagram and by calculating with numbers. Make sure the answers from both methods match. If not, check your diagram and your numerical calculation.
-
\(0.05 - 0.02\)
-
\(0.024 - 0.003\)
- \(1.26 - 0.14\)
-
Student Response
For access, consult one of our IM Certified Partners.
Activity Synthesis
The goal of the whole-class discussion is to make sure students understand that when we perform subtraction without diagrams, it is essential to pay close attention to place value in the numbers. Select a few students to share their responses and reasonings for the last two questions. Highlight how the different sizes of the base-ten units in the diagram informs how we subtract one decimal from another. Then, discuss:
- How are addition and subtraction of decimal numbers similar? (It is important to attend to place value and to add or subtract numbers that represent the same base-ten units.)
- Did anyone find different results when using diagrams versus when calculating vertically? If so, where did the error happen and what might have caused it?
- Why is it helpful to line up the decimal points when calculating differences of decimals? (Aligning the points helps us align digits with the same place value.)
- Which is more efficient, using base-ten blocks or calculating the difference? (For some numbers, such as \(1.26 - 0.14\), both methods are efficient. If the numbers contain more decimal places or larger digits, the diagrams would take a lot of time to draw.)
Lesson Synthesis
Lesson Synthesis
One main idea in this lesson is that addition of decimals beyond hundredths works the same way as addition of whole numbers and decimals up to hundredths: all of them rely on combining the values of like base-ten units. Another main idea is bundling: we can group 10 of any base-ten unit into 1 of a base-ten unit that is 10 times as large. The methods we used for adding in the lesson reflect both ideas.
- How do the pieces representing ones, tenths, hundredths, etc. of a base-ten diagram help us add two decimals? (We can combine the pieces that represent the same unit and see the value for each decimal place.)
- When might we want to bundle some of the base-ten pieces? (When we have at least 10 of the same unit.) Why? (It would make it simpler to show or tell the sum.)
- How is adding with vertical calculations similar to and different from using base-ten diagrams? (We still combine numbers based on their place values but without drawing figures to represent each number.)
- When using vertical calculations, how do we make sure that we add like base-ten units? (We line up digits that represent the same place value or line up the decimal point.)
- Which method of calculating is more efficient? (It depends on the size of the numbers, but vertical calculations tend to be quicker. Drawing becomes hard when the numbers have lots of digits, e.g., 2.315641, or when the digits are large, e.g., 9.999.)
2.5: Cool-down - Why or Why Not? (5 minutes)
Cool-Down
For access, consult one of our IM Certified Partners.
Student Lesson Summary
Student Facing
Base-ten diagrams represent collections of base-ten units—tens, ones, tenths, hundredths, etc. We can use them to help us understand sums of decimals.
Suppose we are finding \(0.08 + 0.13\). Here is a diagram where a square represents 0.01 and a rectangle (made up of ten squares) represents 0.1.
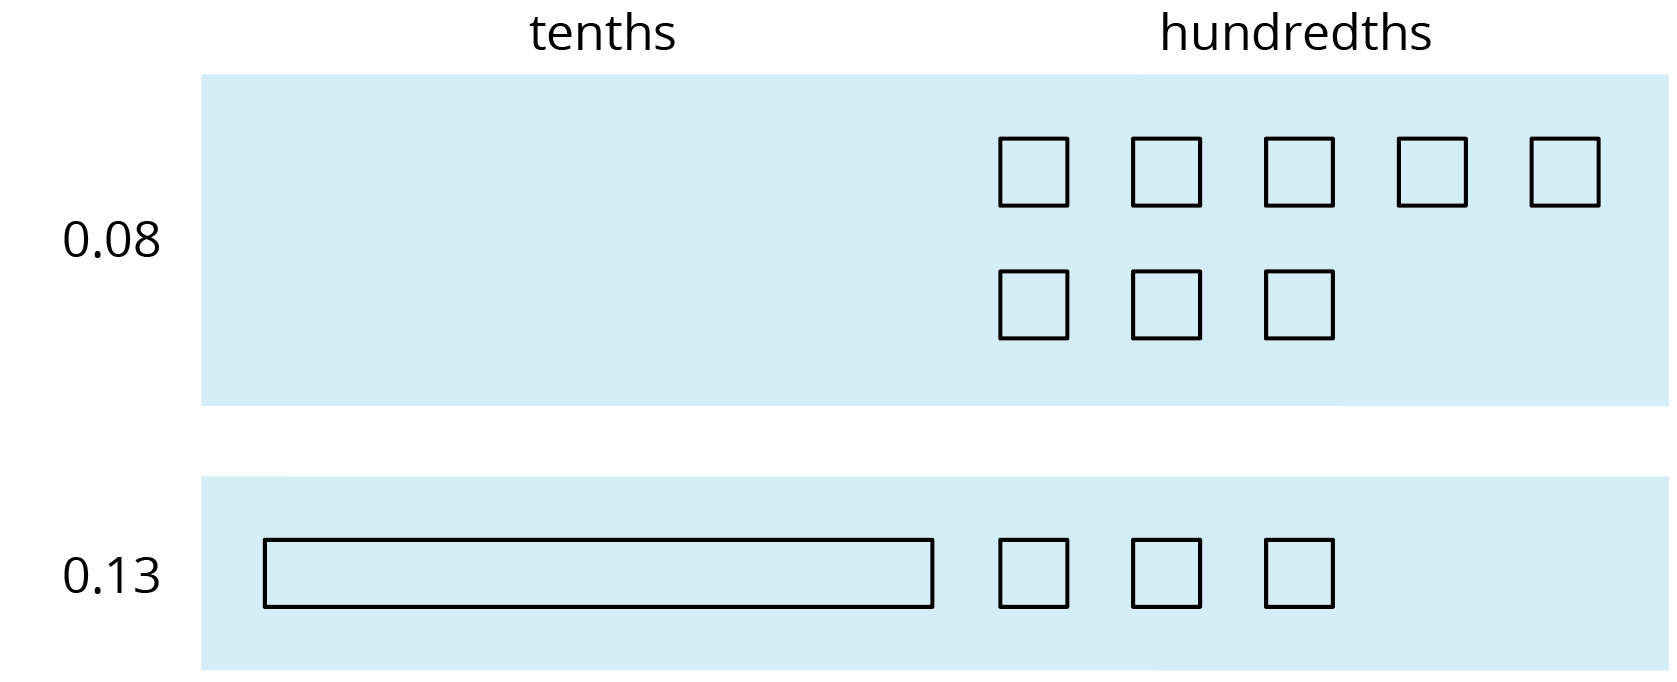
To find the sum, we can “bundle” (or compose) 10 hundredths as 1 tenth.
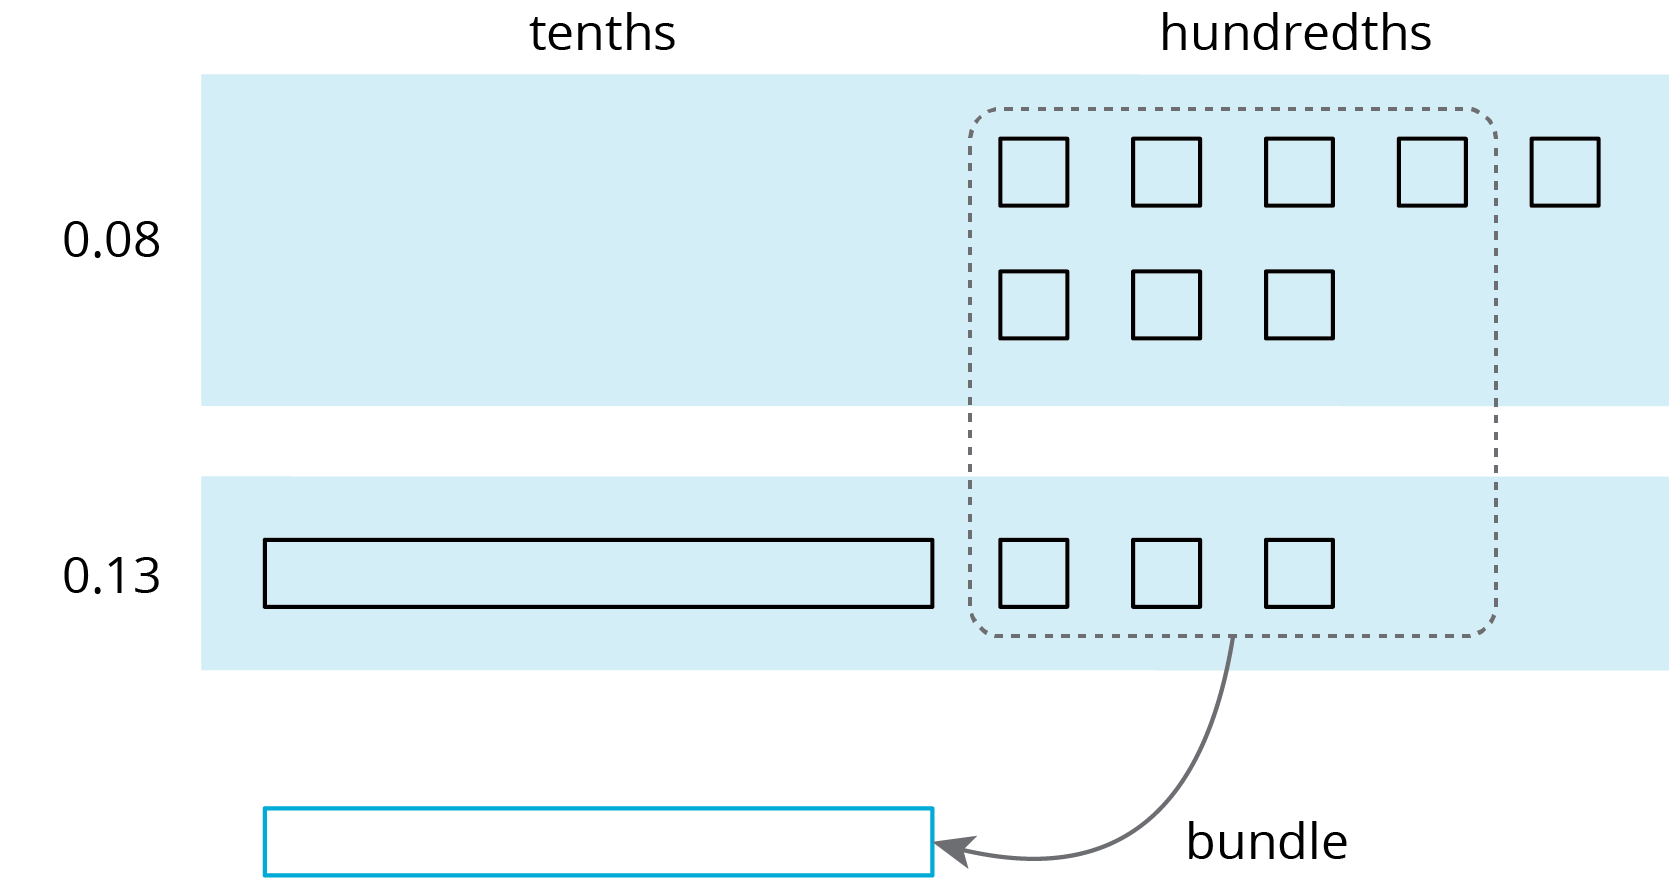
We now have 2 tenths and 1 hundredth, so \(0.08 + 0.13 = 0.21\).

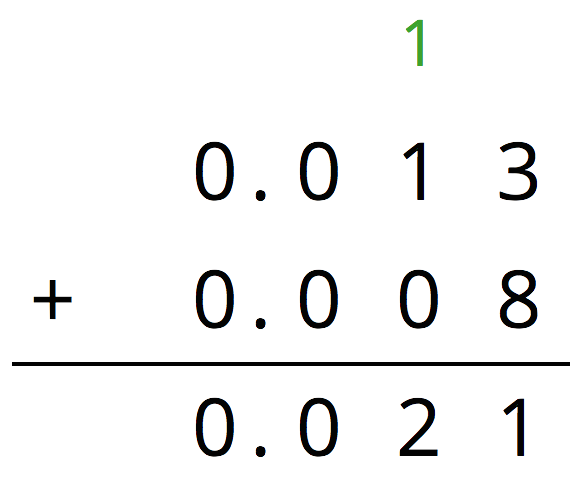
We can also use vertical calculation to find \(0.08 + 0.13\).
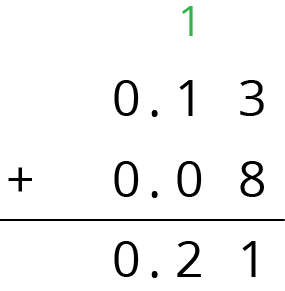
Notice how this representation also shows 10 hundredths are bundled (or composed) as 1 tenth.
This works for any decimal place. Suppose we are finding \(0.008 + 0.013\). Here is a diagram where a small rectangle represents 0.001.
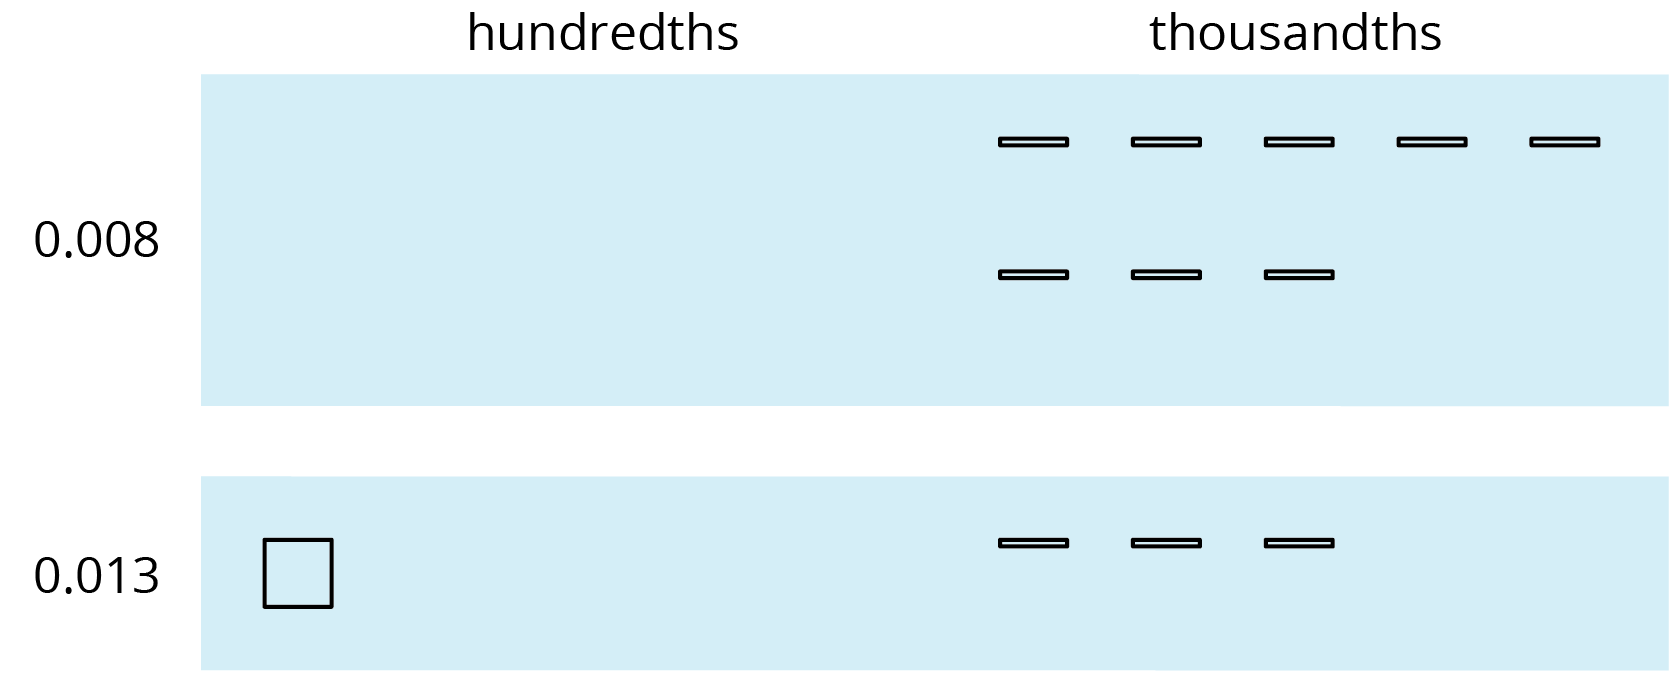
We can “bundle” (or compose) 10 thousandths as 1 hundredth.
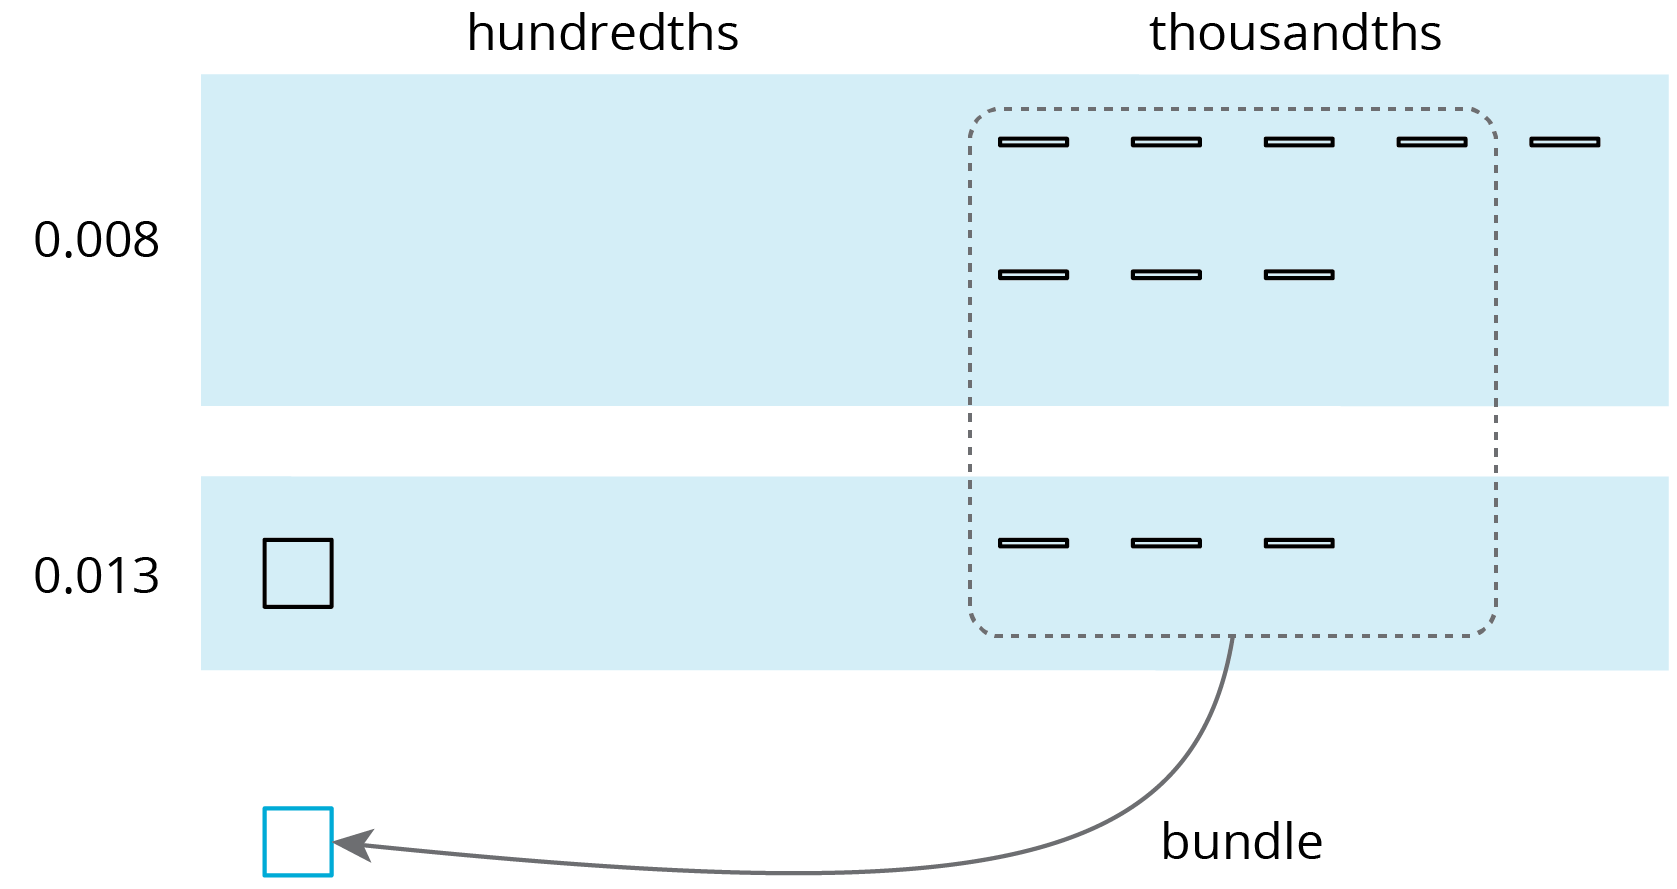
The sum is 2 hundredths and 1 thousandth.

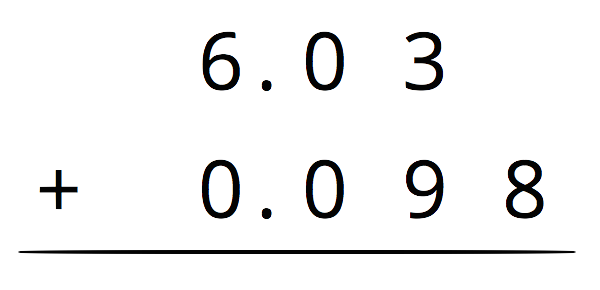
Here is a vertical calculation of \(0.008 + 0.013\).
