Lesson 14
Using Operations on Decimals to Solve Problems
14.1: Close Estimates (5 minutes)
Warm-up
The purpose of this warm-up is to encourage students to think about the reasonableness of a quotient by looking closely at the values of the dividend and divisor. The digits in the answer choices reflect those in the actual answer. While some students may try to mentally evaluate each one precisely, encourage them to think about their answer in relation to the numbers in the expressions. For each expression, ask students if the actual answer would be greater than or less than their estimate and how they know.
Launch
Display one expression at a time, or ask students to work on one expression at a time and begin when cued. Give students 1 minute of quiet think time per question and ask them to give a signal when they have an answer and can explain their strategy. Follow each question with a brief whole-class discussion.
Discuss each problem one at a time with this structure:
- Ask students to indicate which option they chose.
- If everyone agrees on one answer, ask a few students to share their reasoning. Record and display the explanations for all to see. If there is disagreement on an answer, ask students with opposing answers to explain their reasoning to come to an agreement on an answer.
Student Facing
For each expression, choose the best estimate of its value.
-
\(76.2\div15\)
- 0.5
- 5
- 50
-
\(56.34\div48\)
- 1
- 10
- 100
-
\(124.3\div 20\)
- 6
- 60
- 600
Student Response
For access, consult one of our IM Certified Partners.
Activity Synthesis
Ask students to share their general strategies for these problems. To involve more students in the conversation, consider asking:
- “Who can restate ___’s reasoning in a different way?”
- “Did anyone solve the problem the same way but would explain it differently?”
- “Did anyone solve the problem in a different way?”
- “Does anyone want to add on to _____’s strategy?”
- “Do you agree or disagree? Why?”
14.2: Applying Division with Decimals (15 minutes)
Optional activity
In this activity, students practice calculating quotients of decimals by multiplying both the divisor and the dividend by an appropriate power of 10. Then, they extend their practice to calculate quotients of decimals in real-world contexts. Problem A reiterates earlier experiences with the “how much is in each group” and “how many groups” interpretations of division. Problem B recalls students’ prior work with ratios and determining rate of speed. While students can use ratio techniques (e.g. a ratio table) to answer these questions, encourage them to use division of decimals. The application of division to solve real world problems illustrates MP4.
Launch
Arrange students in groups of 3–5. Assign each group Problem A or B and have students circle the problem they are assigned. Give groups 5–7 minutes to work on their assigned problem. If time permits, consider giving students access to tools for creating a visual display. Have them create a simple visual display to showcase their solutions and prepare a short presentation in which they explain their reasoning and calculations.
Give students 2–3 minutes to review one another’s work followed by groups’ presentations of their displays.
Supports accessibility for: Attention; Social-emotional skills
Design Principle(s): Support sense-making; Maximize meta-awareness
Student Facing
Your teacher will assign to you either Problem A or Problem B. Work together as a group to answer the questions. Be prepared to create a visual display to show your reasoning with the class.
Problem A:
A piece of rope is 5.75 meters in length.
-
If it is cut into 20 equal pieces, how long will each piece be?
-
If it is cut into 0.05-meter pieces, how many pieces will there be?
Problem B:
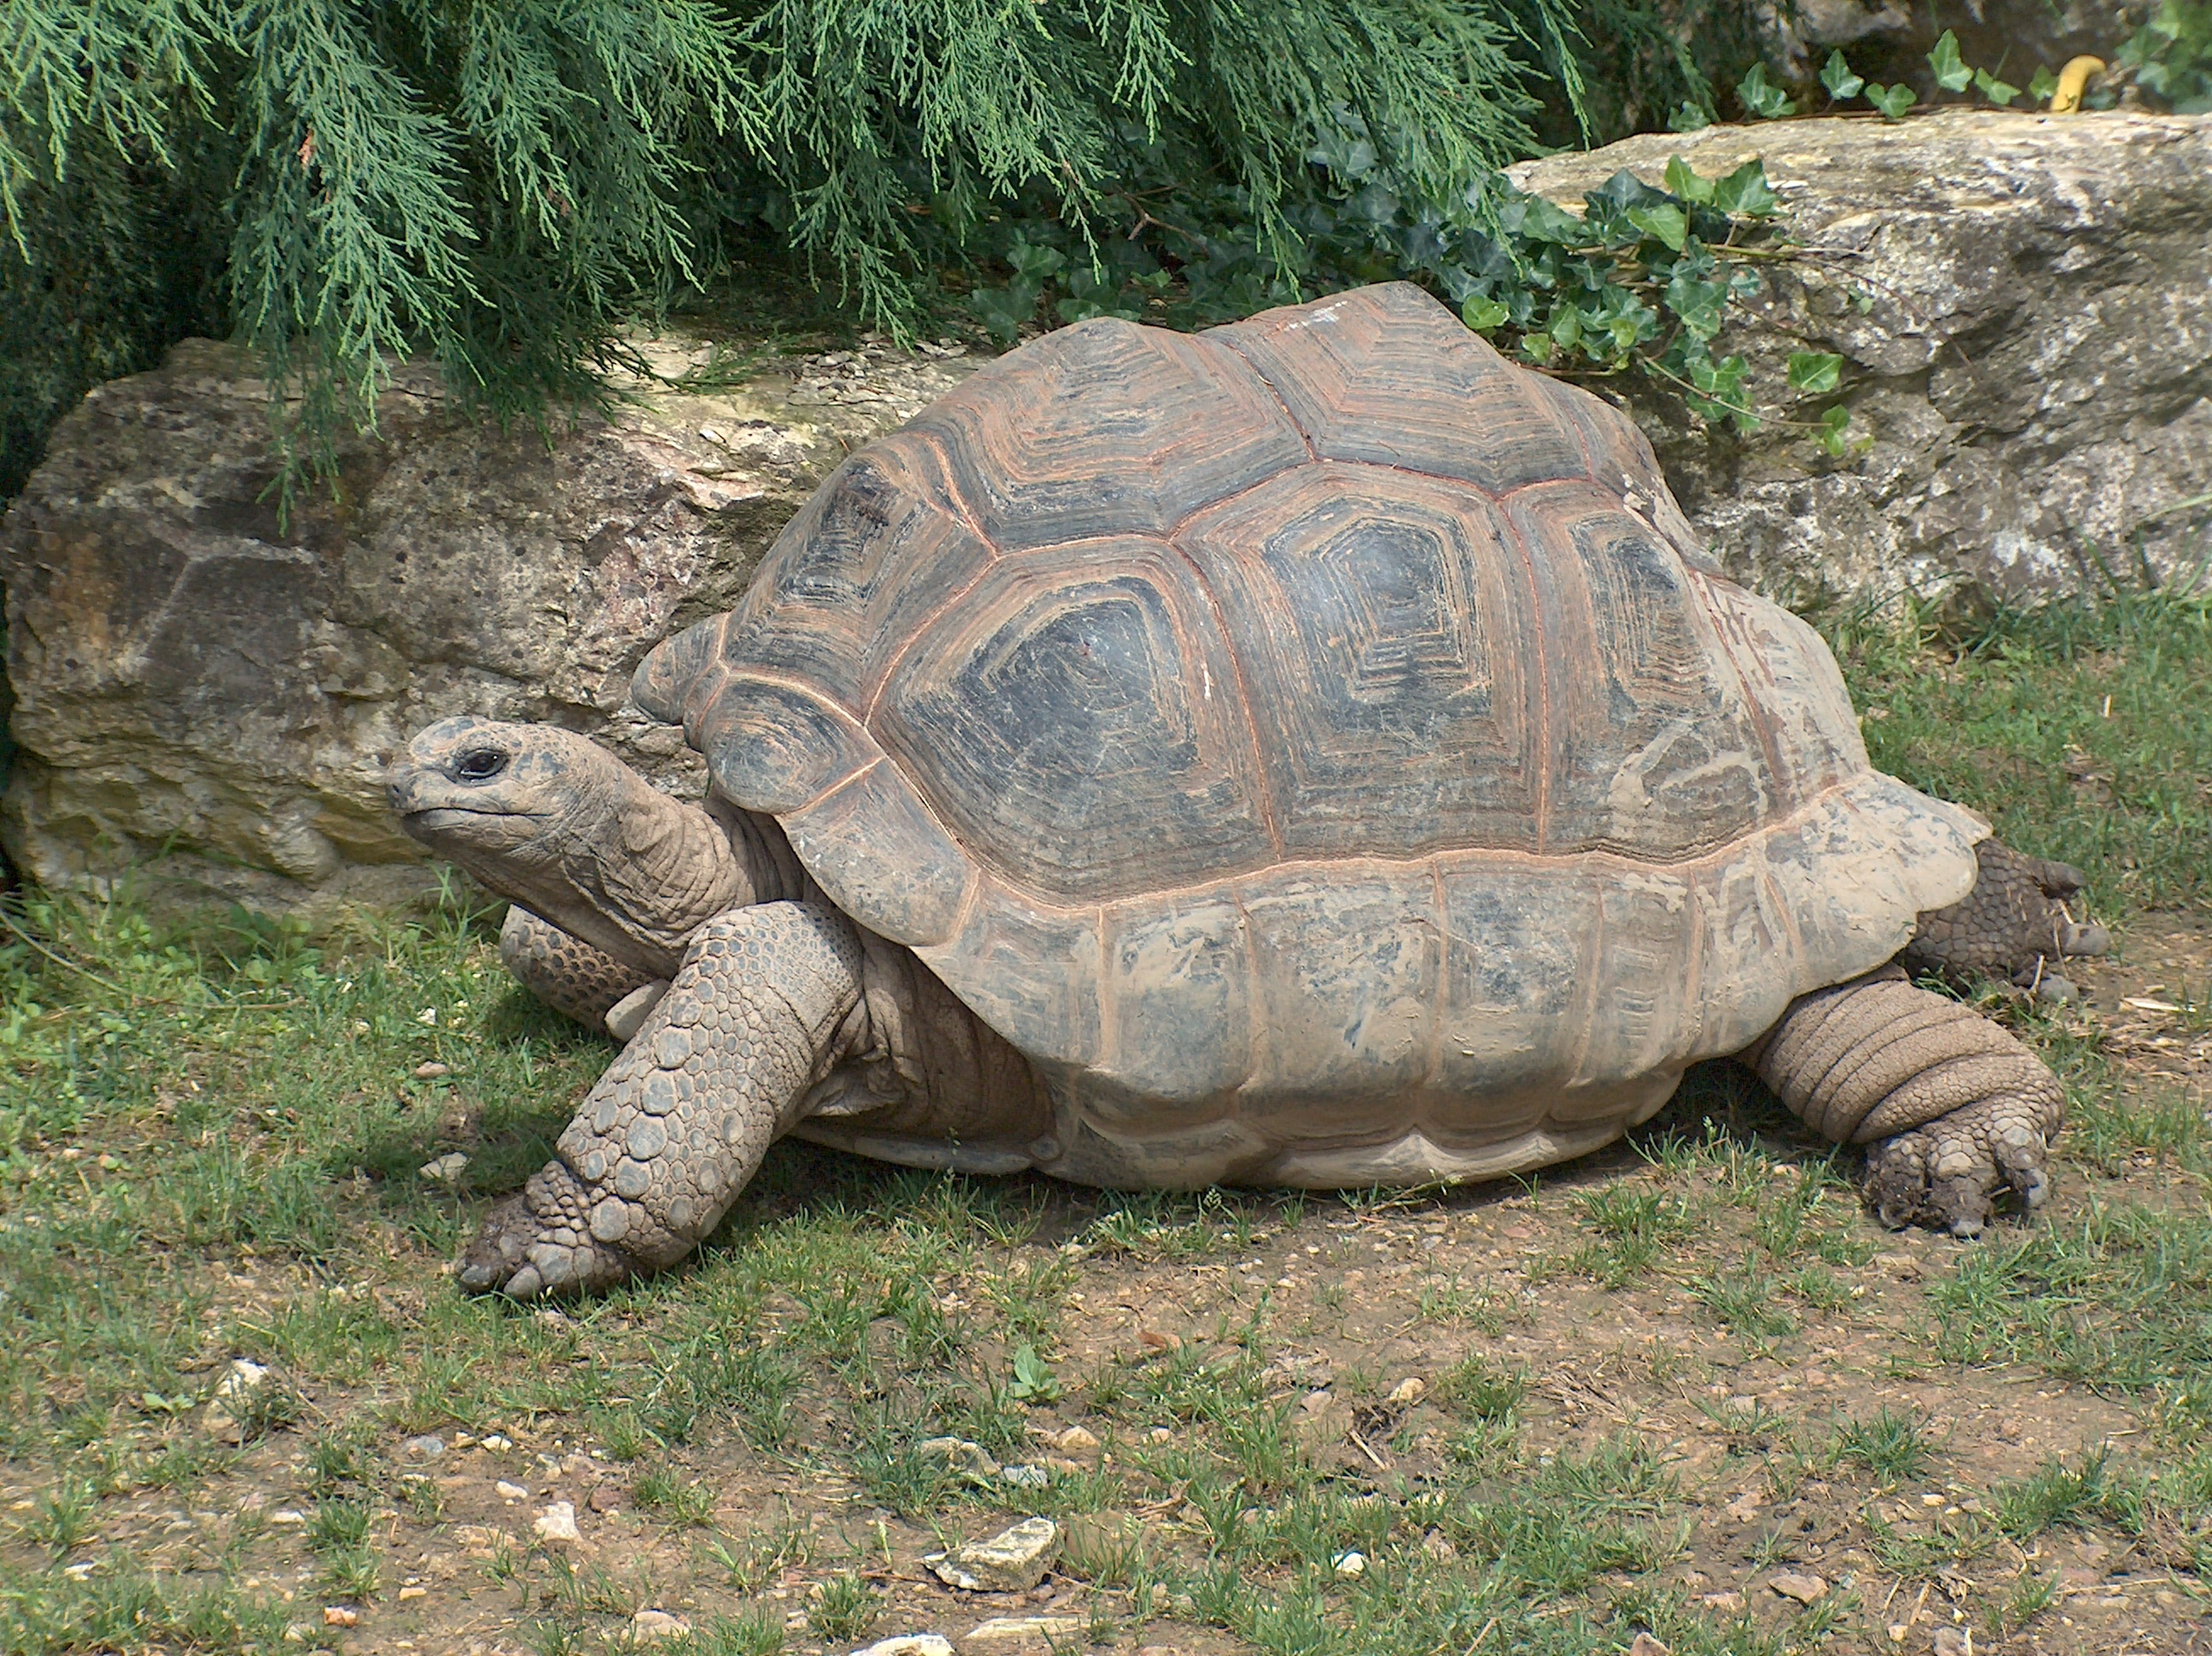
A tortoise travels 0.945 miles in 3.5 hours.
- If it moves at a constant speed, how many miles per hour is it traveling?
-
At this rate, how long will it take the tortoise to travel 4.86 miles?
Student Response
For access, consult one of our IM Certified Partners.
Activity Synthesis
Have each group post their display and read aloud each problem to the class. Then give all students 2–3 minutes to circulate and look at the displays. Ask them to think about how the work on each display is similar to or different from their own group’s work. Afterwards, ask all groups to share their display. As each group presents, be sure they explain how they approached the problems and why these problems apply decimal division.
For Problem A ask:
- “Does the problem use the ‘how many groups’ or ‘how many in each group’ interpretation of division? How do you know?”
For Problem B ask:
- “What is the ratio relationship?” (Speed is the ratio to distance to time.) “If you know the rate per one hour, how can you determine the time it will take to travel any given distance?” (Divide the distance by the unit rate.)
After all groups present, ask:
- “Did groups that solved the same problem approach it in the same way? If not, how did strategies differ?”
- “What methods did students use for calculating quotients of decimals?”
14.3: Distance between Hurdles (20 minutes)
Activity
Sports provide many good contexts for doing arithmetic. This is the first of two activities using a sporting context. Students use arithmetic with decimals to study the 110-meter hurdle race. The first question prompts students to draw a diagram to capture and make sense of all of the given information. The second prompts them to find the distance between hurdles.
As students work, find a variety of work samples (particularly ones that make use of a drawing) to share with the class during the discussion.
Launch
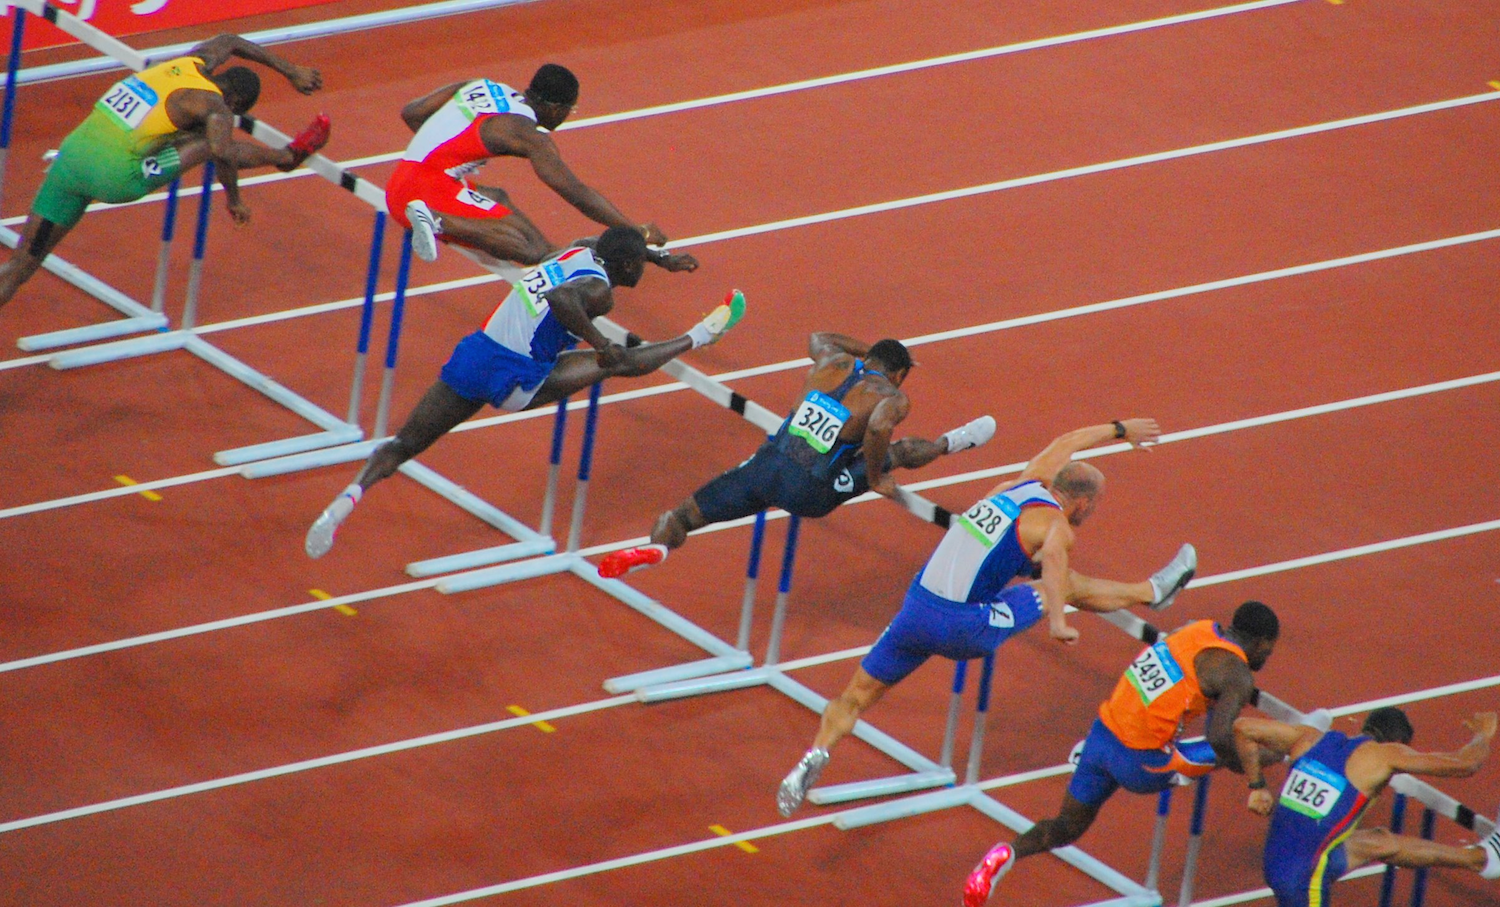
Give a brief overview of hurdle races. Ask students if they have had the chance to watch track and field competitions. Have them describe what a hurdle race is. Display images such as the following or show a short video of a hurdle race.
Tell students that they will now use what they have learned about decimals to solve a couple of problems involving hurdles.
Arrange students in groups of 2. Give students about 5–6 minutes to draw a diagram for the first question and discuss their drawing with their partner. Then, give them another 5–6 minutes to complete the other two questions. Follow with a whole-class discussion.
Supports accessibility for: Memory; Organization
Design Principle(s): Support sense-making; Maximize meta-awareness
Student Facing
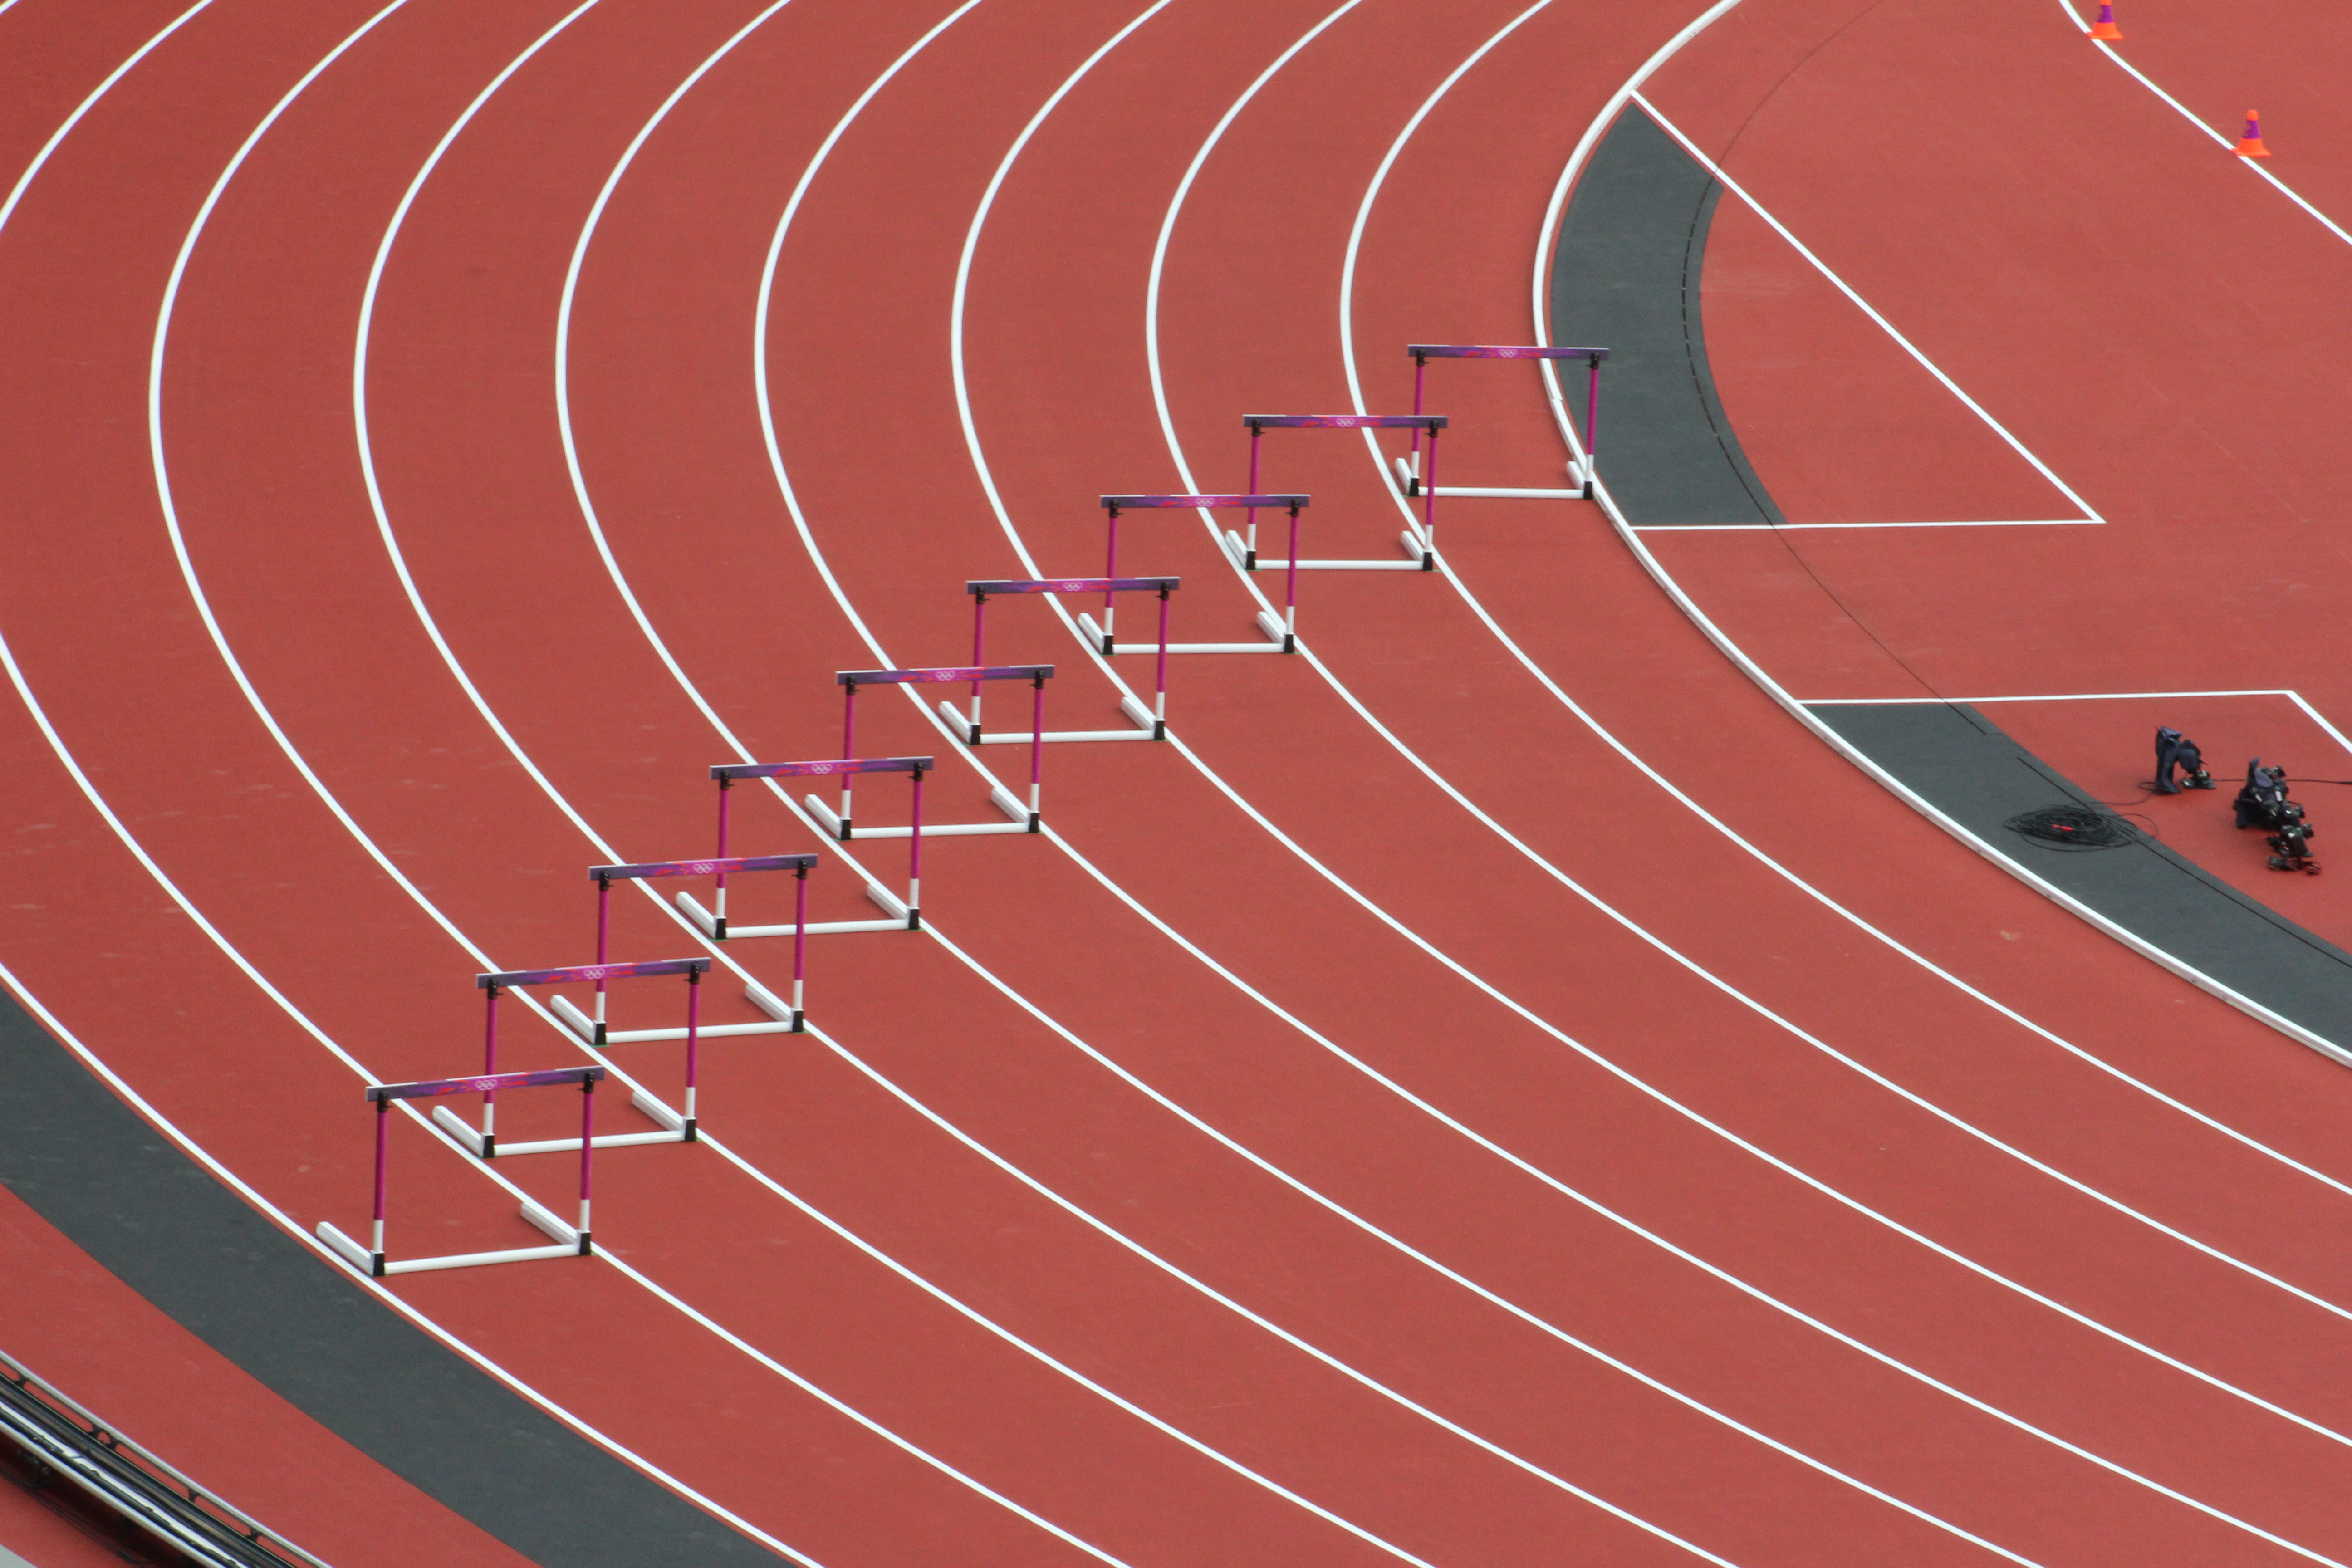
There are 10 equally-spaced hurdles on a race track. The first hurdle is 13.72 meters from the start line. The final hurdle is 14.02 meters from the finish line. The race track is 110 meters long.
-
Draw a diagram that shows the hurdles on the race track. Label all known measurements.
-
How far are the hurdles from one another? Explain or show your reasoning.
-
A professional runner takes 3 strides between each pair of hurdles. The runner leaves the ground 2.2 meters before the hurdle and returns to the ground 1 meter after the hurdle.
About how long are each of the runner’s strides between the hurdles? Show your reasoning.
Student Response
For access, consult one of our IM Certified Partners.
Anticipated Misconceptions
Students may not realize that there are only 9 spaces—not 10 spaces— between 10 hurdles, leading them to miscalculate the distance between hurdles. Have students study the number of spaces in their diagram, or ask them to think about how many spaces are between 2 hurdles, 3 hurdles, 4 hurdles, etc. and extend the pattern to 10 hurdles.
A calculation error in dividing may lead to a quotient with a non-terminating decimal. Look out for arithmetic errors when students calculate the distance between the first and last hurdles (82.26 meters) and when students perform division. If students end up with a non-terminating decimal for their answer, ask them to revisit each step and see where an error might have occurred.
Activity Synthesis
Select one or more previously identified students to share their diagrams for the first question. Ask other students if theirs are comparable to these, and if not, where differences exist. If not mentioned by students, be sure to highlight proper labeling of the parts of the diagram. Then, discuss the second and third questions. For the second question, discuss:
- How many ‘gaps’ are there between the hurdles? (9)
- What is the distance from the first hurdle to the last hurdle? (82.26 meters)
- What arithmetic operation is applied to the two numbers, 9 and 82.26? Why? (Division, because the 10 equally spaced hurdles divide 82.26 meters into 9 equal groups.)
For the third question, discuss:
- How far does the runner go in three strides? How do you know?
- Is \(1.98\) meters (the exact answer) an appropriate answer for the question? Why or why not? (Most likely not, because the runner is not going to control their strides and jumps to the nearest centimeter. About 2 meters would be a more appropriate answer.)
Consider asking a general question about hurdle races: Is it important for the runner that the hurdles be placed as closely as possible to the correct location? The answer is yes, because runners train to take a precise number of strides and to hone their jumps to be as regular as possible. Moving a hurdle a few centimeters is unlikely to create a problem, but moving a hurdle by a meter would ruin the runners’ regular rhythm in the race.
14.4: Examining a Tennis Court (20 minutes)
Optional activity
In this activity, students study the dimensions of a tennis court and apply their understanding of decimals to solve problems in another sporting context. This activity is optional, because it is an opportunity for students to further practice solving problems with decimals.
Visually, it appears as if each half of the tennis court (divided by the net) is a square. Similarly, it appears as if the service line is about halfway between the net and the baseline. Calculations show that in both cases, however, neither half of the tennis court is a square, and that the service line is not half way between the baseline and the net.
Just as with the distances between hurdles in the previous activity, the dimensions of a tennis court are very precisely determined. It is also very important for professional tennis players to regularly play on courts that have consistent dimensions, as the smallest differences could affect whether the ball is in or out. The third question gets at how small the lines are, compared to the full service box.
There are some subtleties in this task related to measurement in the real world and the idealized version in the task. On a tennis court, the lines have width. For the first two questions of the task, the strips can be taken as dimensionless lines. In the final questions, students deal explicitly with these strips.
Launch
Give a brief introduction to tennis and tennis courts. Ask students if they play tennis or have ever watched a tennis match. Look at the picture of the tennis court and discuss the purpose of the boundary lines. Have students locate various sections of the court by pointing to rectangles, parallel segments, right angles, and the service box. (More detailed measurements for the parts of a tennis court can be found online.)
Keep students in groups of 2. Give students 2 minutes of quiet time to read and think about how they might approach the questions. Have them share their thinking with a partner for another 2 minutes. Then, give students 7–8 minutes to complete the questions. Follow with a whole-class discussion.
Design Principle(s): Maximize meta-awareness; Cultivate conversation
Student Facing
Here is a diagram of a tennis court.
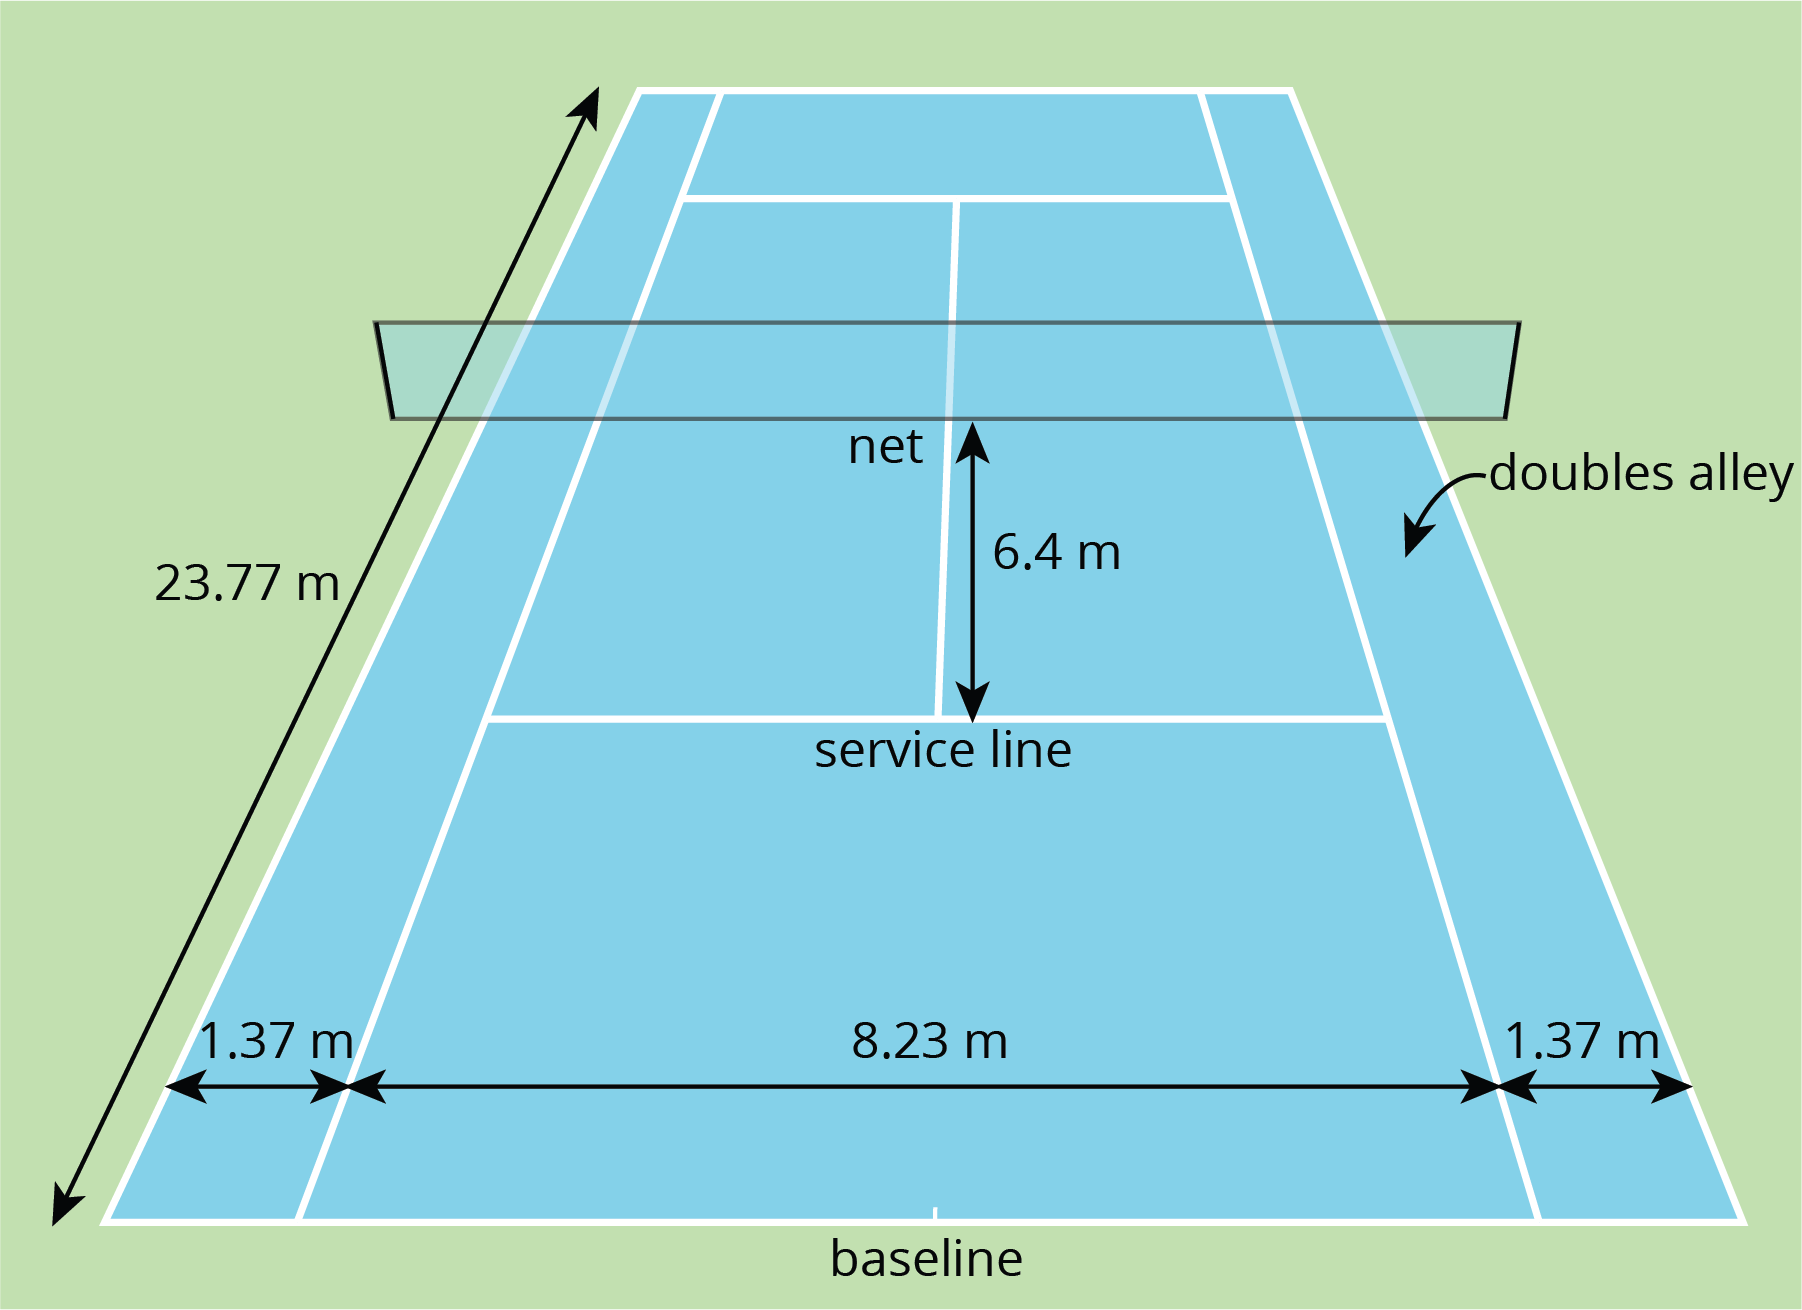
The full tennis court, used for doubles, is a rectangle. All of the angles made by the line segments in the diagram are right angles.
- The net partitions the tennis court into two halves. Is each half a square? Explain your reasoning.
- Is the service line halfway between the net and the baseline? Explain your reasoning.
-
Lines painted on a tennis court are 5 cm wide. A painter made markings to show the length and width of the court, then painted the lines to the outside of the markings.
- Did the painter’s mistake increase or decrease the overall size of the tennis court? Explain how you know.
- By how many square meters did the court’s size change? Explain your reasoning.
Student Response
For access, consult one of our IM Certified Partners.
Activity Synthesis
Here is a picture of the tennis court from directly above. In this picture we can see that the service box is not a square but it is difficult to determine, just by looking, whether or not each half of the court is a square:

On the other hand, it is possible to judge, from this picture, that the service line is closer to the baseline than it is to the net.
To reinforce these points, discuss:
- What do you look for to decide if you think a shape is a square? (4 equal sides, 4 right angles.)
- Can you tell by looking whether or not the service box is a square? (Yes, it looks significantly deeper than it is wide.)
- Can you tell by looking whether or not half of the full tennis court is a square? (Answers may vary, but it is close enough that it is not clear one way or another.)
- Would the painter’s mistake change your answers to questions 1 or 2? (No, the sides of the quadrilaterals would all increase by 10 cm and they still would not be squares)
- Would you notice the painter’s mistake if you were playing on the mis-painted court? (A professional player may notice, but an unseasoned player may not because 5 cm is very little compared to 11 meters and 24 meters.)
Lesson Synthesis
Lesson Synthesis
In this lesson, we used decimal operations to solve several problems involving measurements in sports. We noticed that diagrams can help us represent and communicate our mathematical thinking. We also saw that precision in our measurements and calculations matter.
- For which problems did you use a diagram? How did the diagram help you solve the problem?
- For which problems was it appropriate to round and estimate?
- For which problems was a precise answer necessary? For which ones was it not as critical to be precise?
- Find an example of how you applied each of the decimal operations to solve the problems in this lesson.
14.5: Cool-down - Middle School Hurdle Race (5 minutes)
Cool-Down
For access, consult one of our IM Certified Partners.
Student Lesson Summary
Student Facing
Diagrams can help us communicate and model mathematics. A clearly-labeled diagram helps us visualize what is happening in a problem and accurately communicate the information we need.
Sports offer great examples of how diagrams can help us solve problems. For example, to show the placement of the running hurdles in a diagram, we needed to know what the distances 13.72 and 14.02 meters tell us and the number of hurdles to draw. An accurate diagram not only helped us set up and solve the problem correctly, but also helped us see that there are only nine spaces between ten hurdles.
To communicate information clearly and solve problems correctly, it is also important to be precise in our measurements and calculations, especially when they involve decimals.
In tennis, for example, the length of the court is 23.77 meters. Because the boundary lines on a tennis court have a significant width, we would want to know whether this measurement is taken between the inside of the lines, the center of the lines, or the outside of the lines. Diagrams can help us attend to this detail, as shown here.
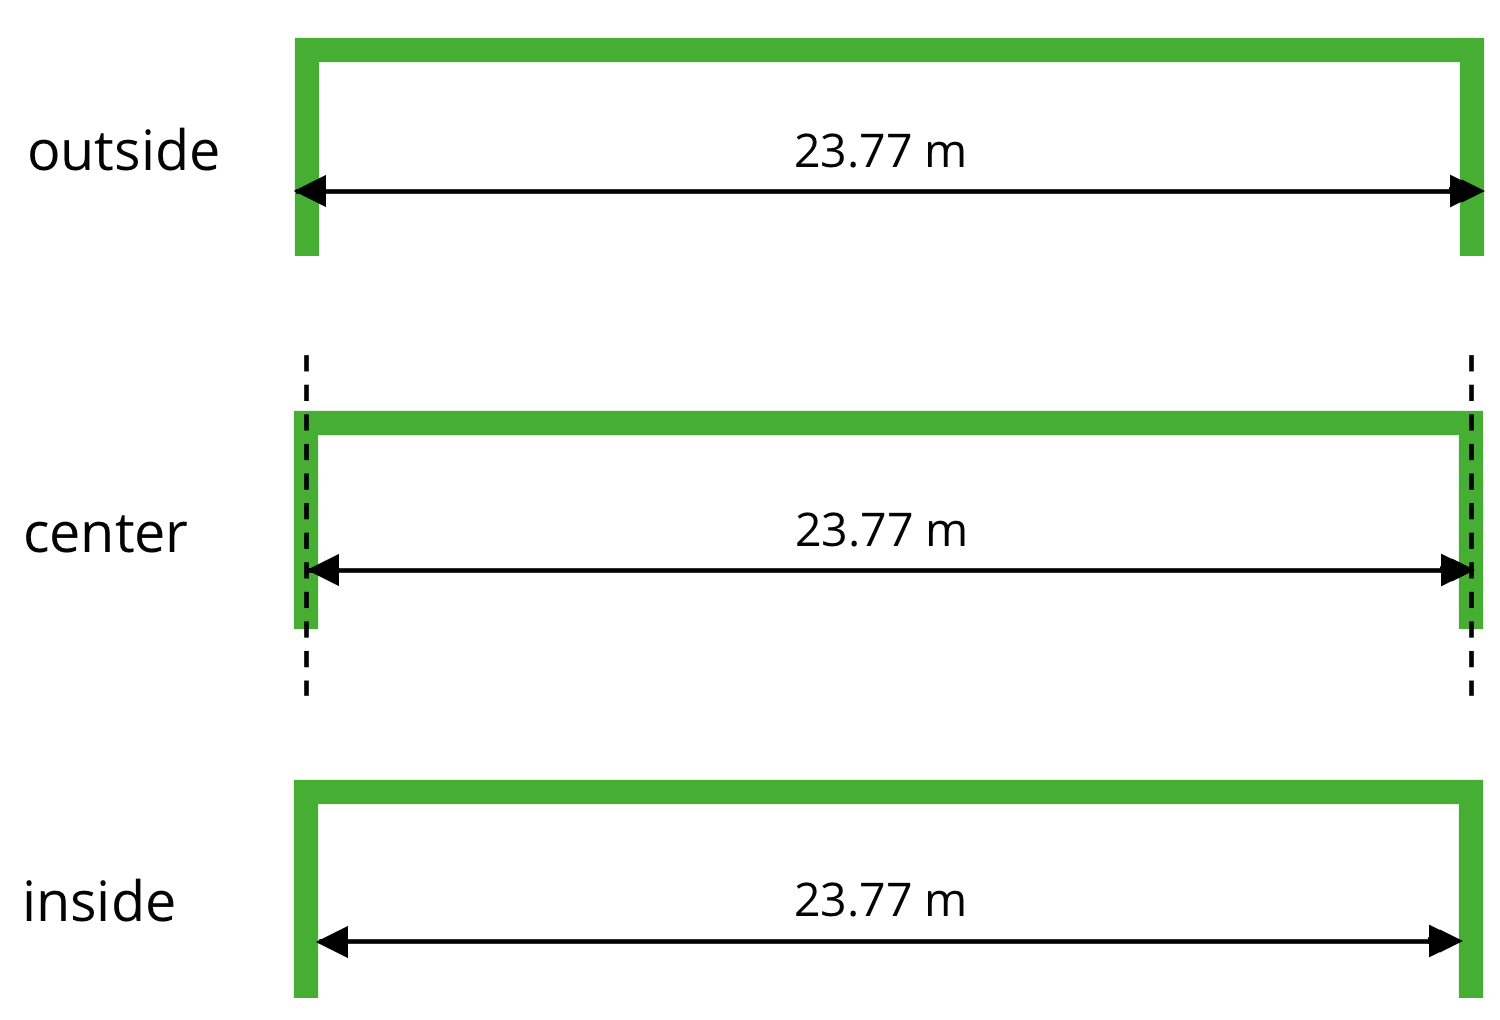
The accuracy of this measurement matters to the tennis players who use the court, so it matters to those who paint the boundaries as well. The tennis players practice their shots to be on or within certain lines. If the tennis court on which they play is not precisely measured, their shots may not land as intended in relation to the boundaries. Court painters usually need to be sure their measurements are accurate to within \(\frac{1}{100}\) of a meter or one centimeter.