Lesson 8
Slopes Don't Have to be Positive
8.1: Which One Doesn’t Belong: Odd Line Out (5 minutes)
Warm-up
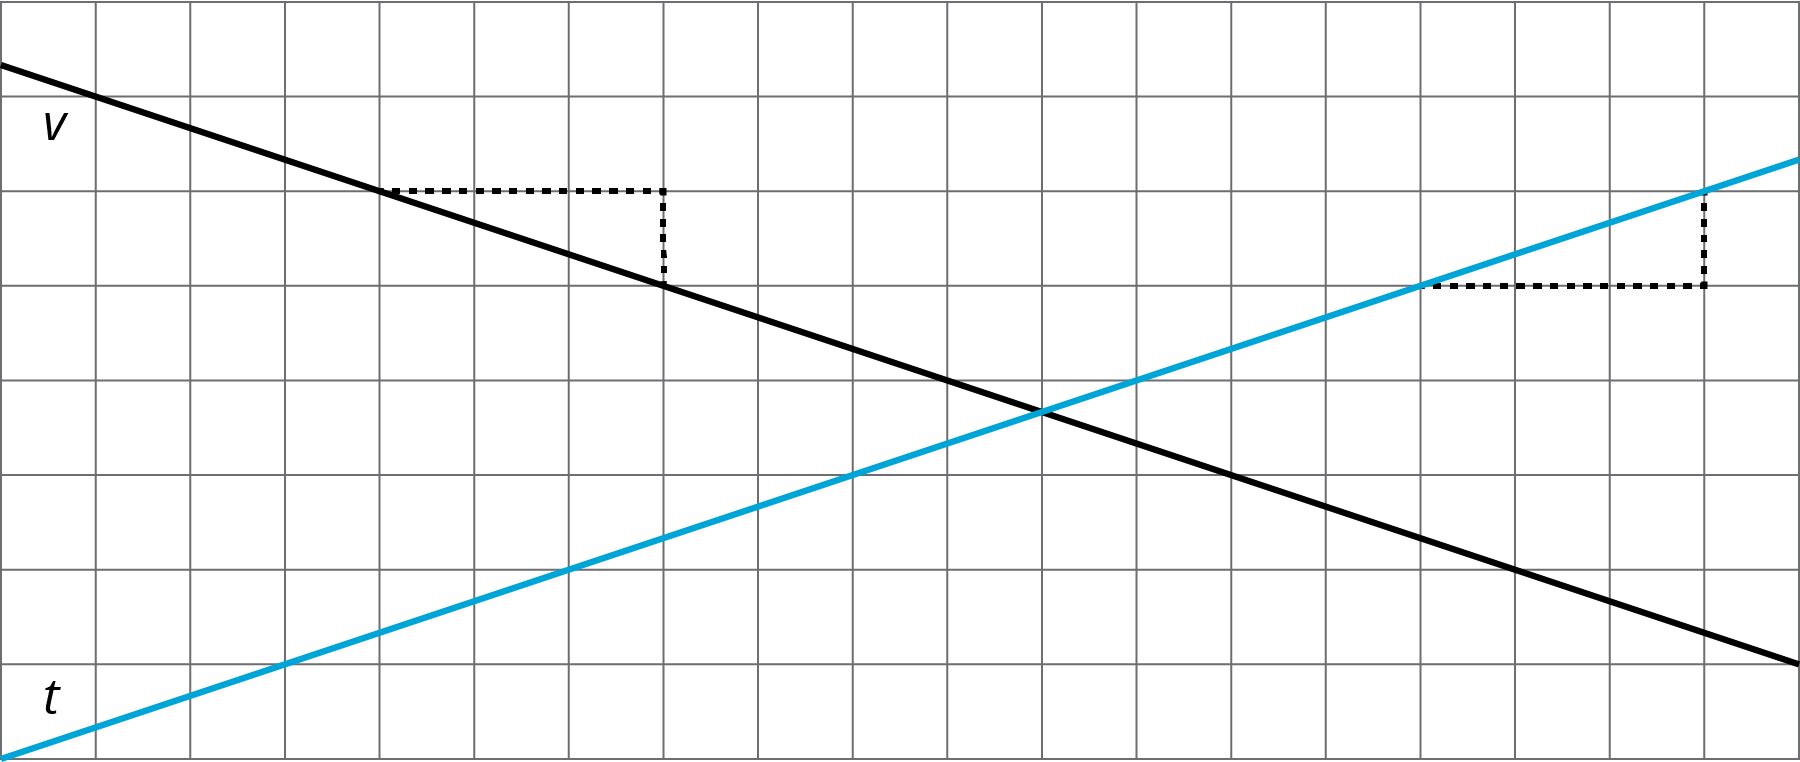
This warm-up prompts students to compare four lines. It invites students to explain their reasoning and hold mathematical conversations, and allows you to hear how they use terminology and talk about lines and their properties. To allow all students to access the activity, each figure has one obvious reason it does not belong. Encourage students to move past the obvious reasons (e.g., line \(t\) has a different color) and find reasons based on geometric properties (e.g., a slope triangle of line \(u\) is not similar to the slope triangles of the other three lines).
So far, we have only considered lines with positive slopes. The purpose of this warm-up is to suggest similarities (same vertical and horizontal lengths of slope triangles) and differences (since they are not parallel, there is something fundamentally different going on here) between lines whose slopes have the same absolute value but opposite signs.
As students share their responses, listen for important ideas and terminology that will be helpful in the work of this lesson. Students may:
- Identify lines that have the same slope.
- Identify points where lines intersect.
- Distinguish between lines with positive and negative values for slope and be able to articulate the difference clearly.
Launch
Arrange students in groups of 2–4 and provide access to geometry toolkits. Display the image of the four lines for all to see. Ask students to indicate when they have noticed one line that does not belong and can explain why. Give students 2 minutes of quiet think time and then time to share their thinking with their group. After everyone has conferred in groups, ask each group to offer at least one reason a particular line doesn’t belong.
Student Facing
Which line doesn’t belong?

Student Response
For access, consult one of our IM Certified Partners.
Activity Synthesis
After students have conferred in groups, invite each group to share one reason why a particular line might not belong. Record and display the responses for all to see. After each response, ask the rest of the class if they agree or disagree. Since there is no single correct answer to the question asking which shape does not belong, attend to students’ explanations and ensure the reasons given are correct.
During the discussion, prompt students to use mathematical terminology (parallel, intersect, slope) correctly. Also, press students on unsubstantiated claims. For example, a student may claim that \(u\) does not belong because it has a different slope. Ask how they know for sure that its slope is different from the other lines. Demonstrate drawing a slope triangle and computing slope.
Based on the work done up to this point in the unit, students are likely to assume that the slope of \(v\) is \(\frac13\). In the discussion, solicit the idea that there is something fundamentally different about line \(v\) compared to the others. You could use informal language like “uphill” and “downhill,” or “tilt direction.” The expressions positive and negative slope do not need to be introduced at this time.
8.2: Stand Clear of the Closing Doors, Please (15 minutes)
Activity
In previous activities with linear relationships, when \(x\) increases the \(y\) value increases as well; adding objects to a cylinder increases the water level and adding money to a bank account increases the balance. The slope of the lines that represent these relationships were positive. In this activity, students see negative slopes for the first time.
In this activity, students answer questions about a public transportation fare card context. After computing the amount left on the card after 0, 1, and 2 rides, they express regularity in repeated reasoning (MP8) to represent the amount remaining on the card after \(x\) rides. They are told that the slope of this line is -2.5, and are prompted to explain why a negative value makes sense.
While the language is not introduced in the task statement, the value of \(x\) for which the money on the card is 0 is called the \(x\)-intercept or horizontal intercept. Unlike the \(y\)-intercept, which can be seen in the equation \(y = 40 - 2.5x\), the \(x\) intercept has to be calculated: it is the value of \(x\) for which \(0 = 40 - 2.5x\).
Launch
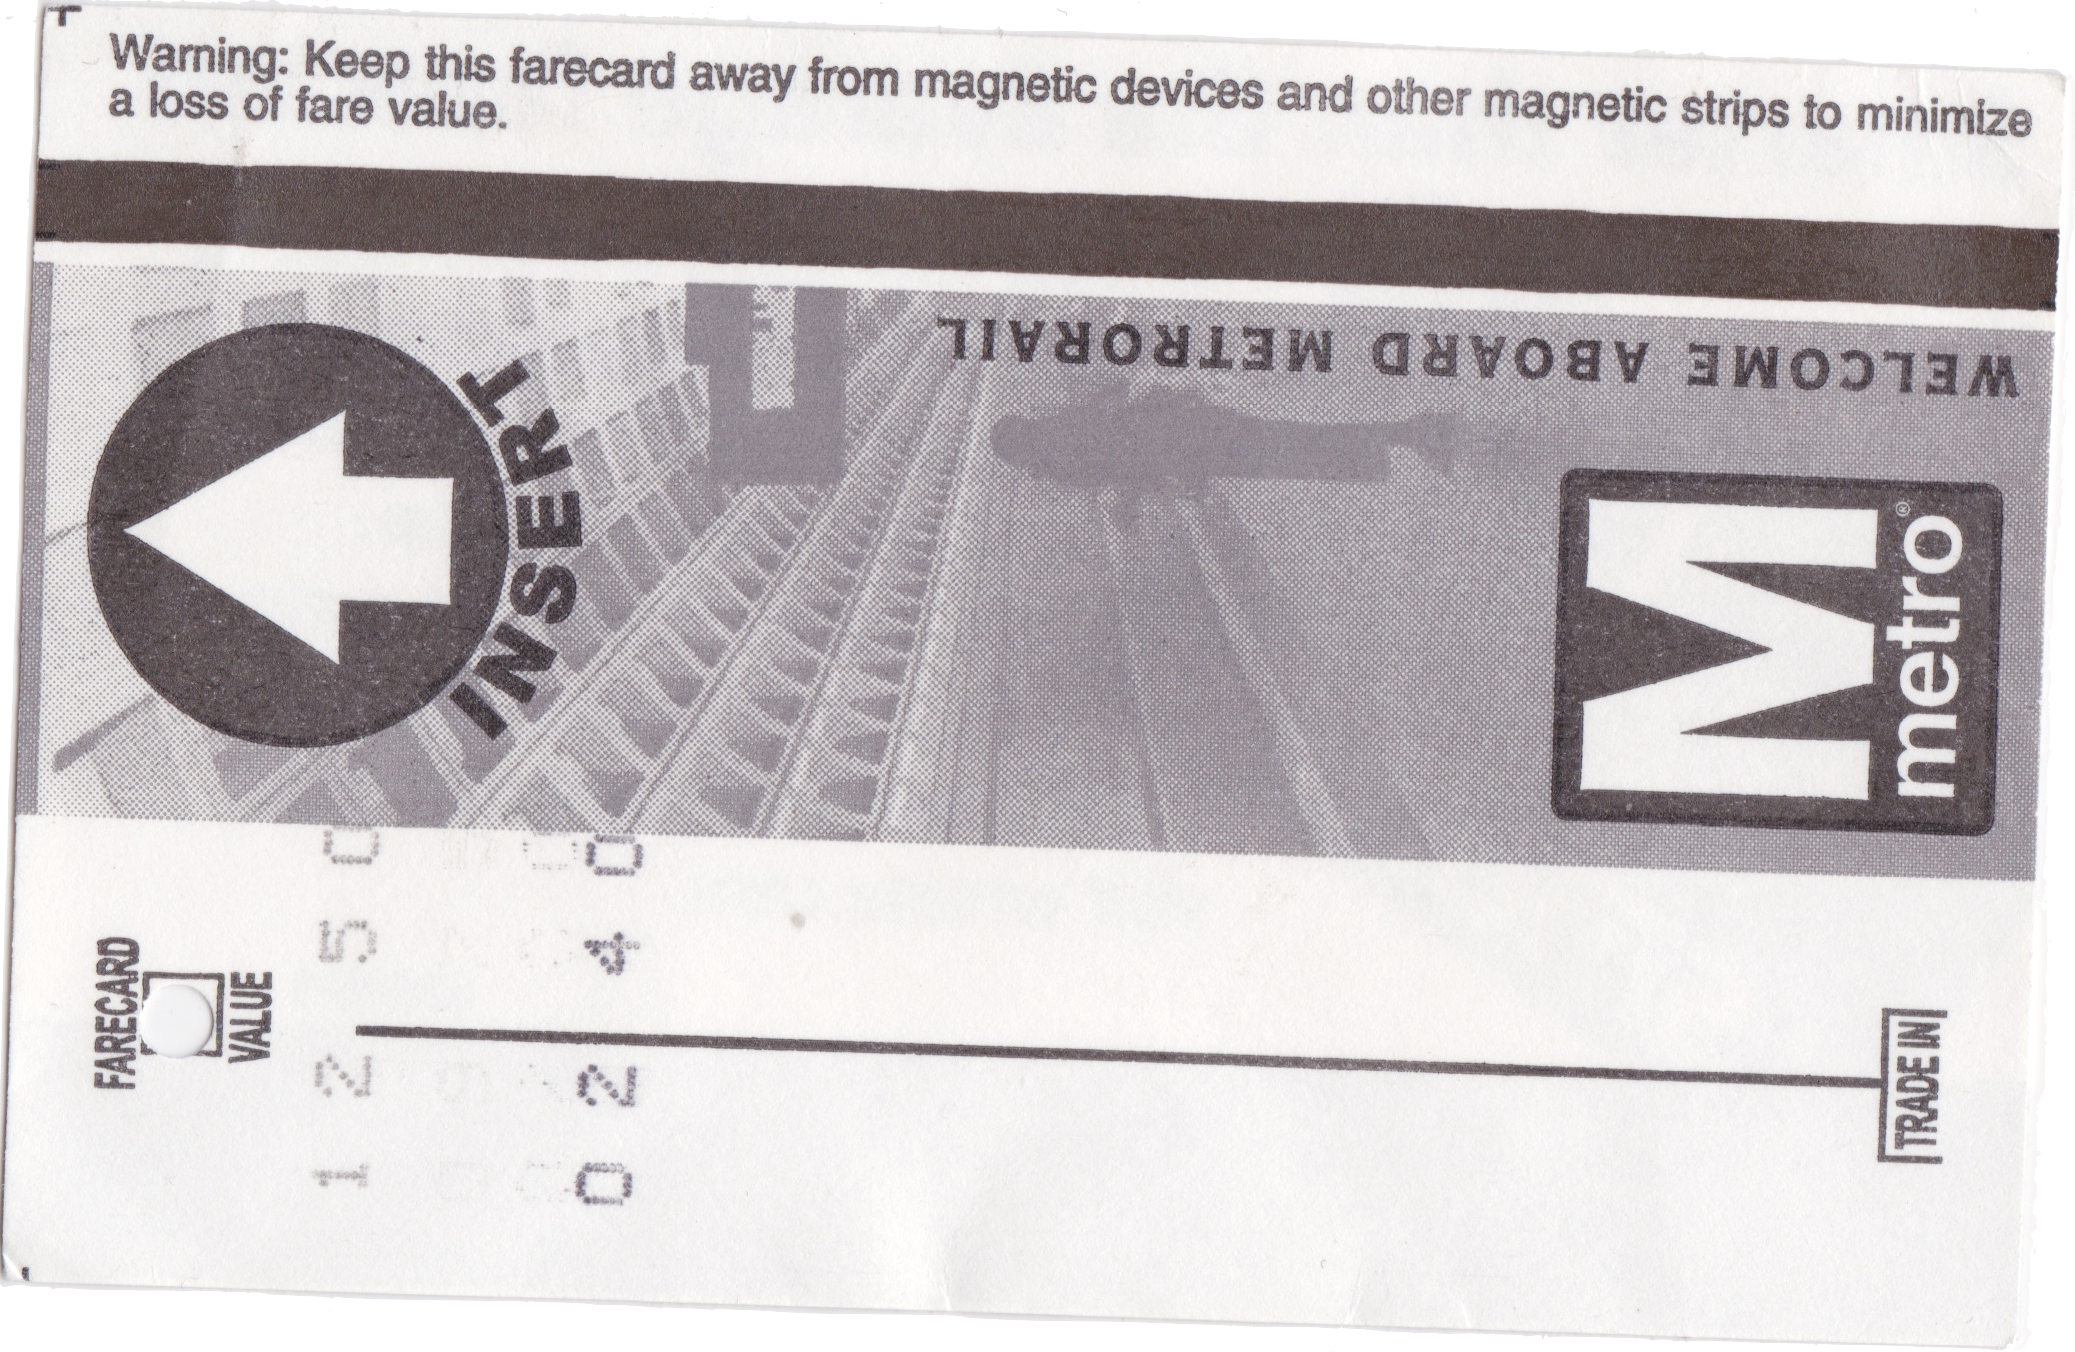
If your students are unlikely to be familiar with public transportation, you may need to give them some quick information about how a fare card works. If possible, prepare some photos related to purchasing and using a fare card. (Some example images are provided, here.)
Explain to students that someone who wants to ride the bus or subway in a city often uses a card like this. The rider pays money which a computer system associates with the card. Every time the rider wants to ride, they swipe the card, and the cost of the ride is subtracted in the computer system from the balance on the card. Eventually, the amount available on the card runs out, and the rider must spend more money to increase the amount available on the card.
Arrange students in groups of 2 and give them 5 minutes of quiet work time. Provide access to rulers. After they have discussed their responses with a partner, discuss why a negative value for the slope makes sense in the context and ways to visually tell whether a line has a positive or negative slope.

Supports accessibility for: Organization; Attention
Student Facing
Noah put $40 on his fare card. Every time he rides public transportation, $2.50 is subtracted from the amount available on his card.
- How much money, in dollars, is available on his card after he takes
- 0 rides?
- 1 ride?
- 2 rides?
- \(x\) rides?
-
Graph the relationship between amount of money on the card and number of rides.
- How many rides can Noah take before the card runs out of money? Where do you see this number of rides on your graph?
Student Response
For access, consult one of our IM Certified Partners.
Launch
If your students are unlikely to be familiar with public transportation, you may need to give them some quick information about how a fare card works. If possible, prepare some photos related to purchasing and using a fare card. (Some example images are provided, here.)
Explain to students that someone who wants to ride the bus or subway in a city often uses a card like this. The rider pays money which a computer system associates with the card. Every time the rider wants to ride, they swipe the card, and the cost of the ride is subtracted in the computer system from the balance on the card. Eventually, the amount available on the card runs out, and the rider must spend more money to increase the amount available on the card.
Arrange students in groups of 2 and give them 5 minutes of quiet work time. Provide access to rulers. After they have discussed their responses with a partner, discuss why a negative value for the slope makes sense in the context and ways to visually tell whether a line has a positive or negative slope.


Supports accessibility for: Organization; Attention
Student Facing
Noah put $40 on his fare card. Every time he rides public transportation, $2.50 is subtracted from the amount available on his card.
-
How much money, in dollars, is available on his card after he takes
- 0 rides?
- 1 ride?
- 2 rides?
- \(x\) rides?
-
Graph the relationship between amount of money on the card and number of rides.
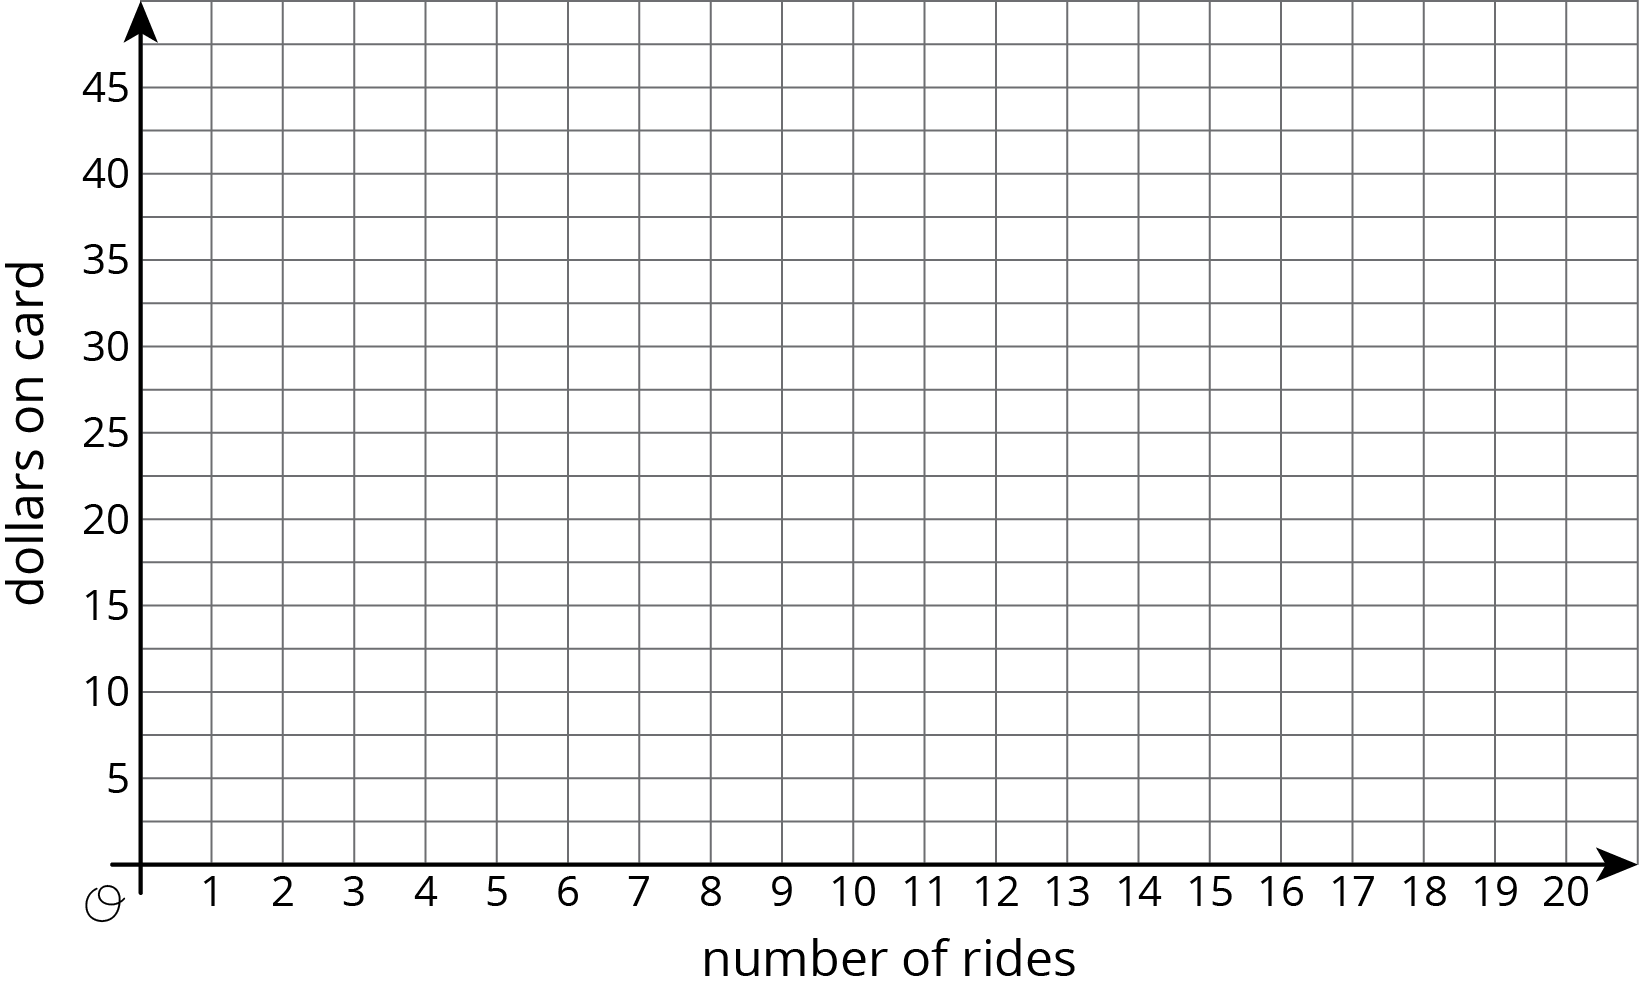
- How many rides can Noah take before the card runs out of money? Where do you see this number of rides on your graph?
Student Response
For access, consult one of our IM Certified Partners.
Activity Synthesis
Ask students, "Why does it make sense to say the slope of this graph is \(\text-2.5\) rather than 2.5?" We can say that the rate of change of the amount on the card is \(\text-2.5\) dollars per ride (for each ride, the amount on the card decreases by 2.5). We can also say the slope of the graph representing the relationship is \(\text-2.5\) (when \(x\) increases by 1, \(y\) decreases by 2.5). Ensure that students can articulate some version of “For every ride, the amount on the card decreased by $2.50, and this is why it makes sense that the slope is \(\text-2.5\).”
Ask students, "If we let \(y\) represent the amount of money on the card, in dollars, and \(x\) the number of rides, the linear relationship in this activity has the equation \(y = 40 - 2.5x\). When will there be no money left on the card?" (After 16 rides, the card has no money left, so when \(x = 16\), \(y = 0\).) Explain that just like the point \((0,40)\) on the graph is called the vertical intercept, the point \((16,0)\) is called the horizontal intercept. In this situation, the vertical intercept tells us how much money Noah put on the card and the horizontal intercept tells us how many rides Noah can take before the card has no more money on it.
Some students may connect the plotted points with a line, or only draw the line and not each point. If this comes up, acknowledge that it’s a common practice in mathematical modeling to connect points showing a line to make a relationship easier to see. Ask if a point on the line such as \((1.5, 36.25)\) makes sense in this situation. We understand that the line helps us to understand the situation, but we also recognize that only integer values for the number of rides make sense in this situation.
Display once again lines \(v\) and \(t\) from the warm-up. Explain that even though they both have slope triangles similar to a triangle with vertical length of 1 and horizontal length of 3, they don’t have the same slope. Ask students to articulate which line has a slope of \(\frac13\) and which line has a slope of \(\frac {\text{-}1}{3}\), and why. Validate students’ use of informal language to describe the differences in their own words. For example, they might say that if you put a pencil on a line and move it along the line from left to right, line \(t\) goes “uphill” but line \(v\) goes “downhill.”
Design Principle(s): Optimize output (for explanation); Cultivate conversation
8.3: Travel Habits in July (10 minutes)
Activity
The previous activity examines the meaning of a negative slope with the context of money on a transportation card. This activity takes advantage of familiarity with the same context, introducing the idea of 0 slope. In the previous activity, the slope of -2.5 meant that for every ride, the amount on the card decreased by $2.50. In this activity, the amount on the card is graphed with respect to days in July. For every new day, the amount on the card does not change; it does not go up or down at all. The purpose is for students to understand the meaning of a slope of 0 in this context.
Launch
Show the image and ask students “What do you notice? What do you wonder?” Expect students to notice that the line is horizontal (or the amount of money on the card does not change). They may wonder why the line is horizontal or what its slope is.
Keep students in the same groups. 5 minutes of quiet think time, followed by partner and class discussion. Before students begin the task, ensure that they understand that the \(x\)-axis no longer represents number of rides, but rather, different days in July.
Supports accessibility for: Language; Organization
Design Principle(s): Cultivate conversation; Maximize meta-awareness
Student Facing
Here is a graph that shows the amount on Han’s fare card for every day of last July.
-
Describe what happened with the amount on Han’s fare card in July.
-
Plot and label 3 different points on the line.
-
Write an equation that represents the amount on the card in July, \(y\), after \(x\) days.
-
What value makes sense for the slope of the line that represents the amounts on Han’s fare card in July?
Student Response
For access, consult one of our IM Certified Partners.
Launch
Show the image and ask students “What do you notice? What do you wonder?” Expect students to notice that the line is horizontal (or the amount of money on the card does not change). They may wonder why the line is horizontal or what its slope is.
Keep students in the same groups. 5 minutes of quiet think time, followed by partner and class discussion. Before students begin the task, ensure that they understand that the \(x\)-axis no longer represents number of rides, but rather, different days in July.
Supports accessibility for: Language; Organization
Design Principle(s): Cultivate conversation; Maximize meta-awareness
Student Facing
Here is a graph that shows the amount on Han’s fare card for every day of last July.

- Describe what happened with the amount on Han’s fare card in July.
- Plot and label 3 different points on the line.
-
Write an equation that represents the amount on the card in July, \(y\), after \(x\) days.
- What value makes sense for the slope of the line that represents the amounts on Han’s fare card in July?
Student Response
For access, consult one of our IM Certified Partners.
Student Facing
Are you ready for more?
Let’s say you have taken out a loan and are paying it back. Which of the following graphs have positive slope and which have negative slope?
- Amount paid on the vertical axis and time since payments started on the horizontal axis.
- Amount owed on the vertical axis and time remaining until the loan is paid off on the horizontal axis.
- Amount paid on the vertical axis and time remaining until the loan is paid off on the horizontal axis.
Student Response
For access, consult one of our IM Certified Partners.
Activity Synthesis
Display the graph for all to see, and ask students to articulate what they think the slope of the graph is, and why. The goal is to understand that a slope of 0 makes sense because no money is added or subtracted each day. If students have been thinking in terms of uphill and downhill lines, they might describe this line as “flat,” indicating that the slope can’t be positive or negative, so 0 makes sense. Thinking of slope as the quotient of horizontal displacement by vertical displacement for two points on a line is very effective here: the vertical displacement is 0 for any two points on this line, and so the quotient or slope is also 0.
If no one brings it up, ask students what would happen if we tried to create a slope triangle for this line. They might claim that it would be impossible, but suggest that we can think of a slope “triangle” where the vertical segment has length 0. In other words, it is possible to imagine a horizontal line segment as a triangle whose base is that segment and whose height is 0. If possible, display and demonstrate with the following: https://ggbm.at/vvQPutaJ.
8.4: Payback Plan (10 minutes)
Optional activity
This activity gives students an opportunity to interpret the graph of a line in context, including the meaning of a negative slope and the meaning of the horizontal and vertical intercepts.
Launch
3 minutes of quiet work time, followed by 2 minutes to confer in small groups to verify answers.
Design Principle(s): Support sense-making; Maximize meta-awareness
Student Facing
Elena borrowed some money from her brother. She pays him back by giving him the same amount every week. The graph shows how much she owes after each week.

Answer and explain your reasoning for each question.
- What is the slope of the line?
- Explain how you know whether the slope is positive or negative.
- What does the slope represent in this situation?
- How much did Elena borrow?
- How much time will it take for Elena to pay back all the money she borrowed?
Student Response
For access, consult one of our IM Certified Partners.
Anticipated Misconceptions
Students may interpret money owed as negative. In this setup, the axis is labeled so that money owed is treated as positive.
Activity Synthesis
Ask students to share answers to each question and indicate how to use the graph to find the answers. For example, draw a slope triangle for the first question: the slope is -3 rather than 3, because the number of dollars owed is decreasing over time. Label the vertical intercept for the amount Elena borrowed and the horizontal intercept for the time it took her to pay back the loan.
Lesson Synthesis
Lesson Synthesis
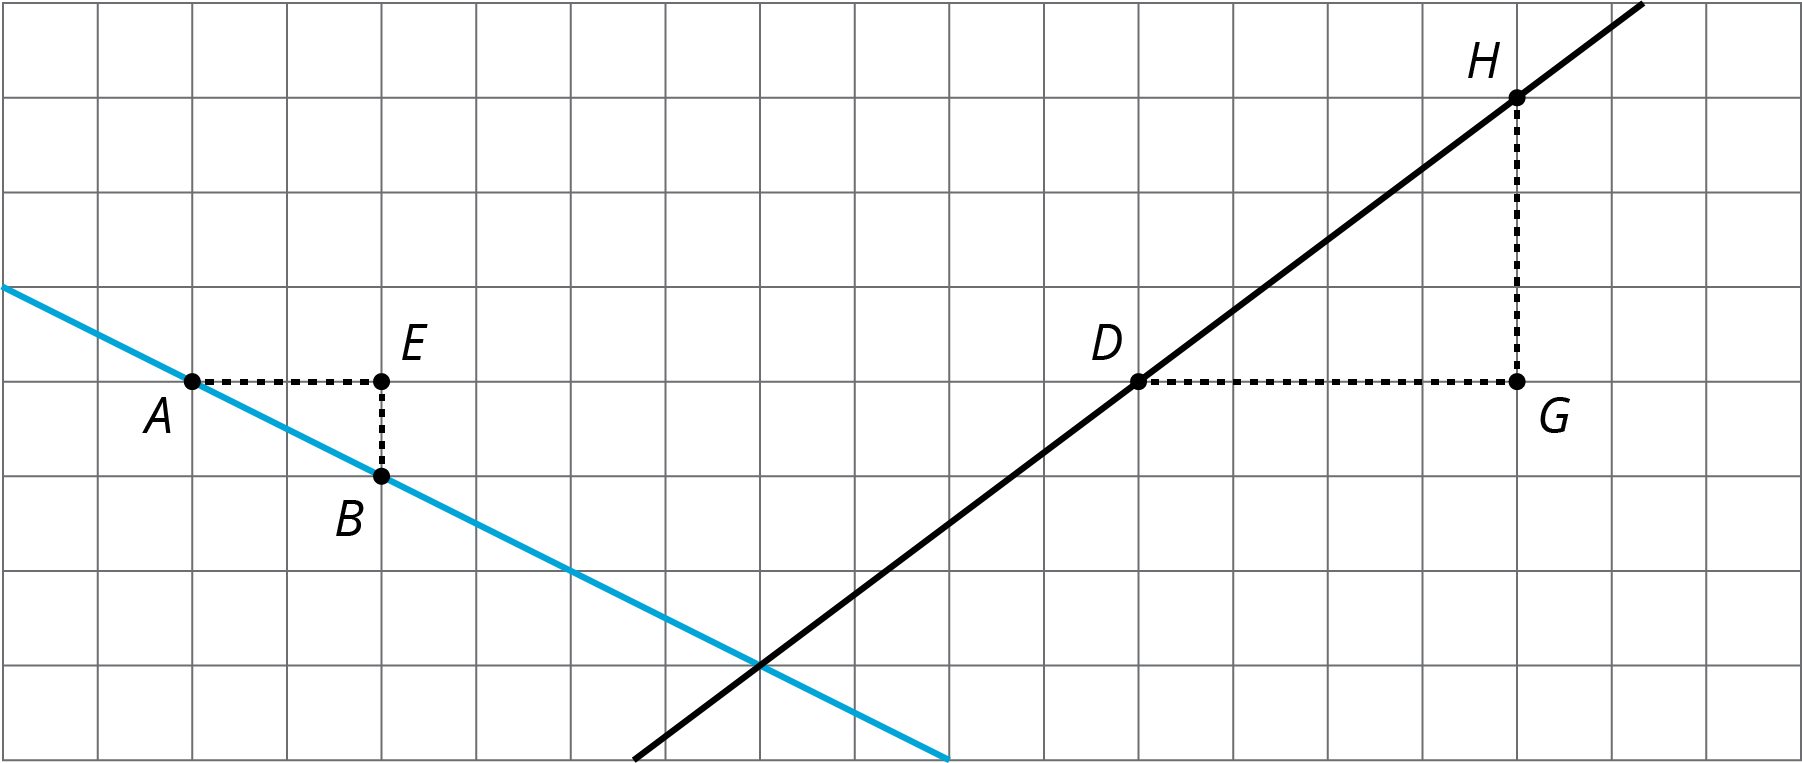
In this lesson, students learned that the slope of a line can be a negative value or 0. They saw some linear relationships with a negative slope and some with 0 slope. Students learned about cues to identify whether a graphed line has a positive slope, a negative slope, or 0 slope.
Display the graph for all to see. Ask students to pretend that their partner has been absent from class for a few days. Their job is to explain, verbally or in writing, how someone would figure out the slope of one of the graphed lines. Then, switch roles and listen to their partner explain how to figure out the slope of the other line.
8.5: Cool-down - The Slopes of Graphs (5 minutes)
Cool-Down
For access, consult one of our IM Certified Partners.
Student Lesson Summary
Student Facing
At the end of winter in Maine, the snow on the ground was 30 inches deep. Then there was a particularly warm day and the snow melted at the rate of 1 inch per hour. The graph shows the relationship between the time since the snow started to melt and the depth of the snow.
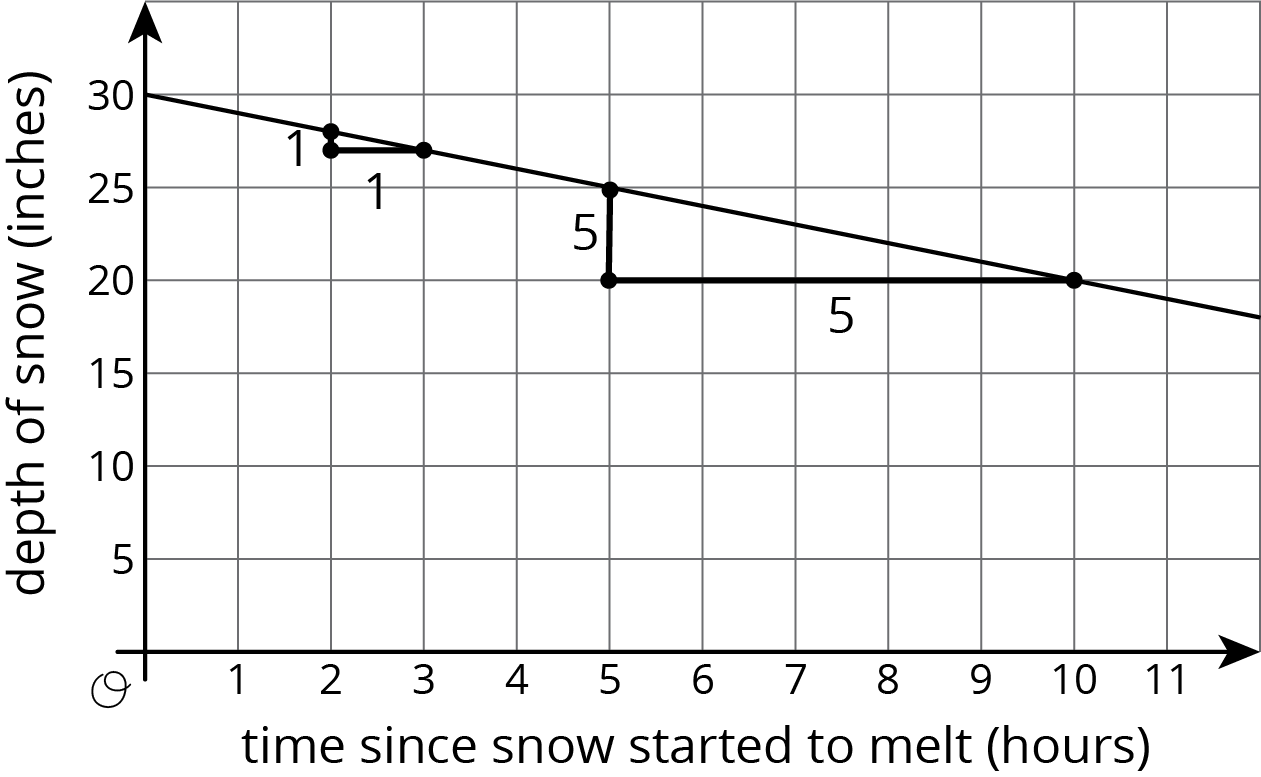
The slope of the graph is -1 since the rate of change is -1 inch per hour. That is, the depth goes down 1 inch per hour. The vertical intercept is 30 since the snow was 30 inches deep when the warmth started to melt the snow. The two slope triangles show how the rate of change is constant. It just also happens to be negative in this case since after each hour that passes, there is 1 inch less snow.
Graphs with negative slope often describe situations where some quantity is decreasing over time, like the depth of snow on warm days or the amount of money on a fare card being used to take rides on buses.
Slopes can be positive, negative, or even zero! A slope of 0 means there is no change in the \(y\)-value even though the \(x\)-value may be changing. For example, Elena won a contest where the prize was a special pass that gives her free bus rides for a year. Her fare card had \$5 on it when she won the prize. Here is a graph of the amount of money on her fare card after winning the prize:

The vertical intercept is 5, since the graph starts when she has \$5 on her fare card. The slope of the graph is \(0\) since she doesn’t use her fare card for the next year, meaning the amount on her fare card doesn’t change for a year. In fact, all graphs of linear relationships with slopes equal to 0 are horizontal—a rate of change of 0 means that, from one point to the next, the \(y\)-values remain the same.