Lesson 1
Understanding Proportional Relationships
1.1: Notice and Wonder: Two Graphs (5 minutes)
Warm-up
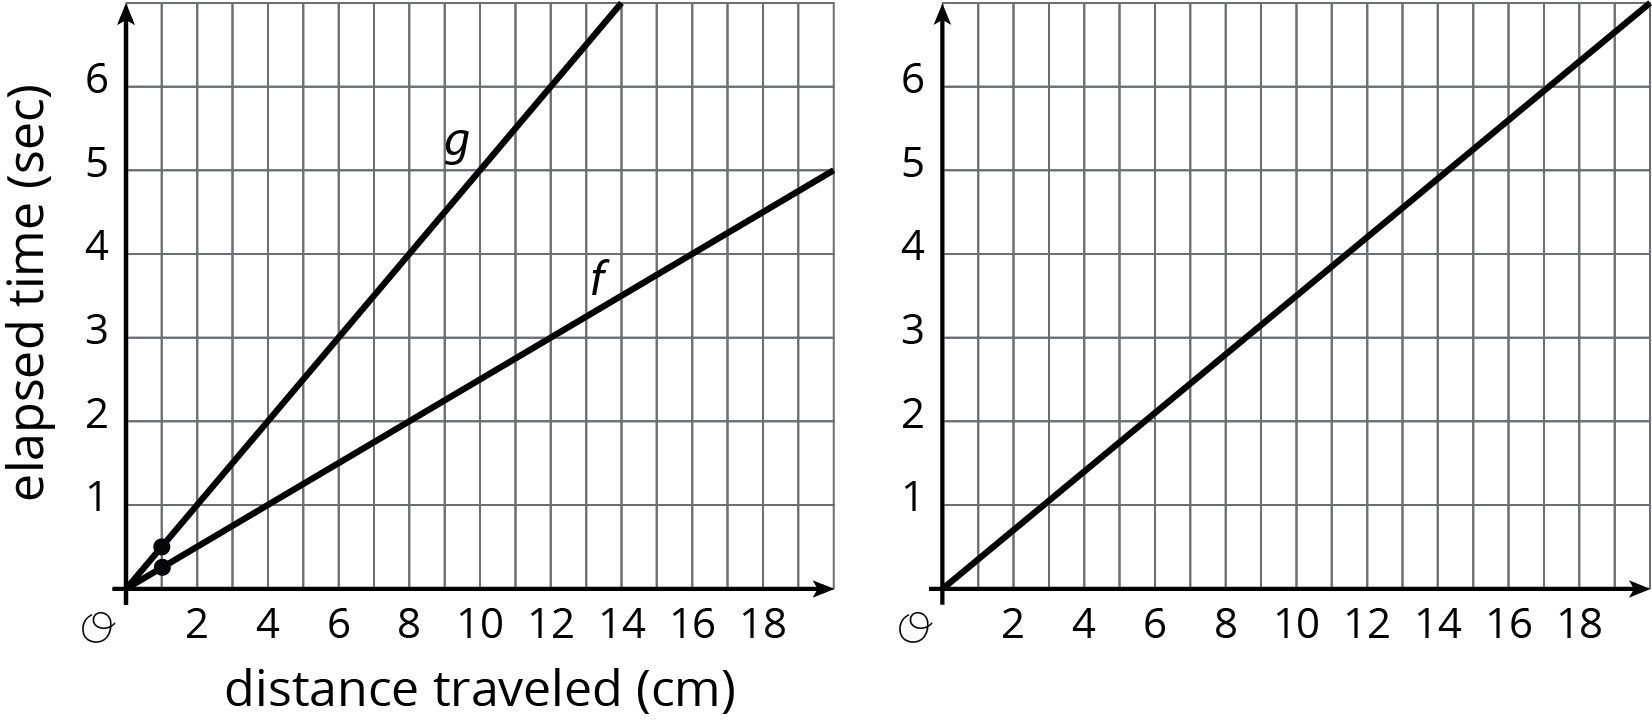
The purpose of this warm-up is to get a conversation started about what features a graph needs. In the following activities, students will put these ideas to use by adding scale to some axes with two proportional relationships graphed on it.
Launch
Tell students they will look at a picture, and their job is to think of at least one thing they notice and at least one thing they wonder about the picture. Display the problem for all to see and ask students to give a signal when they have noticed or wondered about something.
Student Facing

What do you notice? What do you wonder?
Student Response
For access, consult one of our IM Certified Partners.
Activity Synthesis
Invite students to share the things they noticed and wondered. Record and display their responses for all to see. If possible, record the relevant reasoning on or near the image. After each response, ask the class if they agree or disagree and to explain alternative ways of thinking, referring back to the images each time. If the missing labels are not mentioned, make sure to bring them up.
1.2: Moving Through Representations (15 minutes)
Activity
In this activity, students investigate the paces of two different bugs. Using the chart at the start of the activity, students answer questions about pace, decide on a scale for the axes, and mark and label the time needed to travel 1 cm for each bug (unit rate).
Identify students who use different scales on the axes to share during the Activity Synthesis. For example, some students may count by 1s on the distance axis while others may count by 0.5s.
Launch
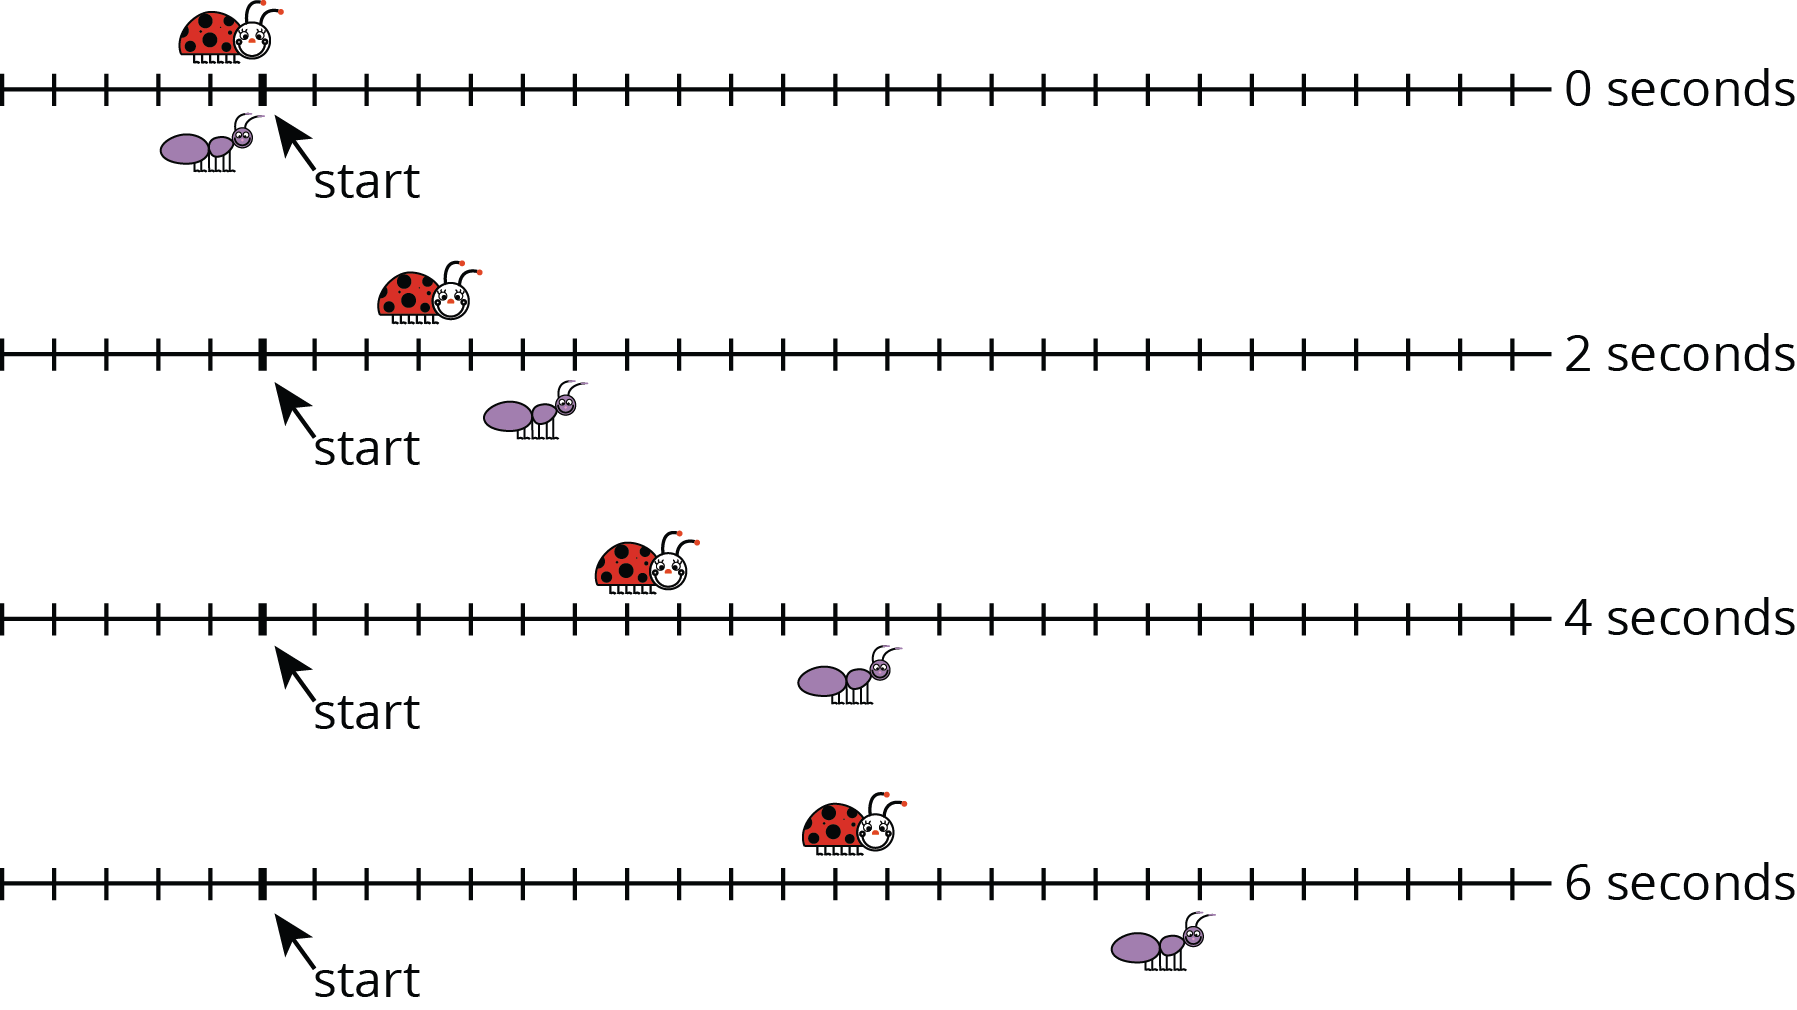
Arrange students in groups of 2. Before students start working, ensure that they understand that each bug’s position is measured at the front of their head. So for example, in the second diagram, the ladybug has moved 4 centimeters and the ant has moved 6 centimeters.
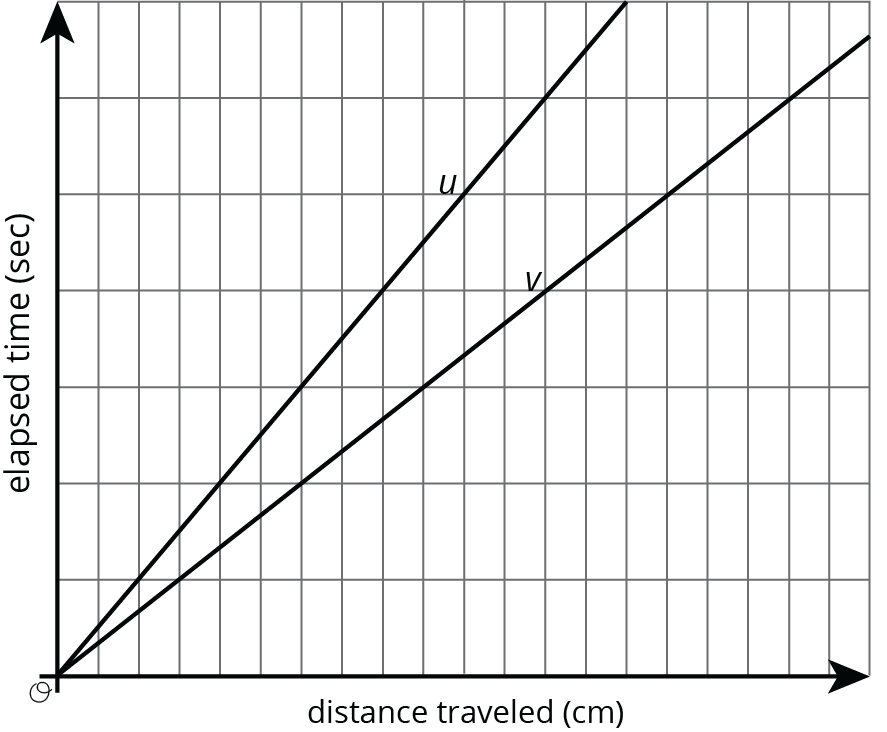
Ask students to review the images and the first problem in the activity and give a signal when they have finished. Invite students to share their ideas about which bug is represented by line \(u\) and which bug is represented by line \(v\). (The ladybug is \(u\), the ant is \(v\).) If not brought up in students’ explanations, draw attention to how the graph shows the pace of the two bugs—that is, the graph shows how much time it takes to go a certain distance, which is different than a graph of speed, which shows how much distance you go for a certain amount of time.
Give students work time to complete the remaining problems with their partner followed by a whole-class discussion.
Supports accessibility for: Language; Organization
Design Principle(s): Optimize output; Cultivate conversation
Student Facing
A ladybug and ant move at constant speeds. The diagrams with tick marks show their positions at different times. Each tick mark represents 1 centimeter.


-
Lines \(u\) and \(v\) also show the positions of the two bugs. Which line shows the ladybug’s movement? Which line shows the ant’s movement? Explain your reasoning.
-
How long does it take the ladybug to travel 12 cm? The ant?
-
Scale the vertical and horizontal axes by labeling each grid line with a number. You will need to use the time and distance information shown in the tick-mark diagrams.
-
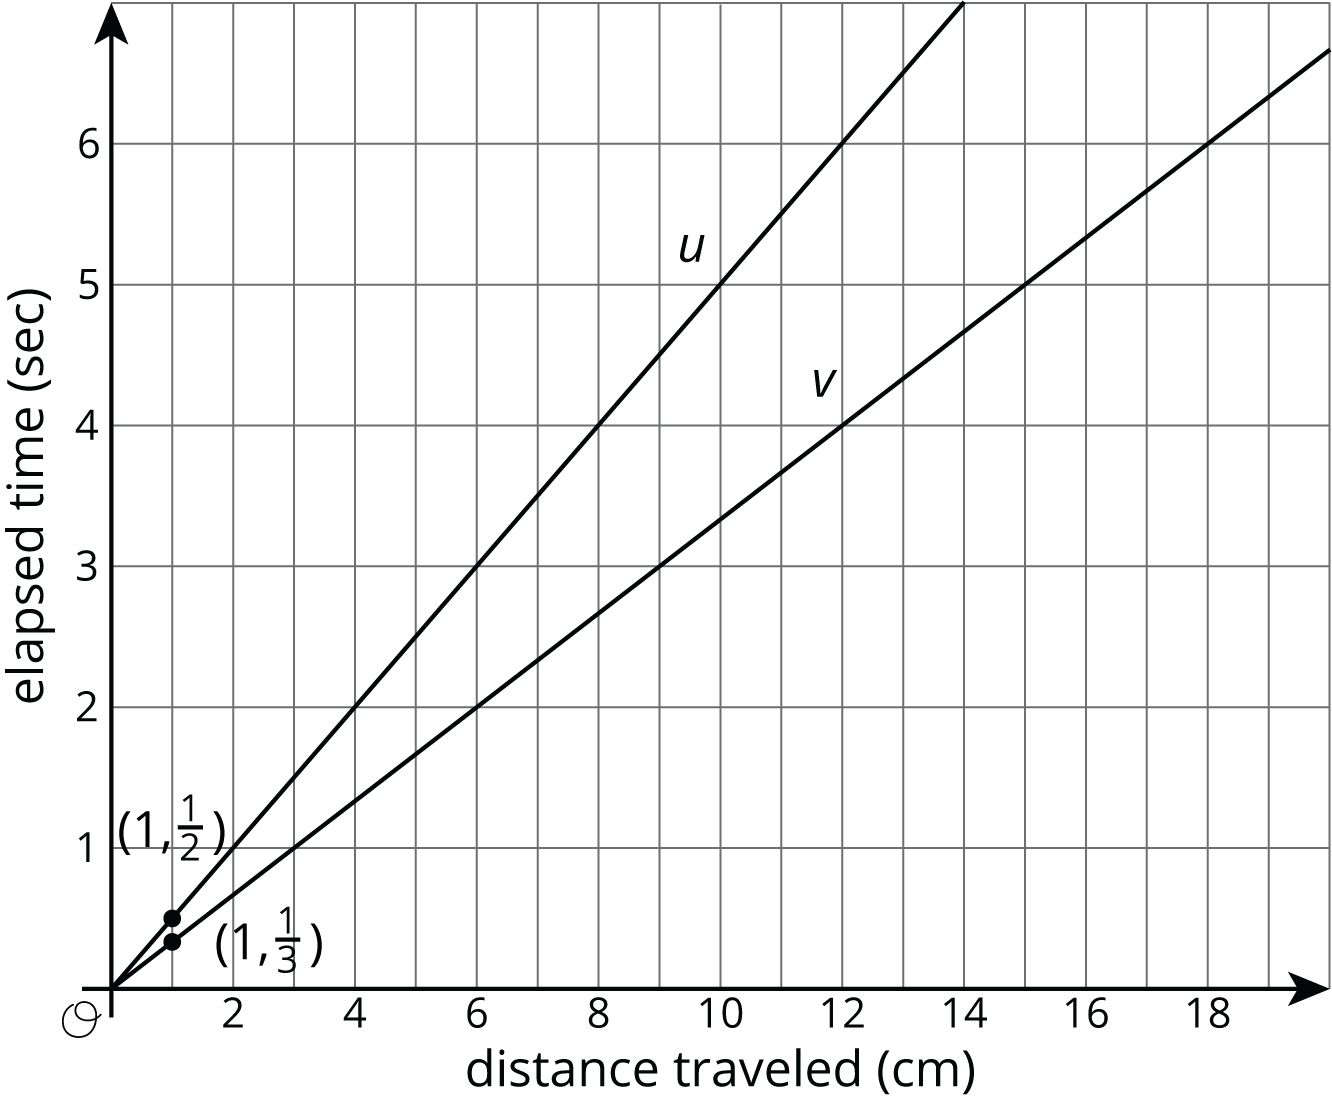
Mark and label the point on line \(u\) and the point on line \(v\) that represent the time and position of each bug after traveling 1 cm.
Student Response
For access, consult one of our IM Certified Partners.
Student Facing
Are you ready for more?
- How fast is each bug traveling?
- Will there ever be a time when the ant is twice as far away from the start as the ladybug? Explain or show your reasoning.
Student Response
For access, consult one of our IM Certified Partners.
Anticipated Misconceptions
Students might confuse pace with speed and interpret a steeper line as meaning the ladybug is moving faster. Monitor students to ensure that they attend to the time and distance on the tick mark diagrams and plot points as \((distance, time)\) with time on the \(y\)-axis and distance on the \(x\)-axis. Reinforce language of how many seconds per a given interval of distance. Make explicit that twice as fast means half the pace.
Activity Synthesis
Display the images from the problem for all to see. Begin the discussion by inviting students to share their solutions for how long it takes each bug to travel 12 cm. Encourage students to reference one or both of the images as they explain their thinking.
Ask previously selected students to share their graphs with added scale and how they decided on what scale to use. If possible, display these graphs for all to see. There are many correct ways to choose a scale for this situation, though some may have made it difficult for students to plot the answer to the final problem. If this happened, highlight these graphs and encourage students to read all problems when they are making decisions about how to construct a graph. Since this activity had a problem asking for information about 1 cm, it makes sense to count by 1s (or even something smaller!) on the distance axis.
1.3: Moving Twice as Fast (15 minutes)
Activity
In this activity, students use the representations from the previous activity and add a third bug that is moving twice as fast as the ladybug. Students are also asked to write equations for all three bugs. An important aspect of this activity is students making connections between the different representations.
Monitor for students using different strategies to write their equations. For example, some students may reason from the unit rates they can see on their graphs and write equations in the form of \(y=kx\), where \(k\) is the unit rate (constant of proportionality). Others may write equations of the form \(\frac{y}{x}=\frac{b}{a}\), where \((a,b)\) is a point on the line. Select several of these students to share during the discussion.
Launch
Keep students in the same groups. Give 5–7 minutes work time followed by a whole-class discussion.
Supports accessibility for: Organization; Attention
Design Principle(s): Maximize meta-awareness
Student Facing
Refer to the tick-mark diagrams and graph in the earlier activity when needed.
- Imagine a bug that is moving twice as fast as the ladybug. On each tick-mark diagram, mark the position of this bug.
- Plot this bug’s positions on the coordinate axes with lines \(u\) and \(v\), and connect them with a line.
- Write an equation for each of the three lines.
Student Response
For access, consult one of our IM Certified Partners.
Activity Synthesis
Display both images from the previous task for all to see. Invite previously selected students to share their equations for each bug. Sequence students so that the most common strategies are first. Record the different equations created for each bug and display these for all to see.
As students share their reasoning about the equation for the third bug, highlight strategies that support using the equation (original is \(k\) and new one is \(\frac12 k\)) and graph (less steep, still constant proportionality, half point values). If no students write an equation of the form \(y=kx\), do so and remind students of the usefulness of \(k\), the constant of proportionality, when reasoning about proportional relationships.
Consider asking the following questions to help students make connections between the different representations:
- “What features of the tick-mark diagrams, lines, and equations can you identify that would allow someone to figure out which bug is moving faster?” (The tick-mark diagrams give the coordinates of points that will go on the graph because they show how far each bug has gone after each amount of time. We can see the positions of the bugs on the tick-mark diagrams so we know which is faster. The graph shows how far they went for any amount of time and the slope helps to show which is faster. Both help compare the movements of the two or three bugs.)
- “The tick-mark diagrams show some of the bugs’ movements, but not all of them. How can we use the graphs of the lines to get more complete information?” (The tick-mark diagrams only show time every 2 seconds. On the graph we can see the bugs’ positions at any point in time.)
- “Are you convinced that your graph (or equation) supports the fact that the new bug is going twice as fast as the ladybug?”
Lesson Synthesis
Lesson Synthesis
Display a scaled graph of the two bugs for all to see. Remind students that line \(u\) is the ladybug and that line \(v\) is the ant.

Ask students:
- “What would the graph of a bug going 3 times faster than the ant look like?” (It would go through the points \((0,0)\), \((1,\frac{1}{9})\), and \((9,1)\).)
- “What would an equation showing the relationship between the bugs' distance and time look like?” (Since it is going 4 times faster and goes through the point \((9,1)\), it has a constant of proportionality of \(\frac{1}{9}\), which means one equation is \(y=\frac{1}{9}x\).)
- “If we wanted to scale the graph so we could see how long it takes the ladybug to travel 50 cm, what numbers could we use on the vertical axis?” (The ladybug travels 50 cm in 25 seconds, so the vertical axis would need to extend to at least that value.)
1.4: Cool-down - Turtle Race (5 minutes)
Cool-Down
For access, consult one of our IM Certified Partners.
Student Lesson Summary
Student Facing
Graphing is a way to help us make sense of relationships. But the graph of a line on a coordinate axes without scale or labels isn’t very helpful. For example, let’s say we know that on longer bike rides Kiran can ride 4 miles every 16 minutes and Mai can ride 4 miles every 12 minutes. Here are the graphs of these relationships:

Without labels we can’t even tell which line is Kiran and which is Mai! Without labels and a scale on the axes, we can’t use these graphs to answer questions like:
- Which graph goes with which rider?
- Who rides faster?
- If Kiran and Mai start a bike trip at the same time, how far are they after 24 minutes?
- How long will it take each of them to reach the end of the 12 mile bike path?
Here are the same graphs, but now with labels and scale:

Revisiting the questions from earlier:
-
Which graph goes with each rider? If Kiran rides 4 miles in 16 minutes, then the point \((4,16)\) is on his graph. If he rides for 1 mile, it will take 4 minutes. 10 miles will take 40 minutes. So the upper graph represents Kiran’s ride. Mai’s points for the same distances are \((1,3)\), \((4,12)\), and \((10,30)\), so hers is the lower graph. (A letter next to each line would help us remember which is which!)
-
Who rides faster? Mai rides faster because she can ride the same distance as Kiran in a shorter time.
-
If Kiran and Mai start a bike trip at the same time, how far are they after 20 minutes? The points on the graphs at height 20 are 5 miles for Kiran and a little less than 7 miles for Mai.
-
How long will it take each of them to reach the end of the 12 mile bike path? The points on the graphs at a horizontal distance of 12 are 36 minutes for Mai and 48 minutes for Kiran. (Kiran’s time after 12 miles is almost off the grid!)