Lesson 6
Representations of Linear Relationships
6.1: Estimation: Which Holds More? (5 minutes)
Warm-up
This warm-up prompts students to estimate the volume of different glasses by reasoning about characteristics of their shape. As students discuss their reasoning with a partner, monitor the discussions and identify students who identified important characteristics of each of the glasses in their response.
Launch
Arrange students in groups of 2. Tell students they will be estimating which glass would hold the most liquid. Ask students to give a signal when they have an estimate and reasoning. Give students 1 minute of quiet think time followed by 2 minutes to discuss their estimates with a partner. Ask them to discuss the following questions, displayed for all to see:
- “What was important to you in the image when making your decision?”
- “What information would be helpful in finding the answer to this question?”
Student Facing
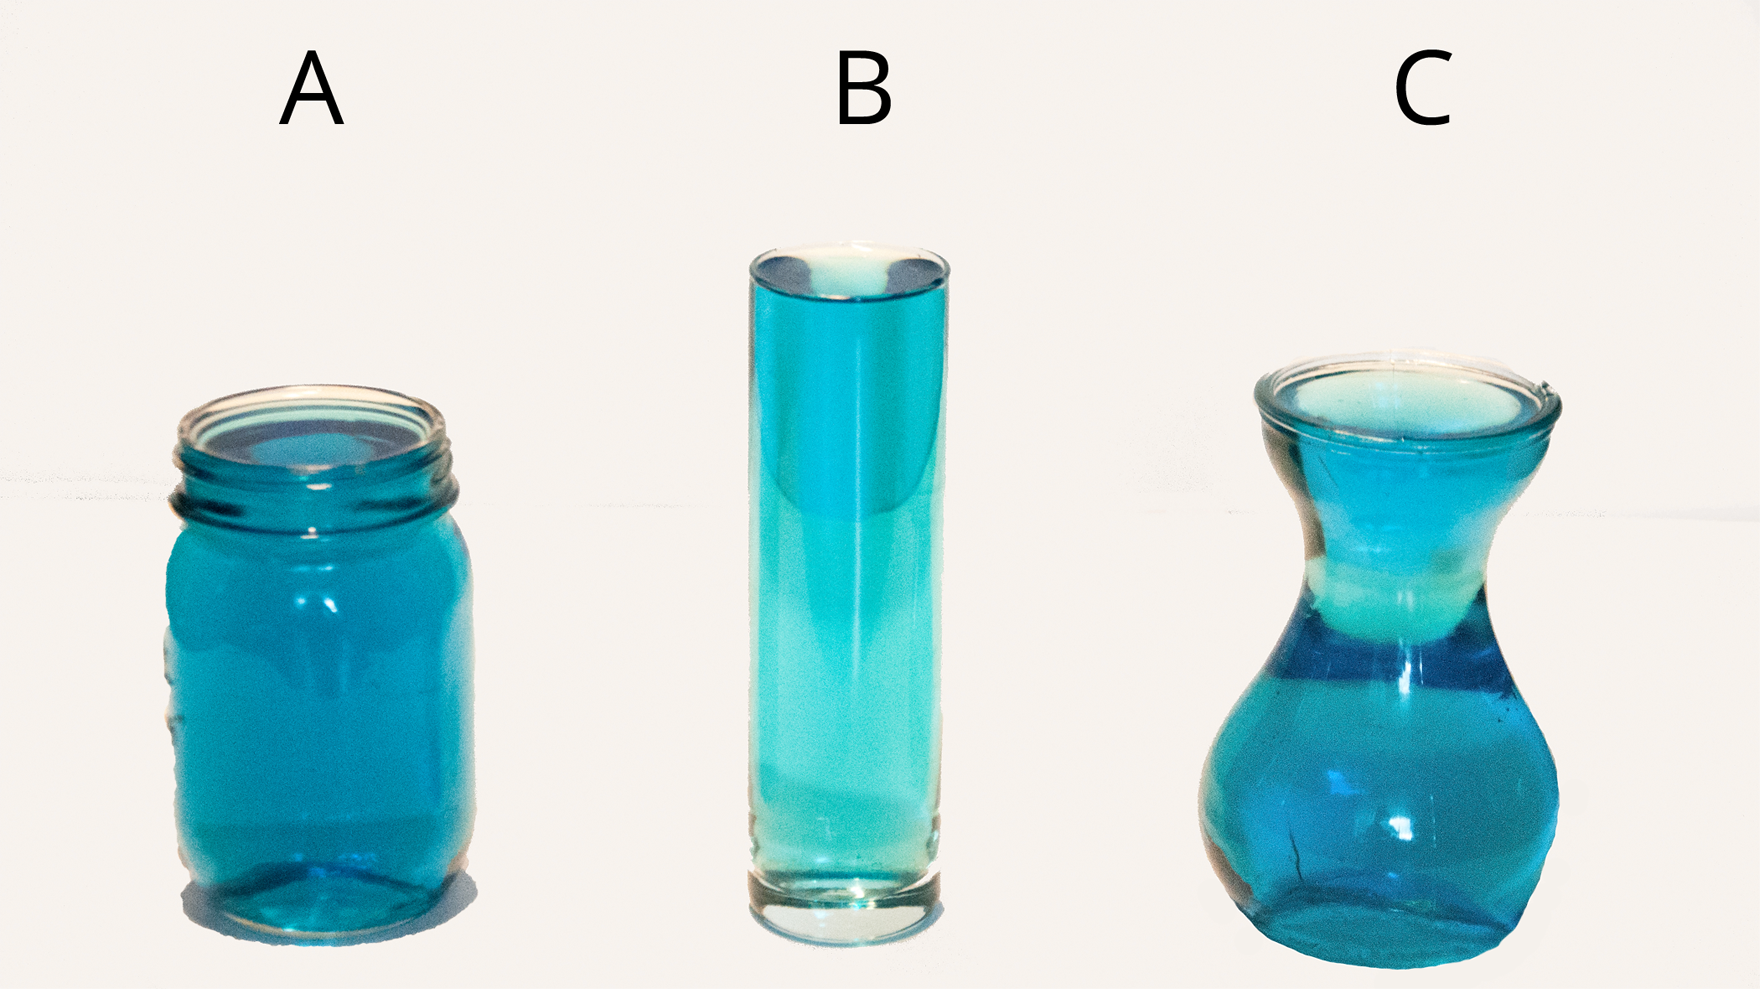
Which glass will hold the most water? The least?

Student Response
For access, consult one of our IM Certified Partners.
Activity Synthesis
For each glass, ask students to indicate if they think it holds the most or least amount of water. Invite a few students to share their reasoning and the characteristics of the object that were important in making their decision. After each explanation, solicit from the class questions that could help the student clarify his or her reasoning. Record the characteristics, and display them for all to see. If possible, record these characteristics on the images themselves during the discussion.
If there is time, discuss the information they would need to find the answer to the question accurately. Note that no measurements needs to be taken to answer the question; to compare the volume of two containers, it is enough to pour the liquid from one into the other.
It turns out that B holds the least and A and C hold the same. If the right technology is available, consider showing the answer video.
6.2: Rising Water Levels (20 minutes)
Activity
The goal of this task is to analyze a linear relationship for data gathered in context. Students examine data gathered by successively submerging equal-size objects in a graduated cylinder, partially filled with water, and then measuring the level of the water. Here and in the sample solutions, we use a 100 ml graduated cylinder, 60 ml as the initial amount of water, and number cubes whose volume is approximately 3.7 ml each. Your measurements may be different. You will want to make sure to leave enough space so many number cubes can be added before the water reaches the top (but not too much space as the number cubes need to all be submerged in the water).
After gathering the data, students plot it and notice that it lies on a line, up to measurement error. They estimate the slope using slope triangles and then interpret the meaning of the \(y\)-intercept and the slope in terms of the context. With \(x\) number cubes and an initial amount of 60 ml in the cylinder, \(60 + 3.7x\) is an expression giving the level of the water:
- The number 60 represents the initial amount of water in the cylinder.
- 3.7 is the volume per number cube in ml (and the rate of change in water level).
- \(x\) represents how many number cubes have been added to the cylinder.
There are two versions of this task, one for a shorter 20 minute time and one for a longer time (40–45 minutes). The difference is in how the data is gathered. For the shorter time, the teacher performs a demonstration, adding dice to the cylinder, and then the whole class works with this data. For the second, longer version, students gather their own data.
Note that because of measurement error the data do not lie exactly on a line, and different slope triangles may lead to slightly different values for the slope. Monitor for students who get slightly different values, and invite them to share during the discussion.
Launch
Tell students, “Have you ever noticed that when you put ice cubes in your drink, the level of the liquid goes up? Today, we want to investigate what happens when we drop objects into a container with water.”
For the 20 minute version, begin with a demonstration, either using the applet with the digital version of the task or a physical demonstration. For a physical demonstration, consider measuring the volume after putting in 1, 2, 5, 8, and 10 dice. Record the measurements for all to see or choose students to do so. After students have the information for the table, they work in small groups to complete the activity.
For the 45 minute version, distribute materials to each group:
- 1 graduated cylinder.
- 15 identical solid objects that fit into the cylinder and have a higher density than water and don’t float (marbles, dice, cubes, hardware items such as nuts or bolts, etc.). Tell students how much water to put initially into their cylinders. Groups spend 10 minutes conducting the experiment. The analysis can be done as a combination of class discussion and student work.
For classrooms without materials to create the lab, there is a digital activity to recreate the experience. The applet might also be useful to show classes before they begin the lab and after they have predictions. Adapted from an applet made in GeoGebra by John Golden.
Arrange students in groups of 2–3.
Supports accessibility for: Visual-spatial processing; Conceptual processing; Organization
Design Principle(s): Optimize output (for justification); Maximize meta-awareness
Student Facing
Move the green circle to set the starting level of water to a value you or your teacher choose.
- What is the volume, \(V\), in the cylinder after you add:
- 3 objects?
- 7 objects?
- \(x\) objects? Explain your reasoning.
-
If you wanted to make the water reach the highest mark on the cylinder, how many objects would you need?
-
Plot and label points that show your measurements from the experiment.
-
Plot and label a point that shows the depth of the water before you added any objects.
-
The points should fall on a line. Use the Line tool to draw this line.
-
Compute the slope of the line using several different triangles. Does it matter which triangle you use to compute the slope? Why or why not?
-
The equation of the line in the experiment has two numbers and two variables. What physical quantities do the two numbers represent? What does \(V\) represent and what does \(x\) represent?
Student Response
For access, consult one of our IM Certified Partners.
Launch
Tell students, “Have you ever noticed that when you put ice cubes in your drink, the level of the liquid goes up? Today, we want to investigate what happens when we drop objects into a container with water.”
For the 20 minute version, begin with a demonstration, either using the applet with the digital version of the task or a physical demonstration. For a physical demonstration, consider measuring the volume after putting in 1, 2, 5, 8, and 10 dice. Record the measurements for all to see or choose students to do so. After students have the information for the table, they work in small groups to complete the activity.
For the 45 minute version, distribute materials to each group:
- 1 graduated cylinder.
- 15 identical solid objects that fit into the cylinder and have a higher density than water and don’t float (marbles, dice, cubes, hardware items such as nuts or bolts, etc.). Tell students how much water to put initially into their cylinders. Groups spend 10 minutes conducting the experiment. The analysis can be done as a combination of class discussion and student work.
For classrooms without materials to create the lab, there is a digital activity to recreate the experience. The applet might also be useful to show classes before they begin the lab and after they have predictions. Adapted from an applet made in GeoGebra by John Golden.
Arrange students in groups of 2–3.
Supports accessibility for: Visual-spatial processing; Conceptual processing; Organization
Design Principle(s): Optimize output (for justification); Maximize meta-awareness
Student Facing
- Record data from your teacher's demonstration in the table. (You may not need all the rows.)
- What is the volume, \(V\), in the cylinder after you add \(x\) objects? Explain your reasoning.
- If you wanted to make the water reach the highest mark on the cylinder, how many objects would you need?
- Plot and label points that show your measurements from the experiment.
- The points should fall on a line. Use a ruler to graph this line.
- Compute the slope of the line. What does the slope mean in this situation?
- What is the vertical intercept? What does vertical intercept mean in this situation?
| number of objects | volume in ml |
|---|---|

Student Response
For access, consult one of our IM Certified Partners.
Student Facing
Are you ready for more?
A situation is represented by the equation \(y = 5 +\frac12 x\).
-
Invent a story for this situation.
-
Graph the equation.
-
What do the \(\frac12\) and the 5 represent in your situation?
-
Where do you see the \(\frac12\) and 5 on the graph?
Student Response
For access, consult one of our IM Certified Partners.
Anticipated Misconceptions
Students may think the marks on the cylinder indicate the height of the water. Milliliters are a measure of volume. However, in a cylinder, the height is proportional to the volume, so it does make sense to measure the height. But then the objects will be measured by what height of water they displace, not volume.
Activity Synthesis
Display the equation \(V = 3.7x + 60\) for all to see. Note: if you used a different amount of water or objects with a different volume, display the equation corresponding to your class data. Elicit understanding of each part of this equation by asking these questions:
- "How does this equation represent the situation we saw today?" (This is the equation for the line we graphed of the cylinder with the number cubes being added.)
- "What do the variables represent?"(\(V\) is the total volume in the cylinder in ml. \(x\) is the number of objects added to the cylinder.)
- "Where do you see rate of change in this equation? What does it mean in this situation?" (3.7 is the volume of each object in ml.)
- "What does the number 60 represent?" (60 is the initial amount of water in the cylinder in ml.)
In other words, the equation \(V = 3.7x + 60\) can be interpreted as saying \(\displaystyle \text{total volume} = (3.7\text{ ml per object})*(\text{number of objects}) + \text{initial volume}\) In terms of the graph, 3.7 is the slope and 60 is the vertical intercept.
It might be necessary to discuss the precision of the computed slope. It makes sense that every object increases the volume by the same amount (because the dice, for example, all have the same size). This amount is approximately 3.7 ml for the dice shown in the pictures. For smaller objects or graduated cylinders with bigger diameters, it may be difficult to accurately measure the change for 3 objects. If so, have students add objects in larger sets. The slope calculation will tell the amount of change for one object.
Ignoring precision issues, we can use any two points on the graph to compute the slope since all slope triangles are similar and therefore (vertical side length)/(horizontal side length) is the same for all of them. In particular, for a triangle with horizontal side length of 1, the vertical side length is the rate of change (3.7 ml per object for our example)—each additional object added will increase the volume by this same amount.
6.3: Calculate the Slope (10 minutes)
Activity
The purpose of this task is to develop a quick method or formula to calculate the slope of a line based on the coordinates of two points. It is not critical or even recommended to use the traditional formula invoking subscripts. The goal is for students to realize that they can calculate the vertical and horizontal side lengths of the slope triangle without a grid (eventually without even drawing the slope triangle) and that the slope is the quotient of these side lengths.
After students compute the slopes of three specific lines they generalize the procedure. Students are asked to express regularity in repeated reasoning (MP8) to both describe a procedure in words and then as an algebraic expression. It is more important that students know a technique or way of thinking about it that works for them than it is that they memorize a particular way to express a formula.
Launch
Quiet work time followed by a class discussion.
Supports accessibility for: Conceptual processing; Social-emotional skills
Design Principle(s): Optimize output (for generalization)
Student Facing

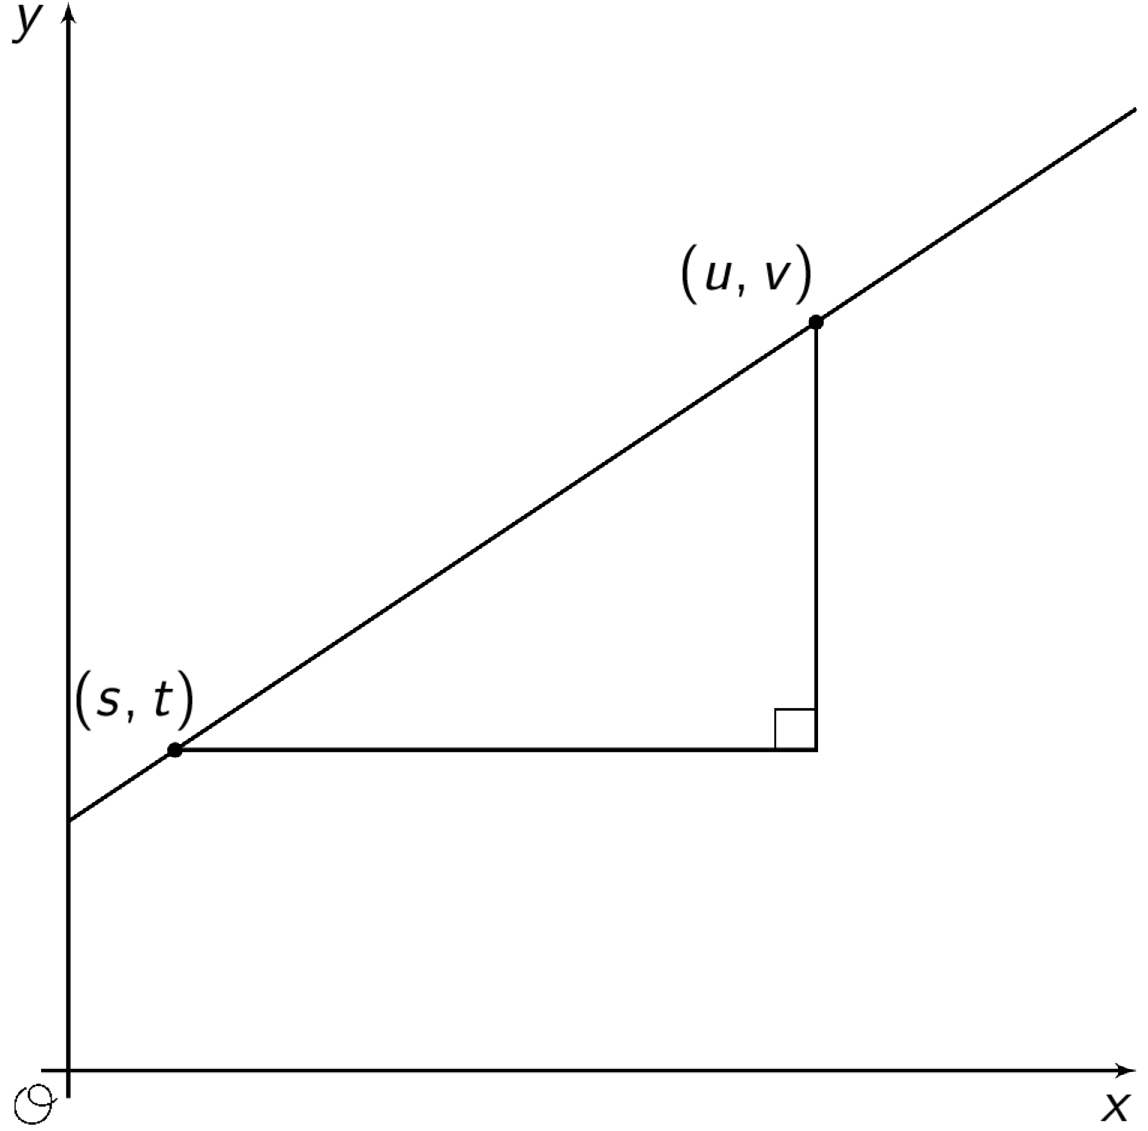
- For each graph, record:
vertical change horizontal change slope -
Describe a procedure for finding the slope between any two points on a line.
-
Write an expression for the slope of the line in the graph using the letters \(u, v, s,\) and \(t\).

Student Response
For access, consult one of our IM Certified Partners.
Activity Synthesis
Ask students to share solutions to the first three problems, and ensure that everyone understands why the correct answers are correct. There is no requirement that students simplify fractions; a student who comes up with \(\frac{40}{20}\) for graph C is correct. The convention of simplifying a fraction can be especially helpful if further calculations need to be made (or in this case, to give an immediate sense of the size of the number).
Invite students to share the procedure they came up with. Ideally, they will share several versions of “Subtract the \(y\)-coordinates, subtract the \(x\)-coordinates, and then divide the difference in \(y\)’s by the difference in \(x\)’s.” Note that it is important to subtract the \(x\)-coordinates for the two points in the same order as the \(y\)-coordinates, that is \(\frac{9-3}{4-1}\) for graph A, not \(\frac{9-3}{1-4}\).
For the last question, invite students to share the expressions they came up with. Acknowledge any response that is equivalent to the correct answer, but be on the lookout for expressions like \(v-t \div u-s\), or \((v-t) \div (s-u)\), which are incorrect for different reasons.
Lesson Synthesis
Lesson Synthesis
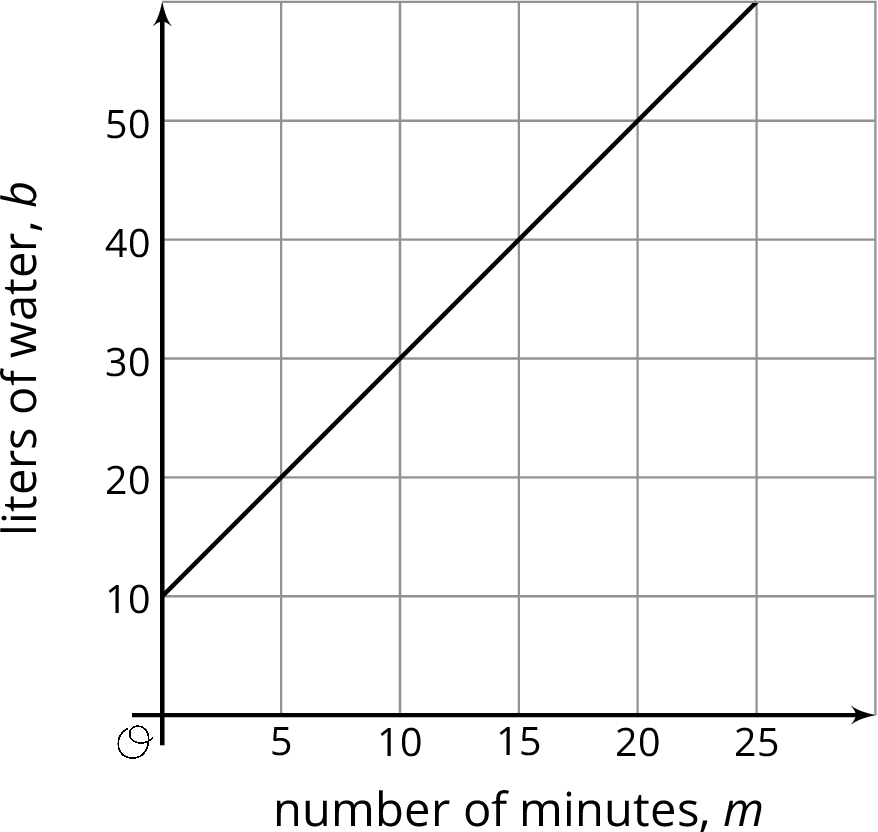
Ask students to create and interpret an equation for a situation with linear growth. For example, imagine you have a bucket of water that already contains 10 liters of water and you turn on the water faucet, which adds 2 liters of water every minute. Ask students:
- “Can we use a linear equation to represent this situation?” (Yes.)
- “Why or why not?” (Each minute, 2 more liters of water are added to the bucket; the rate of change is constant.)
- “What is the equation?” (\(b = 10 + 2m\) where \(b\) is the number of liters of water in the bucket and \(m\) is the number of minutes since you turned on the faucet.)
Sketch a graph of the line \(b = 10 + 2m\).

Ask students the meaning of 10 from the equation and where they see it on the graph. (It’s the \(y\)-intercept, and it is how many liters of water were in the bucket at the beginning.) Ask the meaning of 2 from the equation and where they see it on the graph. (It’s the slope. A slope triangle with horizontal side length 1 will have vertical side length 2.)
We can find the slope of a line using any two points on the line. We use the coordinates of the two points to find the vertical and horizontal side lengths of the slope triangle. The slope is the quotient of the vertical and horizontal lengths. Label two general points \((a,b)\) and \((x,y)\) on the triangle. The vertical side has length \(y-b\), and the horizontal side has length \(x-a\) so \(\frac{y-b}{x-a} = 2\).
6.4: Cool-down - Graphing a Line (5 minutes)
Cool-Down
For access, consult one of our IM Certified Partners.
Student Lesson Summary
Student Facing
Let's say we have a glass cylinder filled with 50 ml of water and a bunch of marbles that are 3 ml in volume. If we drop marbles into the cylinder one at a time, we can watch the height of the water increase by the same amount, 3 ml, for each one added. This constant rate of change means there is a linear relationship between the number of marbles and the height of the water. Add one marble, the water height goes up 3 ml. Add 2 marbles, the water height goes up 6 ml. Add \(x\) marbles, the water height goes up \(3x\) ml.
Reasoning this way, we can calculate that the height, \(y\), of the water for \(x\) marbles is \(y=3x+50\). Any linear relationships can be expressed in the form \(y=mx+b\) using just the rate of change, \(m\), and the initial amount, \(b\). The 3 represents the rate of change, or slope of the graph, and the 50 represents the initial amount, or vertical intercept of the graph. We'll learn about some more ways to think about this equation in future lessons.
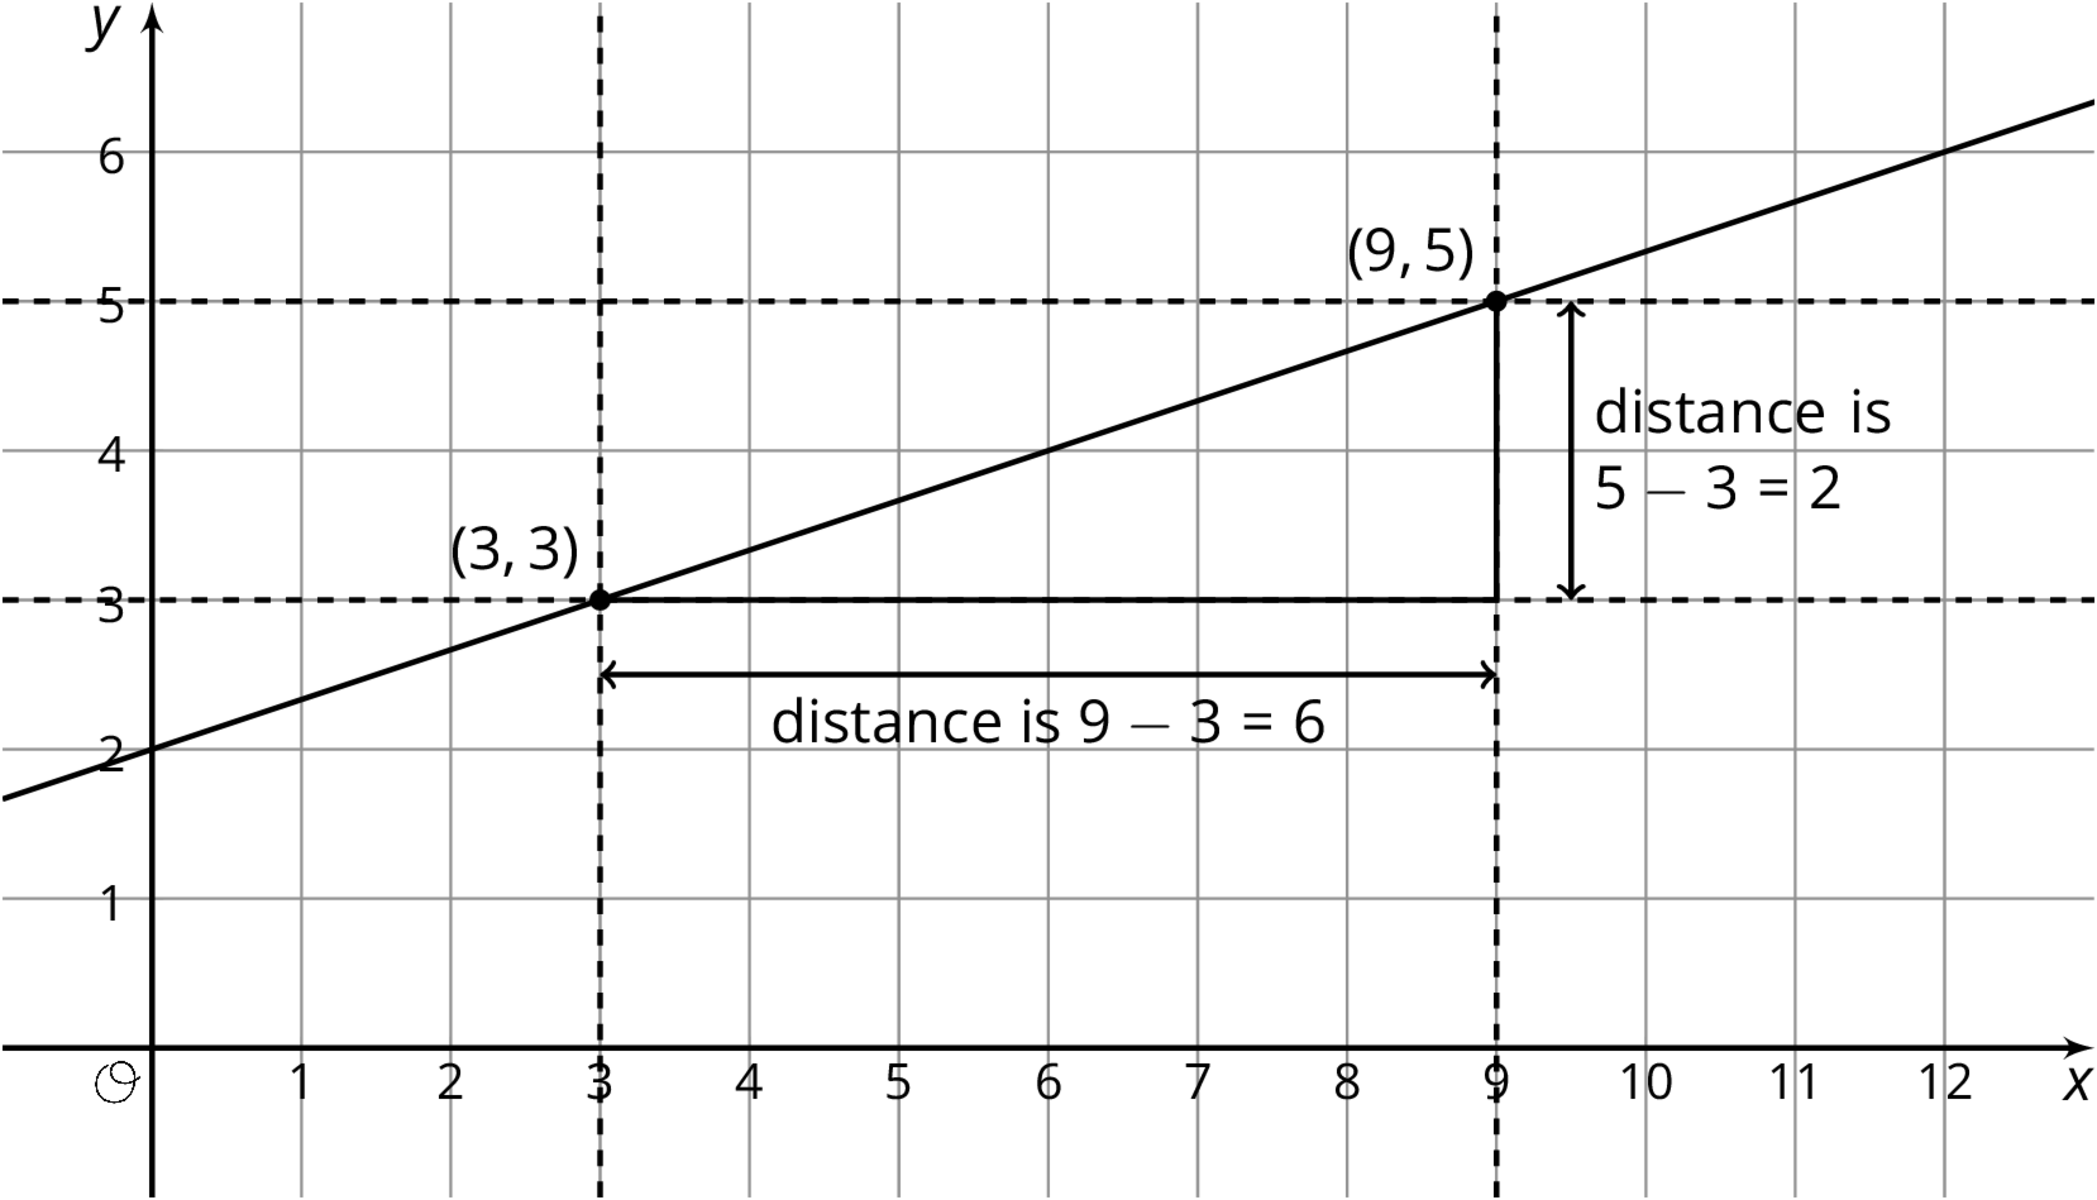
Now what if we didn't have a description to use to figure out the slope and the vertical intercept? That's okay so long as we can find some points on the line! For the line graphed here, two of the points on the line are \((3,3)\) and \((9,5)\) and we can use these points to draw in a slope triangle as shown:

The slope of this line is the quotient of the length of the vertical side of the slope triangle and the length of the horizontal side of the slope triangle. So the slope, \(m\), is \(\frac{\text{vertical change}}{\text{horizontal change}}=\frac26=\frac13\). We can also see from the graph that the vertical intercept, \(b\), is 2. Putting these together, we can say that the equation for this line is \(y=\frac13x+2\).