Lesson 8
Slopes Don't Have to be Positive
Let’s find out what a negative slope means.
8.1: Which One Doesn’t Belong: Odd Line Out
Which line doesn’t belong?

8.2: Stand Clear of the Closing Doors, Please
Noah put $40 on his fare card. Every time he rides public transportation, $2.50 is subtracted from the amount available on his card.
- How much money, in dollars, is available on his card after he takes
- 0 rides?
- 1 ride?
- 2 rides?
- \(x\) rides?
-
Graph the relationship between amount of money on the card and number of rides.
- How many rides can Noah take before the card runs out of money? Where do you see this number of rides on your graph?
8.3: Travel Habits in July
Here is a graph that shows the amount on Han’s fare card for every day of last July.
-
Describe what happened with the amount on Han’s fare card in July.
-
Plot and label 3 different points on the line.
-
Write an equation that represents the amount on the card in July, \(y\), after \(x\) days.
-
What value makes sense for the slope of the line that represents the amounts on Han’s fare card in July?
Let’s say you have taken out a loan and are paying it back. Which of the following graphs have positive slope and which have negative slope?
- Amount paid on the vertical axis and time since payments started on the horizontal axis.
- Amount owed on the vertical axis and time remaining until the loan is paid off on the horizontal axis.
- Amount paid on the vertical axis and time remaining until the loan is paid off on the horizontal axis.
8.4: Payback Plan
Elena borrowed some money from her brother. She pays him back by giving him the same amount every week. The graph shows how much she owes after each week.

Answer and explain your reasoning for each question.
- What is the slope of the line?
- Explain how you know whether the slope is positive or negative.
- What does the slope represent in this situation?
- How much did Elena borrow?
- How much time will it take for Elena to pay back all the money she borrowed?
Summary
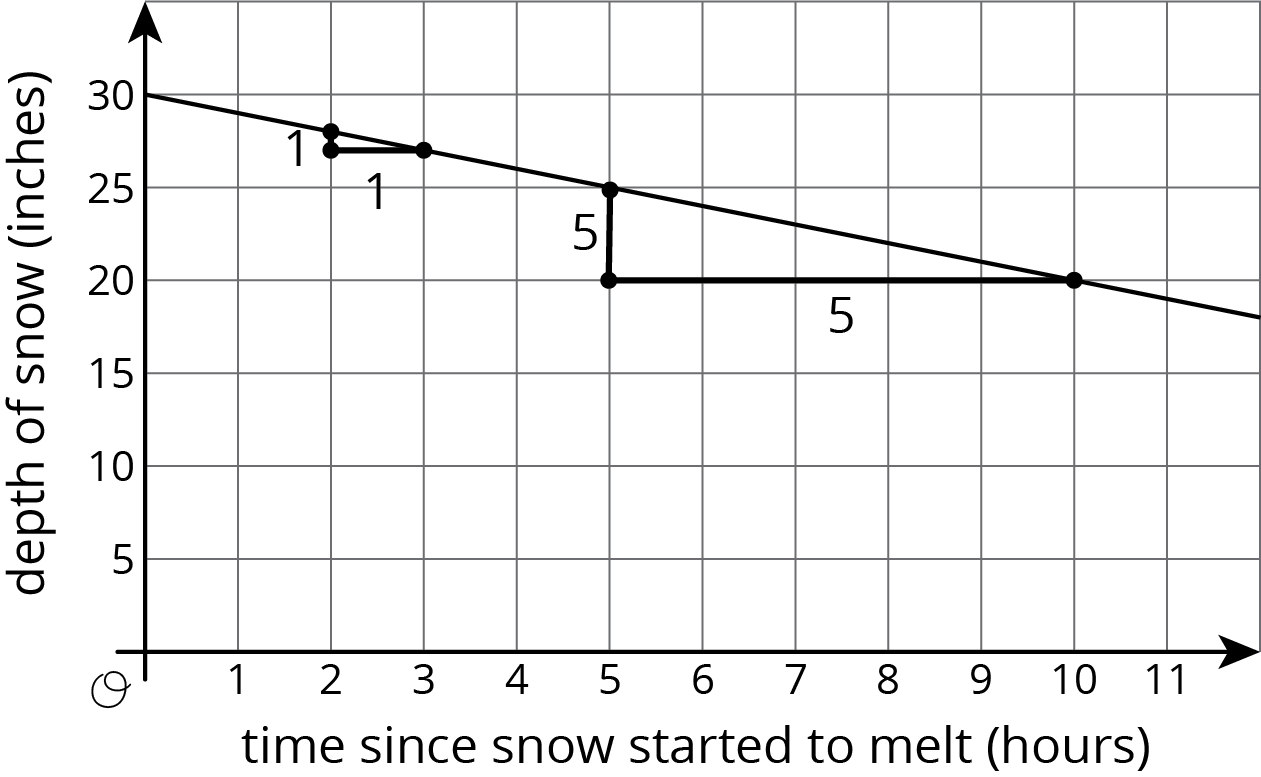
At the end of winter in Maine, the snow on the ground was 30 inches deep. Then there was a particularly warm day and the snow melted at the rate of 1 inch per hour. The graph shows the relationship between the time since the snow started to melt and the depth of the snow.

The slope of the graph is -1 since the rate of change is -1 inch per hour. That is, the depth goes down 1 inch per hour. The vertical intercept is 30 since the snow was 30 inches deep when the warmth started to melt the snow. The two slope triangles show how the rate of change is constant. It just also happens to be negative in this case since after each hour that passes, there is 1 inch less snow.
Graphs with negative slope often describe situations where some quantity is decreasing over time, like the depth of snow on warm days or the amount of money on a fare card being used to take rides on buses.
Slopes can be positive, negative, or even zero! A slope of 0 means there is no change in the \(y\)-value even though the \(x\)-value may be changing. For example, Elena won a contest where the prize was a special pass that gives her free bus rides for a year. Her fare card had \$5 on it when she won the prize. Here is a graph of the amount of money on her fare card after winning the prize:

The vertical intercept is 5, since the graph starts when she has \$5 on her fare card. The slope of the graph is \(0\) since she doesn’t use her fare card for the next year, meaning the amount on her fare card doesn’t change for a year. In fact, all graphs of linear relationships with slopes equal to 0 are horizontal—a rate of change of 0 means that, from one point to the next, the \(y\)-values remain the same.