Lesson 19
Fitting a Line to Data
Lesson Narrative
In the previous lesson, students focused primarily on the details of a scatter plot. In this lesson, their focus becomes more holistic and they begin to see a set of data points as a single thing that can be analyzed, not just a bunch of disconnected points. For the first time students see that sometimes we can model the relationship between two variables with a line (MP4), although they continue to analyze the connections between the scatter plot and the line by comparing individual points. As they zoom out and see these connections, students begin to see the structure of the scatter plot (MP7) and to use that structure to reason abstractly and quantitatively (MP2).
Learning Goals
Teacher Facing
- Compare and contrast (orally) values in a data set with predictions made using a given line.
- Comprehend that a model of data, such as a line of fit, can be used to predict values that are not given in the data.
- Identify (orally) obvious outliers on a scatter plot.
Student Facing
Let’s look at the scatter plots as a whole.
Learning Targets
Student Facing
- I can pick out outliers on a scatter plot.
- I can use a model to predict values for data.
Glossary Entries
-
outlier
An outlier is a data value that is far from the other values in the data set.
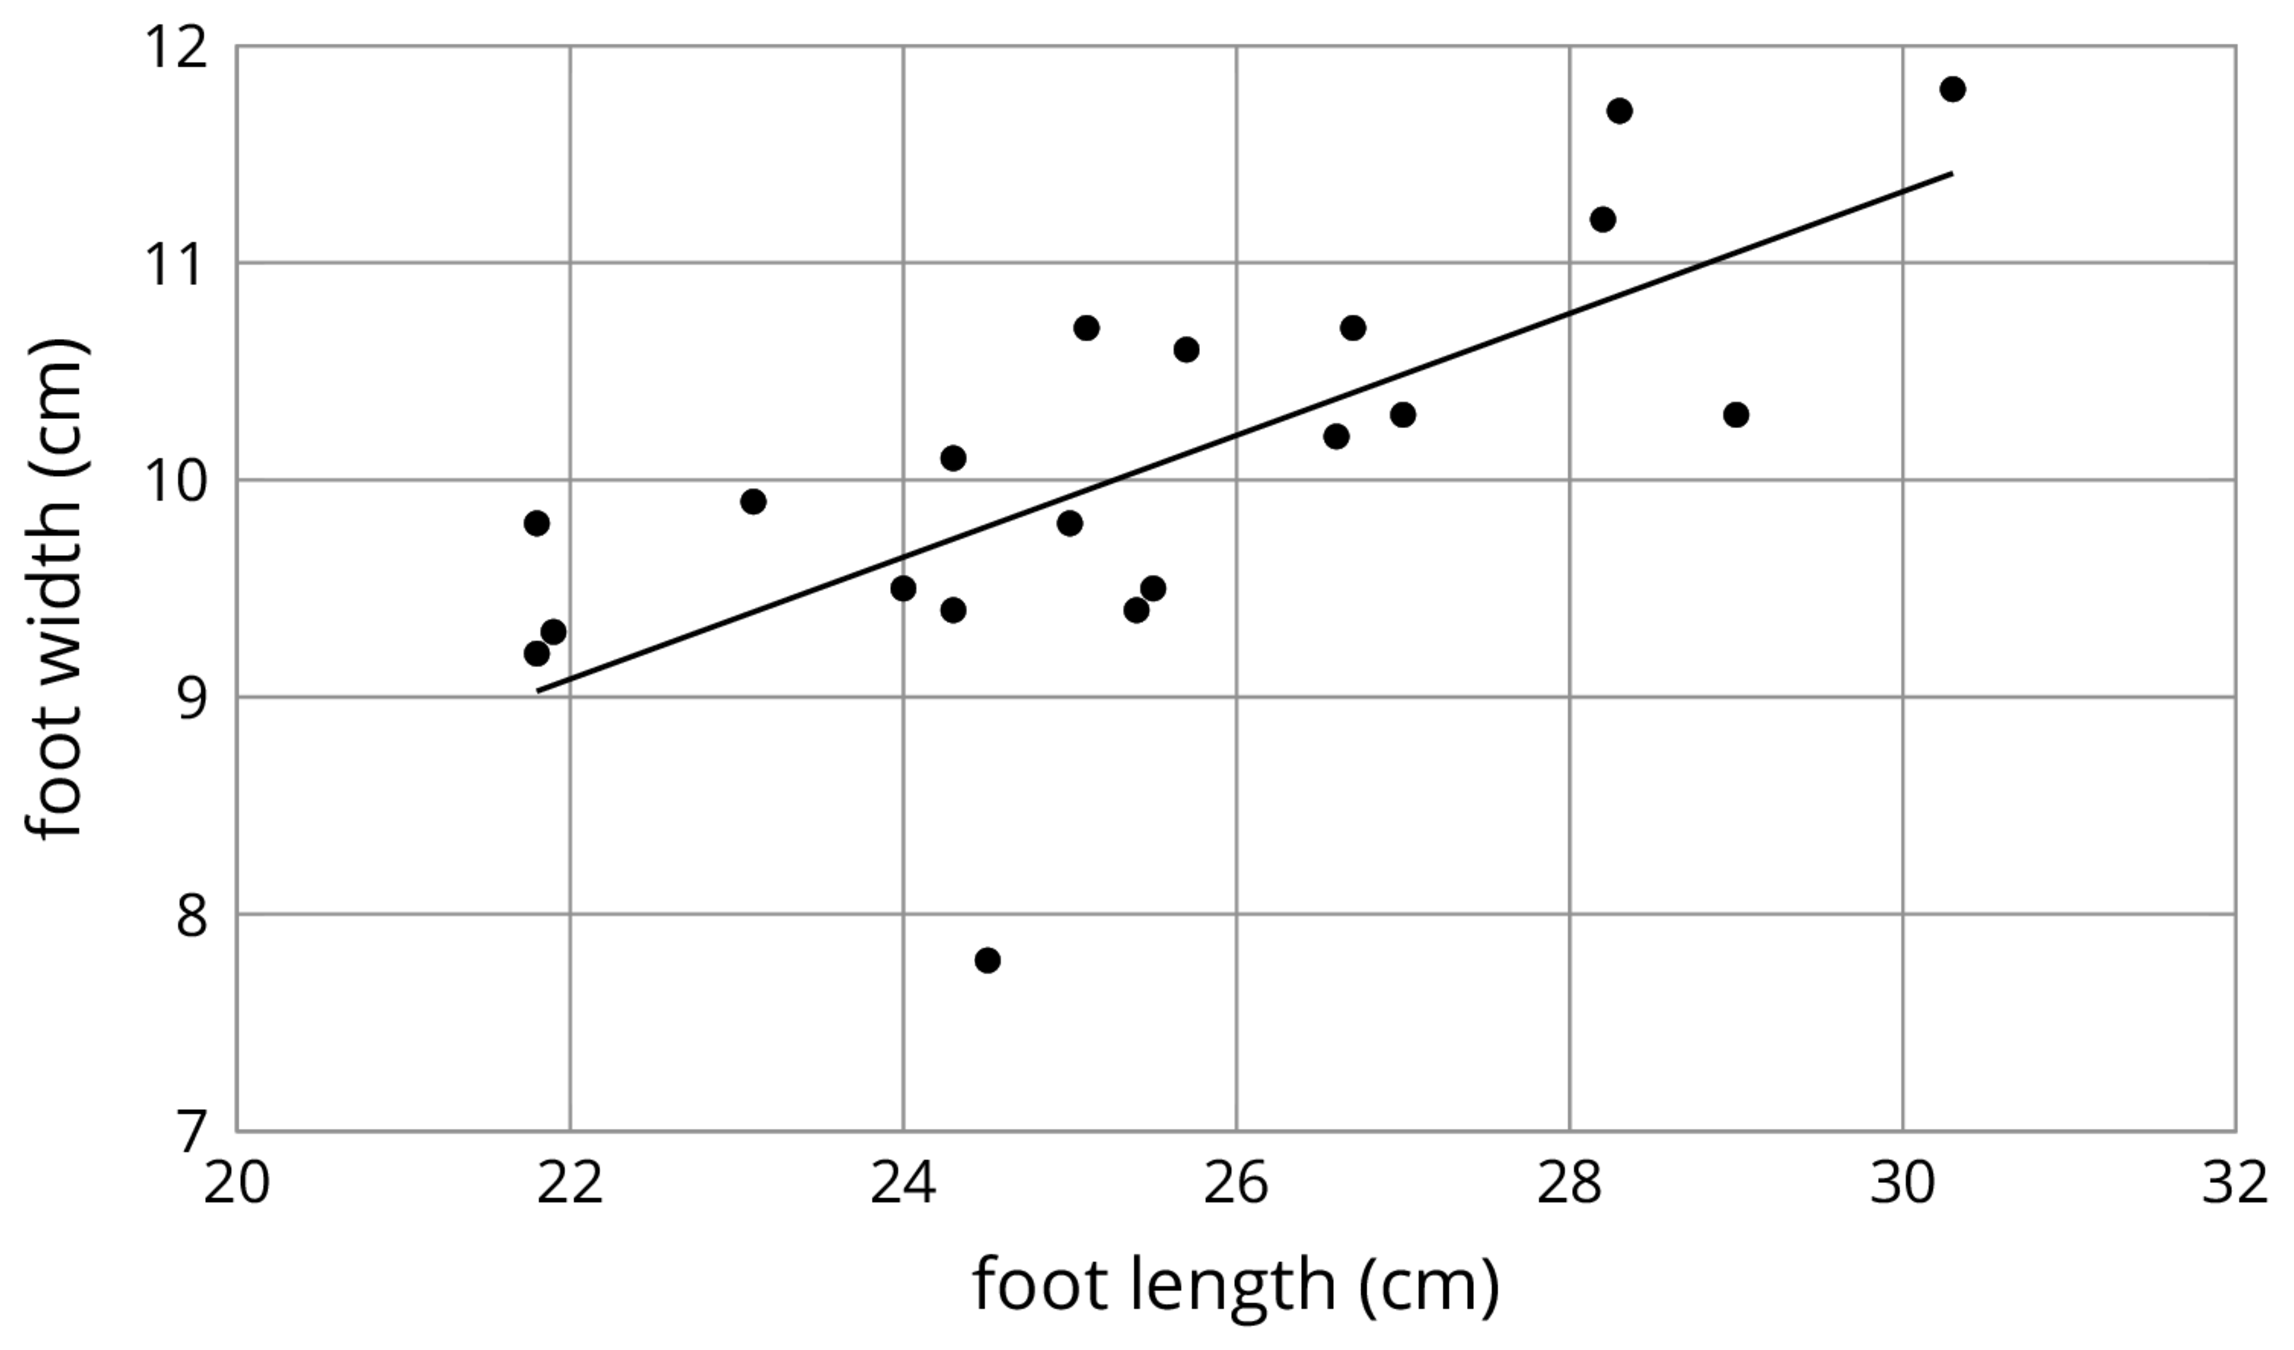
Here is a scatter plot that shows lengths and widths of 20 different left feet. The foot whose length is 24.5 cm and width is 7.8 cm is an outlier.

Print Formatted Materials
For access, consult one of our IM Certified Partners.
Additional Resources
| Google Slides | For access, consult one of our IM Certified Partners. |
|
| PowerPoint Slides | For access, consult one of our IM Certified Partners. |