Lesson 9
More and Less than 1%
9.1: Number Talk: What Percentage? (5 minutes)
Warm-up
The purpose of this number talk is to reason about a progressive set of percentages from benchmark percentages to 1% to "unfriendly" percentages. The reasoning parallels the reasoning from earlier work where students are guided to find a unit rate and use the unit rate to solve generic percentage problems. In this activity, there are five problems, so in the interest of time it may not be possible to share all possible strategies for each problem. Instead, gather two different strategies for each.
Launch
Display each problem one at a time. Give students 30 seconds of quiet think time per problem and ask them to give a signal when they have an answer and a strategy. Keep each problem displayed throughout the discussion. Follow with a whole-class discussion. Students may have difficulty understanding the wording of the question “10 is what percentage of 50?” so when discussing strategies with the whole class, use MLR 7 (Compare and Connect) to see different ways (e.g., words, equations, double number-lines, etc.) to represent and solve these problems. Ask students "What is similar and what is different?" in their approaches.
Supports accessibility for: Memory; Organization
Student Facing
Determine the percentage mentally.
10 is what percentage of 50?
5 is what percentage of 50?
1 is what percentage of 50?
17 is what percentage of 50?
Student Response
For access, consult one of our IM Certified Partners.
Anticipated Misconceptions
Students might think the question is asking them to calculate 10% of 50. Ask students a variation of the question: What percentage of 50 is 10?
Activity Synthesis
Ask students to share their strategies for each problem. Record and display their explanations for all to see. To involve more students in the conversation, consider asking:
- “Who can restate ___’s reasoning in a different way?”
- “Did anyone solve the problem the same way but would explain it differently?”
- “Did anyone solve the problem in a different way?”
- “Does anyone want to add on to _____’s strategy?”
- “Do you agree or disagree? Why?”
Since students may not have encountered the idea of percent rate recently, take the time to show any representations of the relationship that come up.
For example, a double number line:

A table:
| number | percentage of 50 |
|---|---|
| 50 | 100 |
| 10 | 20 |
| 5 | 10 |
| 1 | 2 |
| 17 | 34 |
| 75 | 150 |
An equation: If \(x\) represents the number and \(y\) represents its percentage of 50, then \(y=2x\) since 1 is 2% of 50.
A shortcut that they learned previously: For example, \(17 \div 50 = 0.34\), and 0.34 is \(\frac{34}{100}\), so 17 is 34% of 50.
Design Principle(s): Optimize output (for explanation)
9.2: Waiting Tables (10 minutes)
Activity
This activity gives students an opportunity to put into practice some things they already know about finding percent rates. Additionally, the idea of a fraction of a percent appears for the first time. Encourage students to use any representation they would like to calculate the percentage of appetizers, entrees and desserts. Monitor for students who used various representations and ask them to share during the discussion. The main focus should be on the fractional percentages they encounter in this problem for the first time.
Launch
Tell students they will be finding some more percentages. Encourage them to use any representation they understand, for example, a double number line or a table. Students in groups of 2. Give students 1–2 minutes of quiet work time, followed by partner then whole-class discussion.
If using the digital activity, students will use an applet to find and check percentages.
Supports accessibility for: Memory; Conceptual processing
Design Principle(s): Optimize output for explanation
Student Facing
During one waiter’s shift, he delivered appetizers, entrées, and desserts. What percentage of the dishes were desserts? appetizers? entrées? What do your percentages add up to?
Student Response
For access, consult one of our IM Certified Partners.
Launch
Tell students they will be finding some more percentages. Encourage them to use any representation they understand, for example, a double number line or a table. Students in groups of 2. Give students 1–2 minutes of quiet work time, followed by partner then whole-class discussion.
If using the digital activity, students will use an applet to find and check percentages.
Supports accessibility for: Memory; Conceptual processing
Design Principle(s): Optimize output for explanation
Student Facing
During one waiter’s shift, he delivered 13 appetizers, 17 entrées, and 10 desserts.
-
What percentage of the dishes he delivered were:
- desserts?
- appetizers?
- entrées?
-
What do your percentages add up to?
Student Response
For access, consult one of our IM Certified Partners.
Anticipated Misconceptions
If students round to the nearest percentage, they will get that 33% of the dishes were appetizers and 43% of the dishes were entrées. Along with the 25% desserts, their percentages will sum to 101%. Point out that all of the dishes taken as percentages should sum to 100% and encourage them to be critical of their method and try to figure out where the extra 1% came from.
Activity Synthesis
Select students to share the percentages they calculated for each type of dish the waiter delivered. Depending on the outcome of the warm-up, it may be appropriate once again to display different representations of percentages as rates per 100.
Double number line:

Table:
| number of dishes | percentage |
|---|---|
| 10 | 25 |
| 1 | 2.5 |
| 13 | 32.5 |
| 17 | 42.5 |
Equation: Students may have previously learned to represent relationships like this using an equation in a form \(y=kx\). For example, to find what percent 13 is of 40, they might write \(13=k \boldcdot 40\), and find that \(k\) is 0.325 by evaluating \(13 \div 40\). 0.325 is the rate per 1, so 32.5 is the rate per 100.
Students may have never seen a percentage that was not a whole number. Spend a few minutes making sense of this. Ask students:
- What do you notice that is different about these percentages from the ones you have looked at before? (Some of these percentages are not whole numbers.)
- What do the percentages add up to? (Exactly 100.)
- What does 32.5% of 40 mean? (It’s halfway between 32% and 33% of 40.)
9.3: Fractions of a Percent (10 minutes)
Activity
The purpose of this activity is to encourage students to look for efficient strategies while working with fractional percentages. Monitor for students using the following strategies:
- Using 1% to find 0.1%
- Making substitutions of known quantities to help compute unknown quantities
Select students to share these strategies during discussion.
Launch
Give students 5 minutes of quiet work time, followed by whole-class discussion.
Supports accessibility for: Organization; Attention
Student Facing
-
Find each percentage of 60. What do you notice about your answers?
30% of 60
3% of 60
0.3% of 60
0.03% of 60
-
20% of 5,000 is 1,000 and 21% of 5,000 is 1,050. Find each percentage of 5,000 and be prepared to explain your reasoning. If you get stuck, consider using the double number line diagram.
-
1% of 5,000
-
0.1% of 5,000
-
20.1% of 5,000
-
20.4% of 5,000

-
-
15% of 80 is 12 and 16% of 80 is 12.8. Find each percentage of 80 and be prepared to explain your reasoning.
-
15.1% of 80
-
15.7% of 80
-
Student Response
For access, consult one of our IM Certified Partners.
Student Facing
Are you ready for more?
To make Sierpinski's triangle,
- Start with an equilateral triangle. This is step 1.
- Connect the midpoints of every side, and remove the middle triangle, leaving three smaller triangles. This is step 2.
- Do the same to each of the remaining triangles. This is step 3.
- Keep repeating this process.

- What percentage of the area of the original triangle is left after step 2? Step 3? Step 10?
- At which step does the percentage first fall below 1%?
Student Response
For access, consult one of our IM Certified Partners.
Anticipated Misconceptions
When students calculate the various percentages of 60 they may make mistakes in the place value of the answers. Refer students to the previous activity's discussion. You may also want to ask students to calculate 10% of 60 and use that answer to calculate 30%.
If students get stuck calculating various percents of 5,000, recommend they use the double number line provided. Ask them:
- What percentages are visible in the bottom number line?
- How much is that 1% in reference to the top number line?
- How can we use that 1% to figure out the other percentages?
Use these same questions if students get stuck calculating 15.1% and 15.7%.
Activity Synthesis
Select previously identified students to share the different strategies used to solve the problems. For the first problem, select students who use the answer to 30% of 60 to calculate the answers to the other problems.
- One likely strategy is one where you keep dividing by 10.
- Another is to make substitutions into an expression. For example, I know that 30% of 60 is 18 and I want to find 3% of 60. I also know that 3% is \(\frac{1}{10}\) of 30%. \(\displaystyle 3\% \text{ of } 60\) \(\displaystyle \frac{1}{10} \text{ of } 30\% \text{ of } 60\) \(\displaystyle \frac{1}{10} \text{ of } 18\) \(\displaystyle 1.8\) Avoid using the terminology “moving the decimal…” and instead focus on the relationship between 30% and 3%. For the other problems, highlight strategies by students who recognized that they can use 1% of a number to calculate 0.1% of a number and make multiples of that to get, for example, 0.7% of a number.
Design Principle(s): Optimize output (for explanation)
9.4: Population Growth (15 minutes)
Optional activity
The purpose of this activity is for students to find a fractional percent increase.
Look for students who calculate the percentage first and then add them together, and students who multiply by 1.08 and 1.008, respectively.
Launch
Students in groups of 2. 4 minutes of quiet work time followed by partner and then whole-class discussion.
Supports accessibility for: Memory; Conceptual processing
Student Facing
-
The population of City A was approximately 243,000 people, and it increased by 8% in one year. What was the new population?
-
The population of city B was approximately 7,150,000, and it increased by 0.8% in one year. What was the new population?
Student Response
For access, consult one of our IM Certified Partners.
Anticipated Misconceptions
Students who want to multiply by \(1 + \frac{p}{100}\) may have trouble determining where to put the decimal. Have them think about the problem in steps. How can you find 8%? (Multiply by 0.08.) How can you find 0.8%? (Multiply by 0.008.)
Activity Synthesis
Have selected students show solutions, starting with a solution where the percentage is found first and then added to the initial amount, then the approach where one multiplies by 1.08 or 1.008, respectively. Make sure everyone understands both methods. Help students see the connections between these strategies.
Design Principle(s): Maximize meta-awareness
Lesson Synthesis
Lesson Synthesis
In this lesson, we worked with fractions of a percentage.
- “How are these percentages related to each other: 40%, 4%, 0.4%, 0.04%?” (Each is \(\frac{1}{10}\) of the previous one.)
- “How can we use 40% to help calculate the other percentages?” (Use the fact that 4% is \(\frac{1}{10}\) of 40% so if we know 40% of something we can reason to figure out 4%, 0.4% or others.)
- “If we know 1% of a number, how can we use that to help us calculate 0.5% of a number?” (Calculate 5% of that number (5 times 1%) and use same reasoning as above to figure out 0.5%. Alternatively, 0.5% of a number is half of 1% of that number.)
9.5: Cool-down - Percentages of 75 (5 minutes)
Cool-Down
For access, consult one of our IM Certified Partners.
Student Lesson Summary
Student Facing
A percentage, such as 30%, is a rate per 100. To find 30% of a quantity, we multiply it by \(30\div 100\), or 0.3.
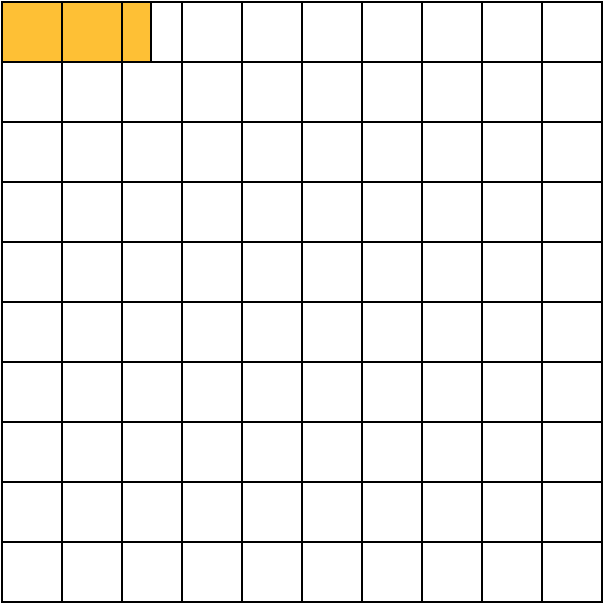
The same method works for percentages that are not whole numbers, like 7.8% or 2.5%. In the square, 2.5% of the area is shaded.
To find 2.5% of a quantity, we multiply it by \(2.5 \div 100\), or 0.025. For example, to calculate 2.5% interest on a bank balance of \$80, we multiply \((0.025)\boldcdot 80 = 2\), so the interest is \$2.
We can sometimes find percentages like 2.5% mentally by using convenient whole number percents. For example, 25% of 80 is one fourth of 80, which is 20. Since 2.5 is one tenth of 25, we know that 2.5% of 80 is one tenth of 20, which is 2.