Lesson 6
Increasing and Decreasing
6.1: Improving Their Game (10 minutes)
Warm-up
The purpose of this warm-up is to encourage students to recognize that in some situations it is helpful to think about a multiplicative increase rather than an additive increase. These situations can be described in terms of percent increase (situations in which an increase is obtained by adding a certain percentage of a quantity to itself). In this situation, total points for each sports team increase from Game 1 to Game 2, however the increases are different percentages of the first scores. For example, an increase of 8 points from 100 to 108 is not as significant as an increase from 4 points to 12 points, because in the first increase is only 8% of the original value while the second is 200% of the original value.
As students share things they notice, listen for language students use to discuss the significance of the different increases. For example, students may say that the baseball team tripled their score, which would be like the basketball team going from 100 to 300 points in the next game.
Launch
Arrange students in groups of 2. Tell students they will look at a table and think of at least one thing they notice and at least one thing they wonder. Display the table for all to see and give 1 minute of quiet think time. Ask students to give a signal when they have noticed something about the teams’ scores. Invite students to share their ideas; record and display their responses for all to see. If no students wonder which team improved the most, direct them to the second question and give them 1 minute to work with a partner.
Student Facing
Here are the scores from 3 different sports teams from their last 2 games.
| sports team | total points in game 1 | total points in game 2 |
|---|---|---|
| football team | 22 | 30 |
| basketball team | 100 | 108 |
| baseball team | 4 | 12 |
- What do you notice about the teams’ scores? What do you wonder?
- Which team improved the most? Explain your reasoning.
Student Response
For access, consult one of our IM Certified Partners.
Anticipated Misconceptions
Students may say that the football team improved the least because the 8 points could have been scored from only 1 touchdown in football, but it would have to be 3 or 4 baskets in basketball and 8 separate runs in baseball. Prompt students to look at the significance of the 8 additional points in the context of each team’s score in the game 1, rather than the mechanics of scoring in each sport.
Activity Synthesis
Poll students on which team they think improved the most. Ask a student who thinks they all improved by the same amount to share their reasoning (each team increased its score by 8 points). Then, ask a few students who said the baseball team improved the most to share their reasoning. There is no need to invoke the phrase “percent increase” or to express the change as a percent of the game 1 score at this time, but you want to plant the idea that it sometimes makes sense to describe a change relative to a starting amount, instead of just looking at absolute change. In the course of discussion, though, it may be natural to say things like the basketball team improved their score by 8% of their game 1 score, the football team improved by nearly \(\frac13\) of their game 1 score, while the baseball team tripled their game 1 score.
6.2: More Cereal and a Discounted Shirt (10 minutes)
Activity
In this activity, students are given a percent increase and use it to calculate the new value, rather than being given the original and new values to calculate the percent increase. Students can solve the problems using the double number lines but the discussion that follows will be the connection to what the words specifically mean (MP6).
As students work, monitor for students who complete the double number line diagram and any student that uses other methods to correctly reason about the problem.
Launch
Arrange students in groups of 2. Give students 5 minutes of quiet work time followed by partner then whole-class discussion.
Student Facing
-
A cereal box says that now it contains 20% more. Originally, it came with 18.5 ounces of cereal. How much cereal does the box come with now?

-
The price of a shirt is \$18.50, but you have a coupon that lowers the price by 20%. What is the price of the shirt after using the coupon?

Student Response
For access, consult one of our IM Certified Partners.
Anticipated Misconceptions
Have students use the double number line diagram if they need help figuring out 20% more.
Activity Synthesis
Select students to share their reasoning for each problem. Start with a student that used the double number line diagram to solve the problem. Then, have students share other methods they used to solve the problem, such as multiplying by 1.2 and 0.8.
Ask students:
- Did the number of ounces of cereal in the cereal box increase or decrease?
- What percentage of the original amount of cereal is the new amount of cereal?
- Did the price of the shirt increase or decrease?
- What percentage of the original price of the shirt is the new price of the shirt?
Tell students that the change on the cereal box is an example of a percent increase. The discount on the shirt is an example of a percent decrease. You might want to mention that in both cases, 100% always corresponds to the original amount before the change; however, future activities will address this concept in depth.
Supports accessibility for: Conceptual processing; Language
Design Principle(s): Maximize meta-awareness
6.3: Using Tape Diagrams (10 minutes)
Activity
The purpose of this activity is for students to understand that a percent increase of, say, 15% corresponds to 115% of the original amount, and a percent decrease of, say, 30% corresponds to 70% of the original amount.
Launch
Show students this image.
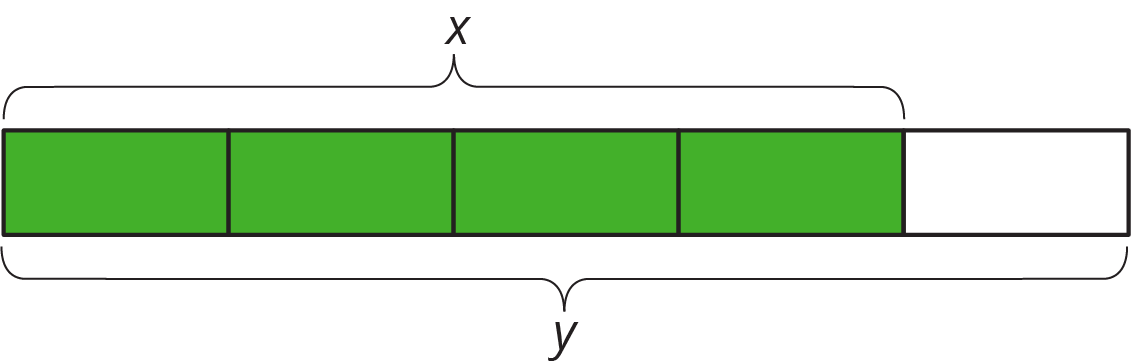
Say, "Explain how each of these is related to the diagram."
- \(x + \frac14 x\)
- \(y=1.25x\)
- 125%
- An increase of 25%
1 minute of quiet think time followed by partner and then whole group discussion.
Supports accessibility for: Visual-spatial processing
Design Principle(s): Support sense-making; Optimize output (for explanation)
Student Facing
-
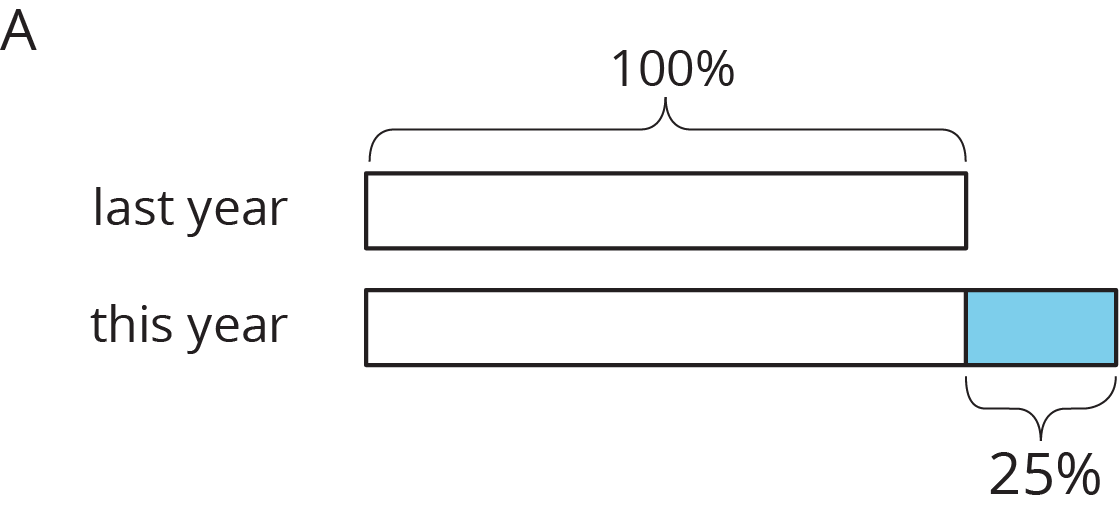
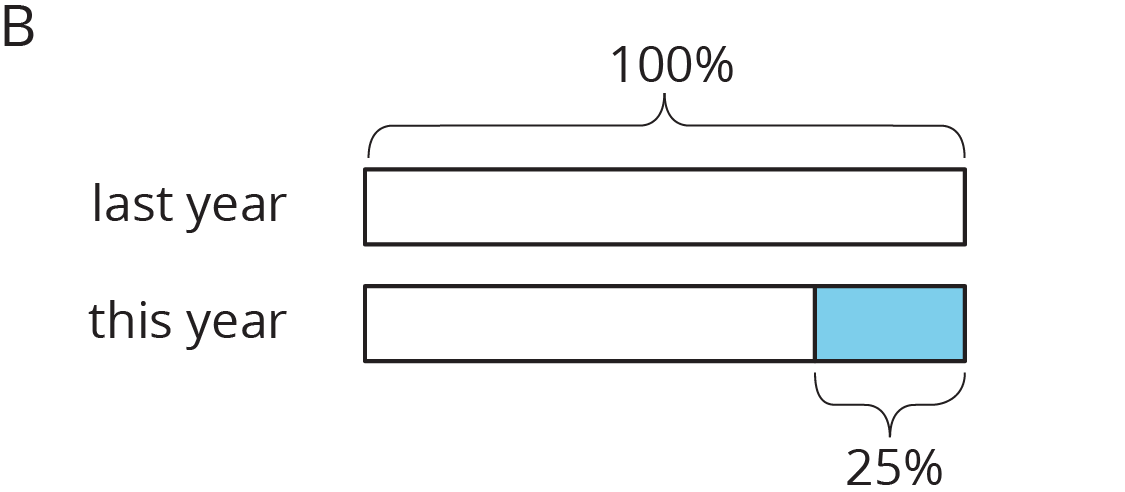
Match each situation to a diagram. Be prepared to explain your reasoning.
- Compared with last year’s strawberry harvest, this year’s strawberry harvest is a 25% increase.
- This year’s blueberry harvest is 75% of last year’s.
- Compared with last year, this year’s peach harvest decreased 25%.
- This year’s plum harvest is 125% of last year’s plum harvest.
-
Draw a diagram to represent these situations.
-
The number of ducks living at the pond increased by 40%.
- The number of mosquitoes decreased by 80%.
-
Student Response
For access, consult one of our IM Certified Partners.
Student Facing
Are you ready for more?
What could it mean to say there is a 100% decrease in a quantity? Give an example of a quantity where this makes sense.
Student Response
For access, consult one of our IM Certified Partners.
Activity Synthesis
If the amount of fruit increases by 40%, what percent of the original amount do you have?
If the amount of fruit decreases by 40%, what percent of the original amount do you have?
6.4: Agree or Disagree: Percentages (10 minutes)
Optional activity
The purpose of this activity is to for students to evaluate claims about percentages within contexts in which common misunderstandings occur (MP3). The first question prompts students to think about the original pay of each employee. Since we do not know the pay for each employee, a higher pay raise percentage does not necessarily mean a higher dollar amount. Students could disagree based on the reasoning that Employee A makes $10 per hour, so a 50% raise would be an increase of $5 per hour. However, if Employee B makes $20 per hour, a 45% raise would be an increase of $9 per hour. On the other hand, students could agree with this statement if they think both employees make the same amount. The second question prompts students to reason about the effect of trying to combine percentages. Ask students to discuss the following with their partner:
- Did you agree or disagree with one another?
- How did you test out your ideas?
- What did you notice to be true after testing out some numbers in the statement?
Launch
Arrange students in groups of 2. Give students 1 minute of quiet work time followed by partner and whole-class discussions. Refer to MLR 3 (Clarify, Critique, Correct) for prompts to build student language for evaluating a statement. One example is to use the "Always-Sometimes-Never" approach for helping students determine the validity of the statements.
Design Principle(s): Optimize output (for justification)
Student Facing
Do you agree or disagree with each statement? Explain your reasoning.
-
Employee A gets a pay raise of 50%. Employee B gets a pay raise of 45%. So Employee A gets the bigger pay raise.
- Shirts are on sale for 20% off. You buy two of them. As you pay, the cashier says, “20% off of each shirt means 40% off of the total price.”
Student Response
For access, consult one of our IM Certified Partners.
Anticipated Misconceptions
Students may agree with both statements at first as the statements themselves are common misconceptions. Ask these students to assign values to the pieces of the statement and test them out. For example, assign how much each employee makes in the first statement or how much each shirt costs in the second statement.
Activity Synthesis
Poll students if they agree or disagree with each statement and ask students to explain their reasoning. Record and display student explanations for all to see. To involve more students in the conversation, consider asking some of the following questions:
- “Do you agree or disagree? Why?”
- “Did anyone think about the statement in the same way but would explain it differently?”
- “Does anyone want to add on to _______’s reasoning?”
Lesson Synthesis
Lesson Synthesis
Students should be able to apply their understanding of proportional increases and decreases, from previous lessons, to problems involving percents.
- “What is another way to describe a 25% percent increase or decrease?” (when we increase or decrease a quantity by adding or subtracting \(\frac14\) of the original quantity)
- “When a quantity is increased or decreased, what percent describes the original or starting value?” (100%)
- “What strategies have we used to help us calculate percent increase and decrease?” (double number line, table, equation)
6.5: Cool-down - Fish Population (5 minutes)
Cool-Down
For access, consult one of our IM Certified Partners.
Student Lesson Summary
Student Facing
Imagine that it takes Andre \(\frac34\) more than the time it takes Jada to get to school. Then we know that Andre’s time is \(1\frac34\) or 1.75 times Jada’s time. We can also describe this in terms of percentages:

We say that Andre’s time is 75% more than Jada’s time. We can also see that Andre’s time is 175% of Jada’s time. In general, the terms percent increase and percent decrease describe an increase or decrease in a quantity as a percentage of the starting amount.
For example, if there were 500 grams of cereal in the original package, then “20% more” means that 20% of 500 grams has been added to the initial amount, \(500+(0.2)\boldcdot 500=600\), so there are 600 grams of cereal in the new package.
We can see that the new amount is 120% of the initial amount because
\(\displaystyle 500+(0.2)\boldcdot 500 = (1 + 0.2)500\)