Lesson 3
Exploring Circumference
3.1: Which Is Greater? (5 minutes)
Warm-up
The purpose of this warm-up is to help students visualize circumference as a linear measurement, in preparation for examining the relationship between diameter and circumference in the next activity. Some students may be able to imagine unrolling the tube into a rectangle in order to compare its length and width. Other students may benefit from hands on experience with a real toilet paper tube.
Launch
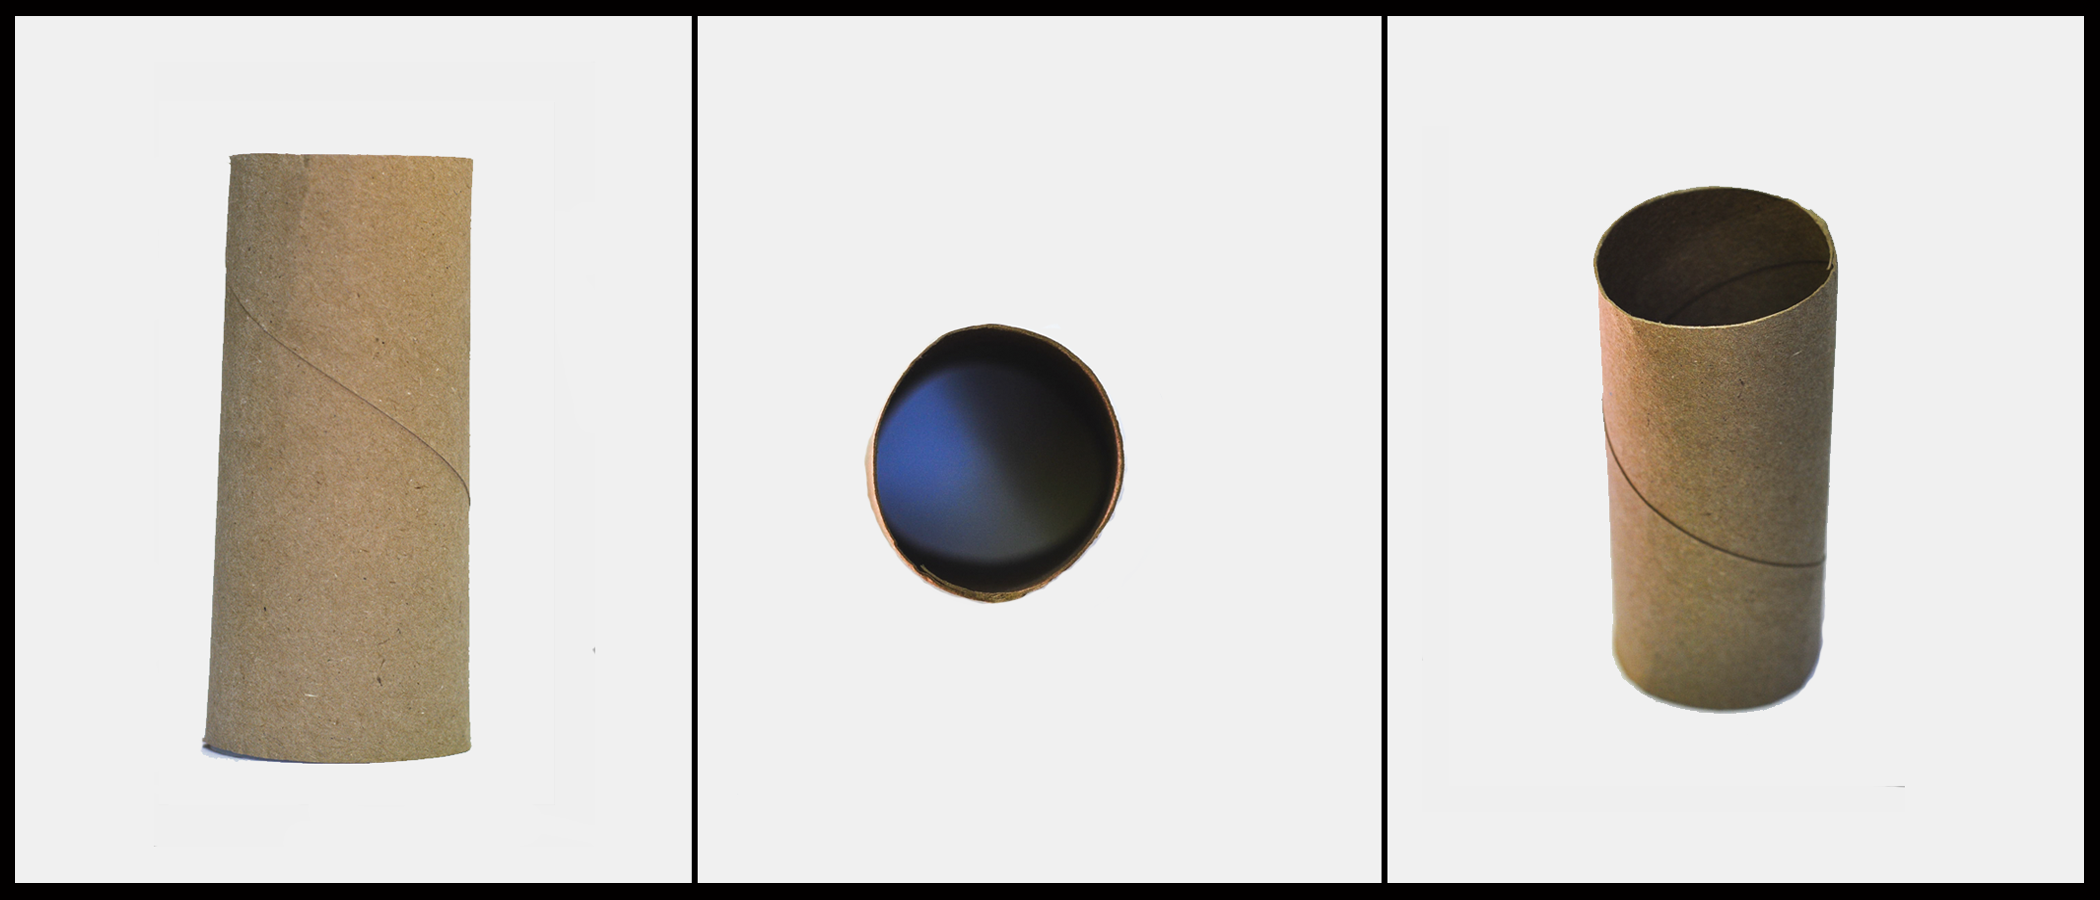
Arrange students in groups of 2. Display the image for all to see. Ask students to indicate when they have reasoning to support their response. Give students 1 minute of quiet think time and then time to share their thinking with their group.
Student Facing
Clare wonders if the height of the toilet paper tube or the distance around the tube is greater. What information would she need in order to solve the problem? How could she find this out?
Student Response
For access, consult one of our IM Certified Partners.
Anticipated Misconceptions
Students may not understand what is meant by the height of the tube because it can sit in two different ways. Point these students to the first picture of the tube, and ask them to identify the height as the tube is sitting in that picture.
Activity Synthesis
Poll students on which length they think is greater. Consider re-displaying the image for reference while students are explaining what they saw. To involve more students in the conversation, consider asking some of the following questions:
- What was important to you when making your decision?
- Did anyone think about the measurements in a different way?
- Do you agree or disagree? Why?
- What information do you think would help you make a better decision? If an actual toilet paper tube is available, demonstrate measuring the tube by unrolling the tube to measure the circumference and height.
It turns out that for a standard toilet paper tube, the distance around is greater than the distance from top to bottom.
3.2: Measuring Circumference and Diameter (25 minutes)
Activity
In this activity, students measure the diameter and circumference of different circular objects and plot the data on a coordinate plane, recalling the structure of the first activity in this unit where they measured different parts of squares. Students use a graph in order to conjecture an important relationship between the circumference of a circle and its diameter (MP 5). They notice that the two quantities appear to be proportional to each other. Based on the graph, they estimate that the constant of proportionality is close to 3 (a table of values shows that it is a little bigger than 3). This is their first estimate of pi.
This activity provides good, grade-appropriate evidence that there is a constant of proportionality between the circumference of a circle and its diameter. Students will investigate this relationship further in high school, using polygons inscribed in a circle for example.
To measure the circumference, students can use a flexible measuring tape or a piece of string wrapped around the object and then measure with a ruler. As students measure, encourage them to be as precise as possible. Even so, the best precision we can expect for the proportionality constant in this activity is “around 3” or possibly “a little bit bigger than 3.” This could be a good opportunity to talk about how many digits in the answer is reasonable. To get a good spread of points on the graph, it is important to use circles with a wide variety of diameters, from 3 cm to 25 cm. If there are points that deviate noticeably from the overall pattern, discuss how measurement error plays a factor.
As students work, monitor and select students who notice that the relationship between diameter and circumference appears to be proportional, and ask them to share during the whole-group discussion.
If students are using the digital version of the activity, they don’t necessarily need to measure physical objects, but we recommend they do so anyway.
Launch
Arrange students in groups of 2–4. Distribute 3 circular objects and measuring tapes or string and rulers to each group. Especially if using string and rulers, it may be necessary to demonstrate the method for measuring the circumference.
Ask students to complete the first two questions in their group, and then gather additional information from two other groups (who measured different objects) for the third question.
If using the digital activity, students can work in groups of 2–4. They only need the applet to generate data for their investigation.
Supports accessibility for: Organization; Attention
Student Facing
Your teacher will give you several circular objects.
-
Explore the applet to find the diameter and the circumference of three circular objects to the nearest tenth of a unit. Record your measurements in the table.
-
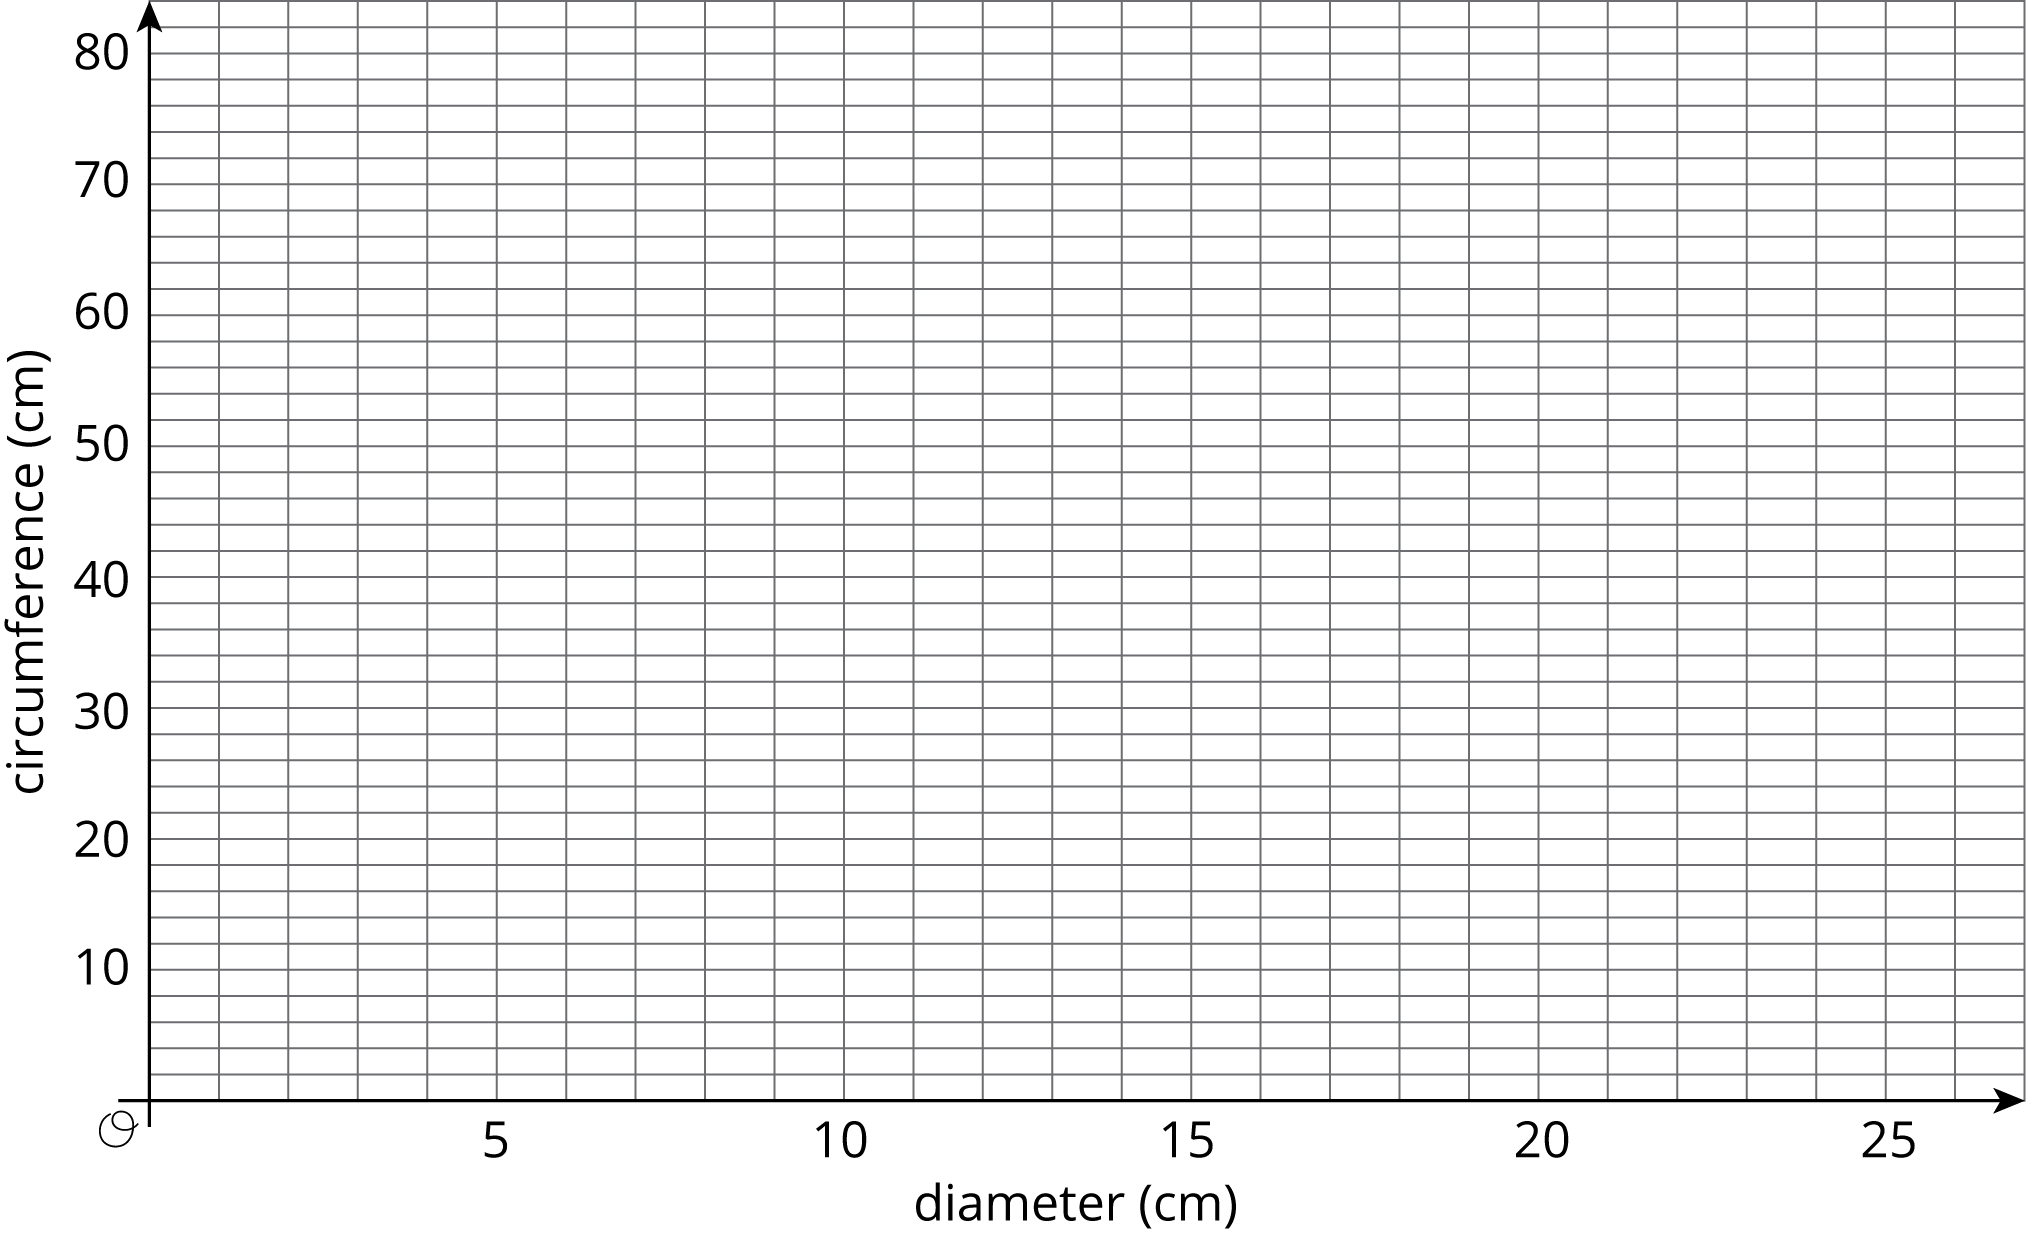
Plot the diameter and circumference values from the table on the coordinate plane. What do you notice?
- Plot the points from two other groups on the same coordinate plane. Do you see the same pattern that you noticed earlier?
Student Response
For access, consult one of our IM Certified Partners.
Launch
Arrange students in groups of 2–4. Distribute 3 circular objects and measuring tapes or string and rulers to each group. Especially if using string and rulers, it may be necessary to demonstrate the method for measuring the circumference.
Ask students to complete the first two questions in their group, and then gather additional information from two other groups (who measured different objects) for the third question.
If using the digital activity, students can work in groups of 2–4. They only need the applet to generate data for their investigation.
Supports accessibility for: Organization; Attention
Student Facing
Your teacher will give you several circular objects.
-
Measure the diameter and the circumference of the circle in each object to the nearest tenth of a centimeter. Record your measurements in the table.
object diameter (cm) circumference (cm) -
Plot the diameter and circumference values from the table on the coordinate plane. What do you notice?
-
Plot the points from two other groups on the same coordinate plane. Do you see the same pattern that you noticed earlier?
Student Response
For access, consult one of our IM Certified Partners.
Anticipated Misconceptions
Students may try to measure the diameter without going across the widest part of the circle, or may struggle with measuring around the circumference. Mentally check that their measurements divide to get approximately 3 or compare with your own prepared table of data and prompt them to re-measure when their measurements are off by too much. If the circular object has a rim or lip, this could help students keep the measuring tape in place while measuring the circumference.
If students are struggling to see the proportional relationship, remind them of recent examples where they have seen similar graphs of proportional relationships. Ask them to estimate additional diameter-circumference pairs that would fit the pattern shown in the graph. Based on their graphs, do the values of the circumferences seem to relate to those of the diameters in a particular way? What seems to be that relationship?
Activity Synthesis
Display a graph for all to see, and plot some of the students’ measurements for diameter and circumference. In cases where the same object was measured by multiple groups, include only one measurement per object. Ask students to share what they notice and what they wonder about the graph.
- Students may notice that the measurements appear to lie on a line (or are close to lying on a line) that goes through \((0, 0)\). If students do not mention a proportional relationship, make this explicit.
- Students may wonder why some points are not on the line or what the constant of proportionality is.
Invite students to estimate the constant of proportionality. From the graph, it may be difficult to make a better estimate than about 3. Another strategy is to add a column to the table, and compute the quotient of the circumference divided by the diameter for each row. For example,
| object | diameter (cm) | circumference (cm) | \(\text{circumference} \div \text{diameter}\) |
|---|---|---|---|
| soup can | 6.8 | 21.5 | 3.2 |
| tomato paste can | 5.4 | 17 | 3.1 |
| tuna can | 8.5 | 26.5 | 3.1 |
Ask students why these numbers might not be exactly the same (measurement error, rounding). Use the average of the quotients, rounded to one or two decimal places, to come up with a “working value” of the constant of proportionality: for the numbers in the sample table above, 3.1 would be an appropriate value. This class-generated proportionality constant will be used in the next activity, to help students understand how to compute circumference from diameter and vice versa. There’s no need to mention pi or its usual approximations yet.
Time permitting, it could be worth discussing accuracy of measurements for circumference and diameter. Measuring the diameter to the nearest tenth of a centimeter can be done pretty reliably with a ruler. Measuring the circumference of a circle to the nearest tenth of a centimeter may or may not be reliable, depending on the method used. Wrapping a flexible measuring tape around the object is likely the most accurate method for measuring the circumference of a circle.
Design Principle(s): Cultivate conversation; Maximize meta-awareness
3.3: Calculating Circumference and Diameter (10 minutes)
Activity
In this task, students use the constant of proportionality they estimated in the previous task to calculate circumferences of circles given the diameter and vice versa. The purpose is to reinforce the proportional relationship between circumference \(c\) and diameter \(d\) and use the formula \(c=kd\), where \(k\) is about 3 or 3.1 (the value agreed upon in the previous task).
If there is not sufficient time to allow students to work through all of the calculations, consider dividing up the work, assigning one circle to each student or group of students. It is important to save enough time for the discussion about the meaning and value of \(\pi\) at the end of this activity.
Before students begin the task, a digital applet found at http://ggbm.at/H8UuD96V can be used to reinforce the constant of proportionality.
Launch
Ask students to label these measurements given in the table on the picture of the circles. Instruct students to use the constant of proportionality the class estimated in the previous activity. Give students quiet work time followed by whole-class discussion.
Student Facing
Here are five circles. One measurement for each circle is given in the table.
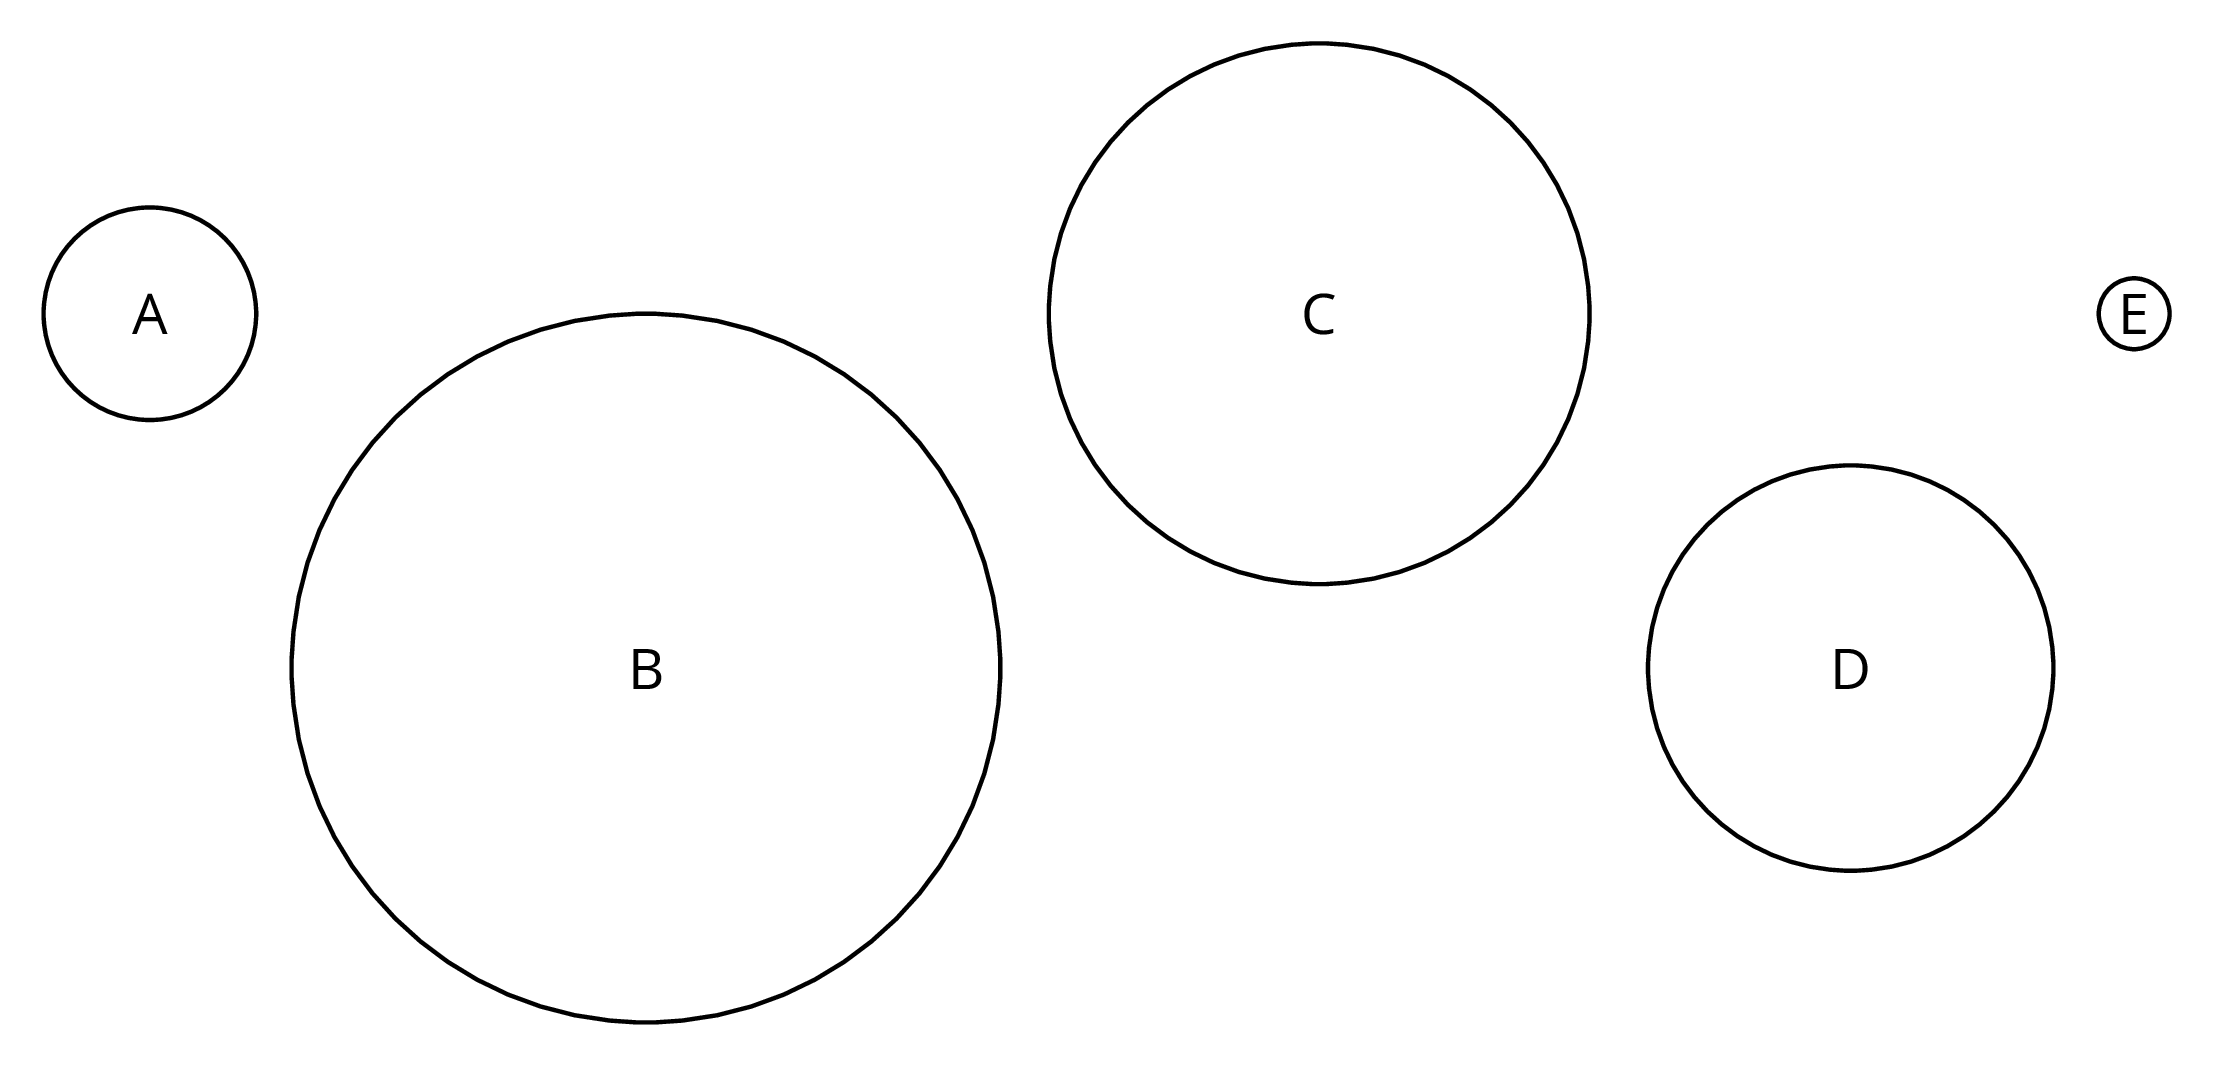
Use the constant of proportionality estimated in the previous activity to complete the table.
| diameter (cm) | circumference (cm) | |
|---|---|---|
| circle A | 3 | |
| circle B | 10 | |
| circle C | 24 | |
| circle D | 18 | |
| circle E | 1 |
Student Response
For access, consult one of our IM Certified Partners.
Student Facing
Are you ready for more?
The circumference of Earth is approximately 40,000 km. If you made a circle of wire around the globe, that is only 10 meters (0.01 km) longer than the circumference of the globe, could a flea, a mouse, or even a person creep under it?
Student Response
For access, consult one of our IM Certified Partners.
Anticipated Misconceptions
Some students may multiply the circumference by the constant of proportionality instead of dividing by it. Prompt them to consider whether the diameter can be longer than the circumference of a circle.
Some students may struggle to divide by 3.1 if that is the constant of proportionality decided on in the previous lesson. Ask these students if they could use an easier number as their constant, and allow them to divide by 3 instead. Then ask them how their answer would have changed if they divided by 3.1.
Activity Synthesis
Display the table from the task statement for all to see. Ask students to share their answers and write these in the table, resolving any discrepancies.
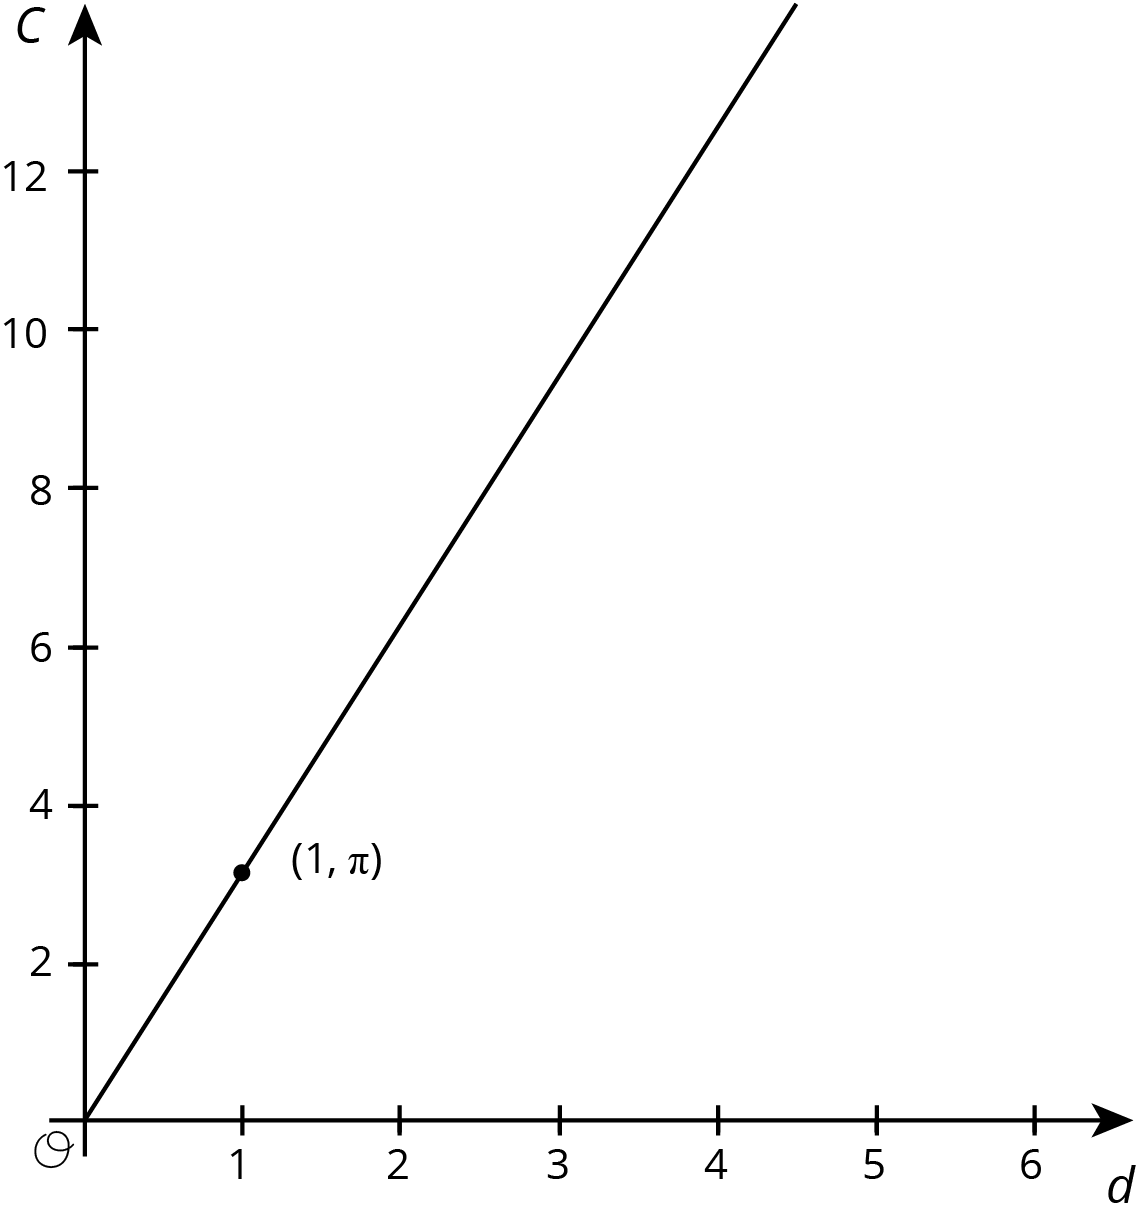
Ask students if they noticed any connections between the tables and the graphs from the previous activity. Students will have used the equation \(C=kd\), possibly without realizing it, to fill in the missing information so it is important for them to make this connection. To reinforce this connection, add the points from the table they just completed to the graph from the previous activity. Point out that the constant of proportionality appears in the table as the unit rate in the row with diameter 1 cm.
Ask if students have heard of the number pi or seen the symbol \(\pi\). Define \(\pi\) as the exact value of the constant of proportionality for this relationship. Explain that the exact value of \(\pi\) is a decimal with infinitely many digits and no repeating pattern, so an approximation is often used. Frequently used approximations for \(\pi\) include \(\frac{22} 7\), 3.14, and 3.14159, but none of these are exactly equal to \(\pi\).
Lesson Synthesis
Lesson Synthesis
The main ideas are:
- Diameter and circumference are proportional to each other.
- We can find one from the other using the relationship \(C=kd\), where \(k\) is the proportionality constant, which we have estimated as 3.1 (average from task “Measuring Circumference and Diameter”). For example, for a circle of diameter 4 cm, we have \(3.1\boldcdot 4 \approx 12.4\), so the circle has a circumference approximately equal to 12.4 cm.
- The exact constant of proportionality is called \(\pi\). Frequently used approximations for \(\pi\) are \(\frac{22} 7\), 3.14, and 3.14159, but none of these are exactly \(\pi\).
3.4: Cool-down - Identifying Circumference and Diameter (5 minutes)
Cool-Down
For access, consult one of our IM Certified Partners.
Student Lesson Summary
Student Facing
There is a proportional relationship between the diameter and circumference of any circle. That means that if we write \(C\) for circumference and \(d\) for diameter, we know that \(C=kd\), where \(k\) is the constant of proportionality.
The exact value for the constant of proportionality is called \(\boldsymbol\pi\). Some frequently used approximations for \(\pi\) are \(\frac{22} 7\), 3.14, and 3.14159, but none of these is exactly \(\pi\).
We can use this to estimate the circumference if we know the diameter, and vice versa. For example, using 3.1 as an approximation for \(\pi\), if a circle has a diameter of 4 cm, then the circumference is about \((3.1)\boldcdot 4 = 12.4\) or 12.4 cm.
The relationship between the circumference and the diameter can be written as
\(\displaystyle C = \pi d\)