Lesson 1
How Well Can You Measure?
1.1: Estimating a Percentage (5 minutes)
Warm-up
This warm-up gets students ready to think about making estimates of quotients. Estimation will be central in how students learn about the circumference and area of a circle.
Launch
Instruct students to find a method of estimation other than performing long division.
Student Facing
A student got 16 out of 21 questions correct on a quiz. Use mental estimation to answer these questions.
- Did the student answer less than or more than 80% of the questions correctly?
- Did the student answer less than or more than 75% of the questions correctly?
Student Response
For access, consult one of our IM Certified Partners.
Activity Synthesis
Ask students to share their strategies for each problem. Record and display their explanations for all to see. Ask students if or how the factors in the problem impacted the strategy choice. To involve more students in the conversation, consider asking:
- “Who can restate ___’s reasoning in a different way?”
- “Did anyone solve the problem the same way but would explain it differently?”
- “Did anyone solve the problem in a different way?”
- “Does anyone want to add on to _____’s strategy?”
- “Do you agree or disagree? Why?”
1.2: Perimeter of a Square (15 minutes)
Activity
In this activity, students examine the relationship between the length of the diagonal and the perimeter for squares of different sizes. This prepares students for examining the relationship between the diameter and circumference of circles in a future lesson.
Students graph their measurements and find that the points look like they are close to lying on a line through the origin, suggesting that there is a proportional relationship between these quantities. This makes sense because the squares can all be viewed as scale copies of one square and both the side length and the diagonal should change by the same scale factor.
Because of measurement error, the points do not lie exactly on a line. Whenever analyzing proportional relationships through experimentation, small errors can be expected.
Launch
Arrange students in groups of 3. Distribute copies of the blackline master and rulers.
Explain that students will only work with 3 of the squares for now and can fill in the other rows of the table at the end of the activity. Assign each group to work with either squares A, B, C, squares D, E, F, or squares G, H, I.
Supports accessibility for: Language; Organization
Student Facing
Your teacher will give you a picture of 9 different squares and will assign your group 3 of these squares to examine more closely.
-
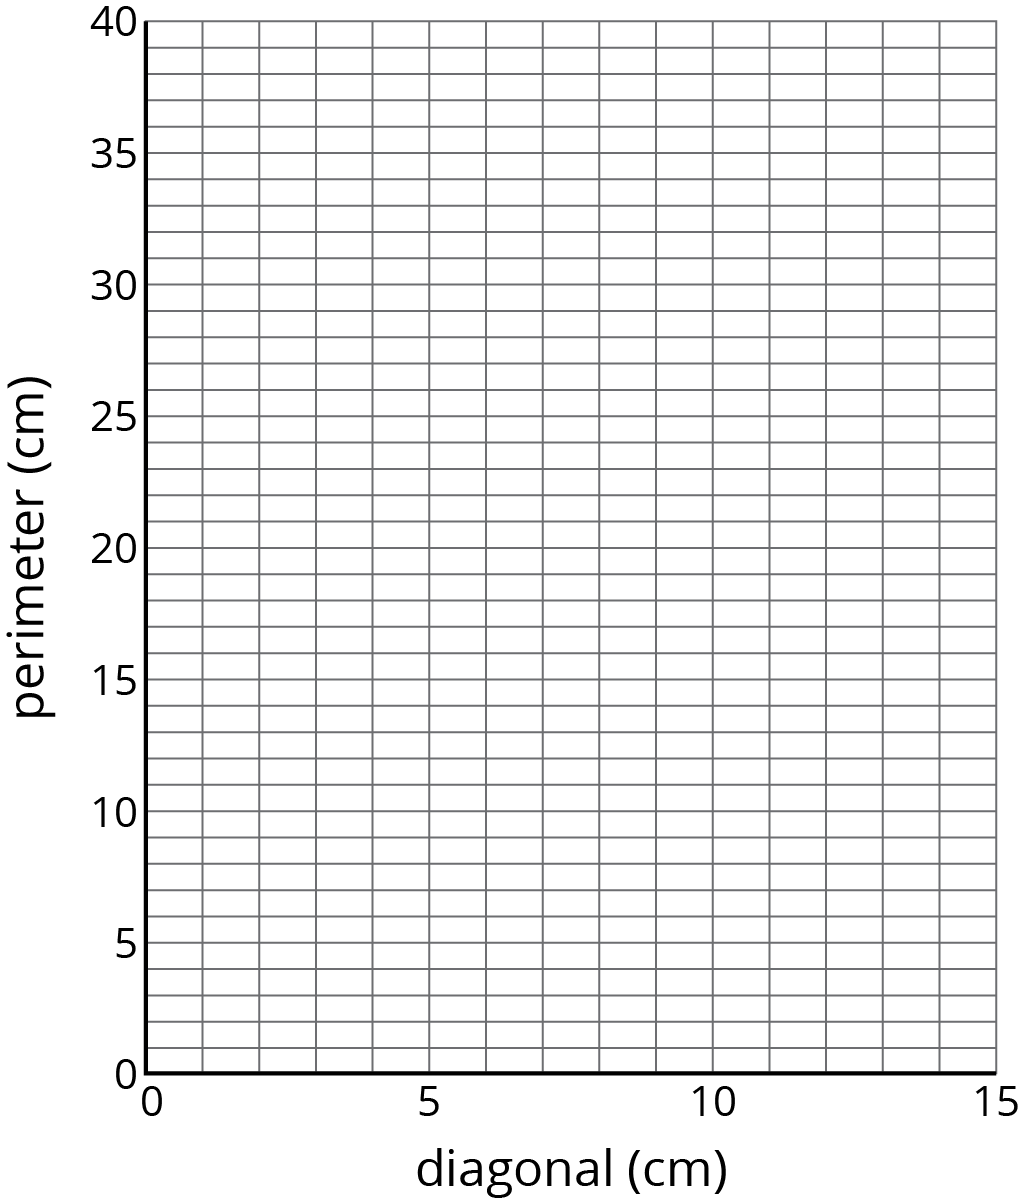
For each of your assigned squares, measure the length of the diagonal and the perimeter of the square in centimeters.
Check your measurements with your group. After you come to an agreement, record your measurements in the table.
diagonal (cm) perimeter (cm) square A square B square C square D square E square F square G square H square I -
Plot the diagonal and perimeter values from the table on the coordinate plane.
-
What do you notice about the points on the graph?
Pause here so your teacher can review your work.
- Record measurements of the other squares to complete your table.
Student Response
For access, consult one of our IM Certified Partners.
Launch
Arrange students in groups of 3. Distribute copies of the blackline master and rulers.
Explain that students will only work with 3 of the squares for now and can fill in the other rows of the table at the end of the activity. Assign each group to work with either squares A, B, C, squares D, E, F, or squares G, H, I.
Supports accessibility for: Language; Organization
Student Facing
Your teacher will give you a picture of 9 different squares and will assign your group 3 of these squares to examine more closely.
-
For each of your assigned squares, measure the length of the diagonal and the perimeter of the square in centimeters.
Check your measurements with your group. After you come to an agreement, record your measurements in the table.
diagonal (cm) perimeter (cm) square A square B square C square D square E square F square G square H square I -
Plot the diagonal and perimeter values from the table on the coordinate plane.
-
What do you notice about the points on the graph?
Pause here so your teacher can review your work.
- Record measurements of the other squares to complete your table.
Student Response
For access, consult one of our IM Certified Partners.
Activity Synthesis
The goal of this discussion is for students to see that there is a proportional relationship between the length of the diagonal and the perimeter of a square, even though it is difficult to measure accurately enough to get an exact constant of proportionality.
First, ask students to share what they noticed about their graphs. Next, display a table like the one in students’ books or devices and poll the class on the measurements they got for each square. If desired, give students 1–2 minutes to plot more points on their graph for the values they added to their tables.
Use questions like the following to lead students to the idea that the length of the diagonal and the perimeter are proportional to each other. Even though the data does not lie perfectly on a line, the inconsistencies are caused by measurement error.
- “Would it makes sense to have \((0,0)\) as a possible point?” (Yes, since a square with diagonal 0 cm would have a perimeter of 0 cm.)
- “The data is not perfectly lined up. Do you think it should be? What could be causing the inconsistencies?” (Measurement error.)
- “If you had a square with diagonal 1 cm, what would the perimeter be?” (About 2.8 cm.)
Consider adding a column to the table with the quotient of the perimeter of the square divided by the length of the diagonal to help students identify the constant of proportionality for the relationship. Sample data is included in the table below. While the level of precision of their measurements does not justify including this many decimals places for the quotients, they are shown in this sample table because it is important that students notice the variability in the numbers and come to their own realization that these quotients are all approximately 2.8.
| diagonal (cm) | perimeter (cm) | \(\text{perimeter} \div\text{diagonal}\) | |
|---|---|---|---|
| square A | 5.7 | 16.1 | 2.825 |
| square B | 8.2 | 23.2 | 2.841 |
| square C | 3.4 | 9.6 | 2.824 |
| square D | 4.2 | 11.9 | 2.833 |
| square E | 6.8 | 19.2 | 2.823 |
| square F | 10.5 | 30 | 2.857 |
| square G | 2.2 | 6.2 | 2.818 |
| square H | 12.6 | 35.2 | 2.793 |
| square I | 5.5 | 15.6 | 2.836 |
When we collect data through measurement, we usually will introduce small errors into the data. Even though the data will look a little bit “bumpy,” it will often show the underlying relationships between two quantities. In this case, we were able to use the plotted data to estimate the constant of proportionality. Once we have an estimate for the constant of proportionality, we can find other diagonal lengths given the perimeter or other perimeters given the diagonal length. In a situation like this, analyzing the graph is a powerful method to check visually to see if a relationship looks like it may be proportional. The table not only helps to confirm this but also gives the approximate constant of proportionality.
1.3: Area of a Square (15 minutes)
Activity
This activity builds on the previous one as students plot a different relationship, comparing the length of each square diagonal to its area. Students use the length measurements from the previous activity and use them to calculate the area of the squares. Unlike in the previous activity, this time both the table and the graph show that the relationship between diagonal length and area is not close to being proportional. As a result, the measurement error does not play a role in this activity. Rather, the focus is on identifying that a relationship is not proportional: this is an example of MP7 because students will identify that there is no constant of proportionality in the table (not even allowing for measurement error) and will correspondingly notice that the plotted points are not close to lying on a line.
Launch
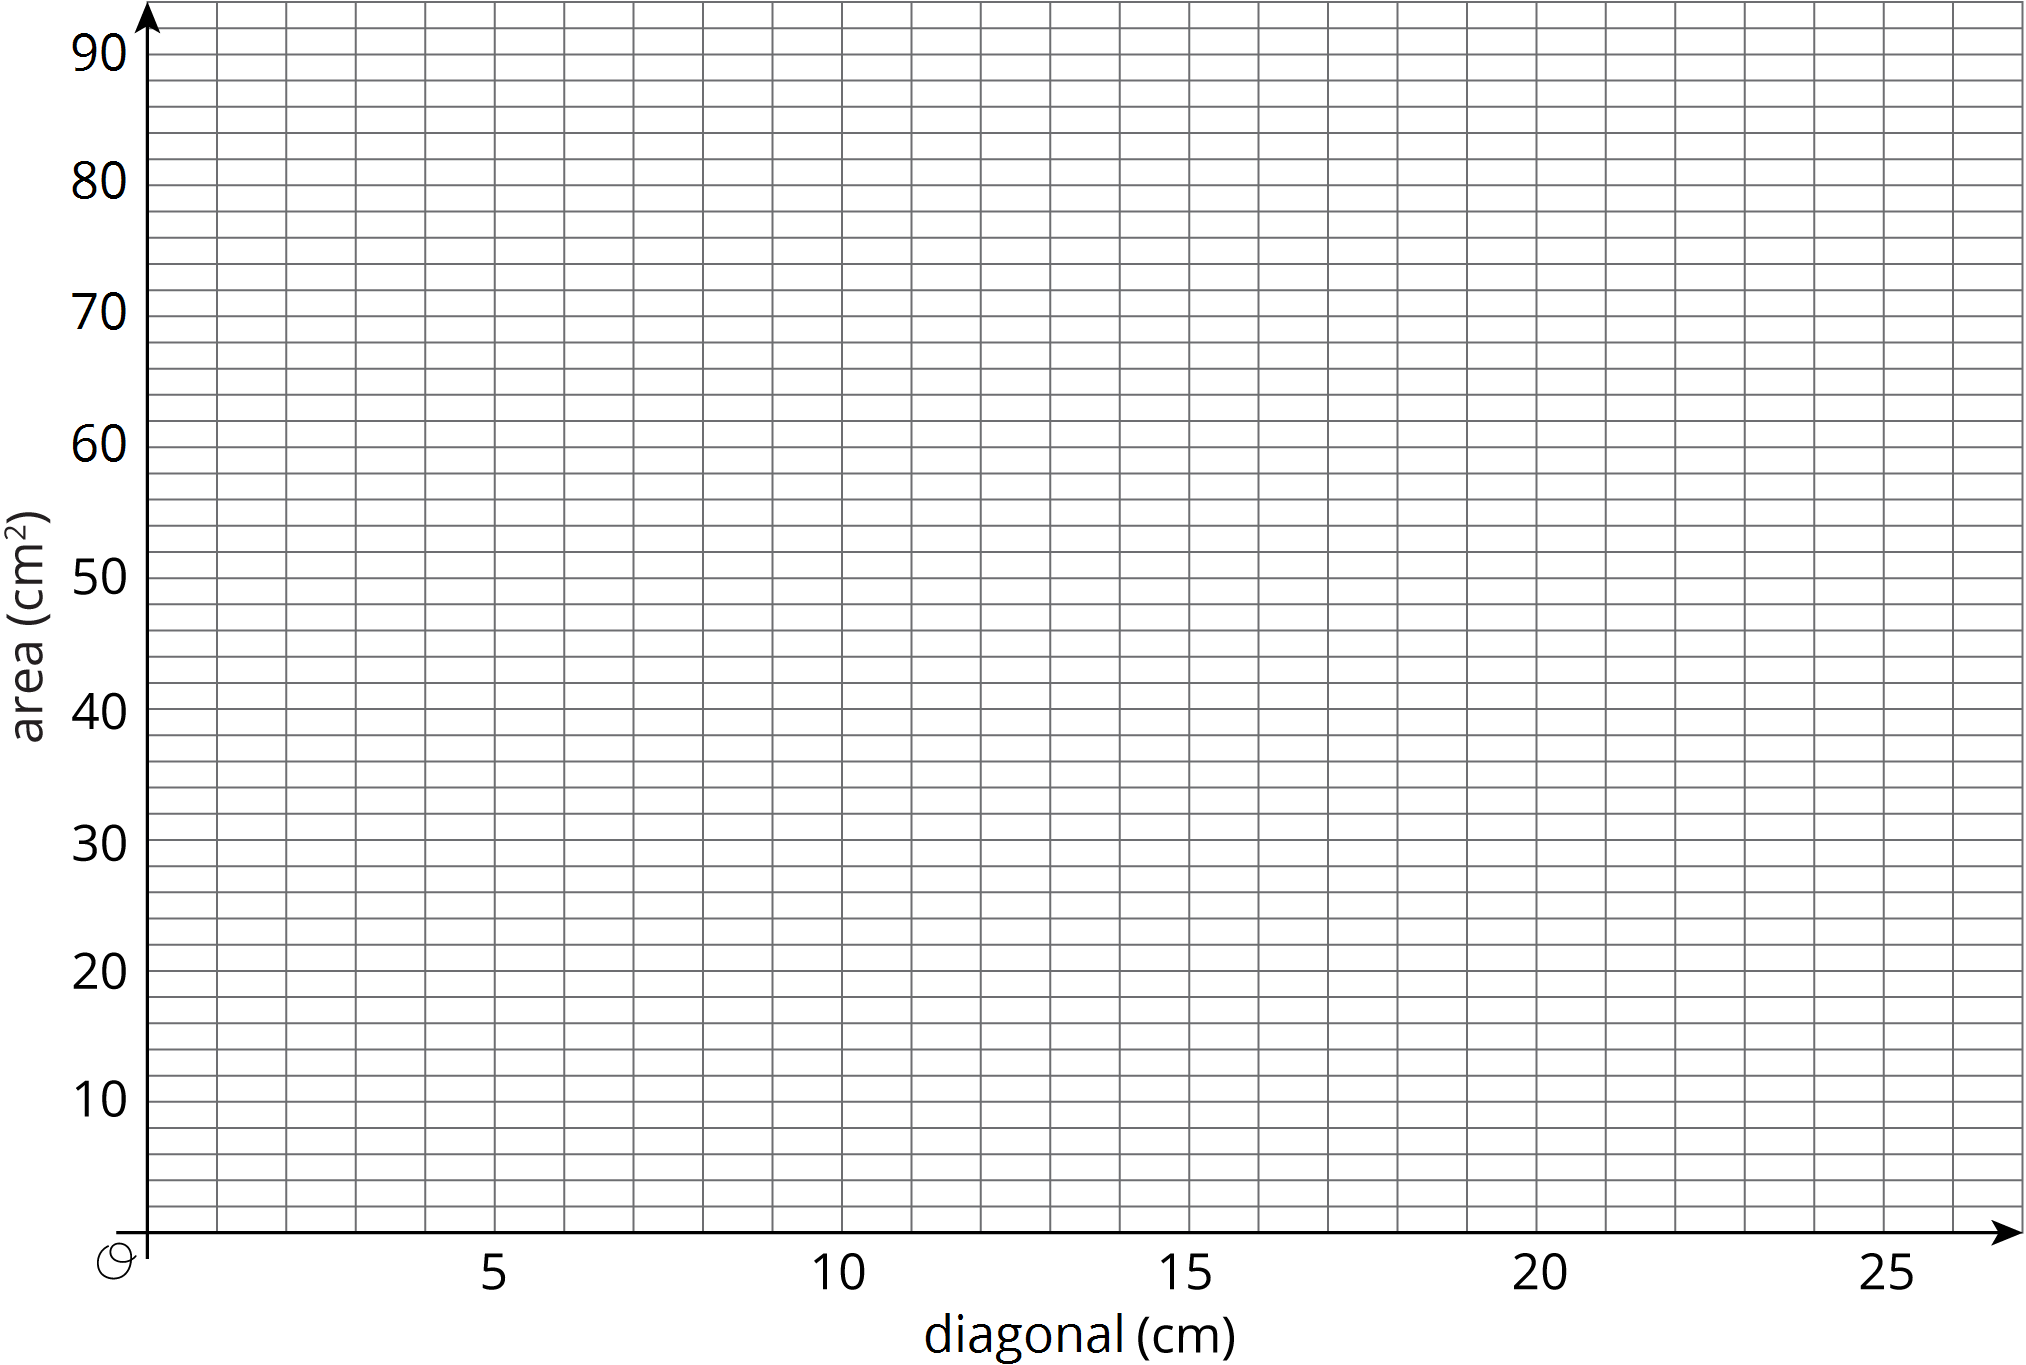
Keep students in the same groups. Tell them to calculate the area of the same 3 squares they measured in the previous activity. Give students 4 minutes of group work time. Display this blank grid and have students plots points for their measurements.
Give students 2–3 more minutes of group work time followed by whole-class discussion.
Supports accessibility for: Memory; Conceptual processing
Student Facing
- In the table, record the length of the diagonal for each of your assigned squares from the previous activity. Next, calculate the area of each of your squares.
Pause here so your teacher can review your work. Be prepared to share your values with the class.diagonal (cm) area (cm2) square A square B square C square D square E square F square G square H square I - Examine the class graph of these values. What do you notice?
- How is the relationship between the diagonal and area of a square the same as the relationship between the diagonal and perimeter of a square from the previous activity? How is it different?
Student Response
For access, consult one of our IM Certified Partners.
Student Facing
Are you ready for more?
Here is a rough map of a neighborhood.

There are 4 mail routes during the week.
- On Monday, the mail truck follows the route A-B-E-F-G-H-A, which is 14 miles long.
- On Tuesday, the mail truck follows the route B-C-D-E-F-G-B, which is 22 miles long.
- On Wednesday, the truck follows the route A-B-C-D-E-F-G-H-A, which is 24 miles long.
- On Thursday, the mail truck follows the route B-E-F-G-B.
How long is the route on Thursdays?
Student Response
For access, consult one of our IM Certified Partners.
Anticipated Misconceptions
Some students may struggle to calculate the area of the squares, or may use the length of the diagonal as if it were the side length. Prompt them with questions like “How can you calculate the area of a rectangle?” “What is the length and width of your square?”
Some students may measure the side length of each square again, instead of dividing the perimeter from the previous activity by 4. This strategy is allowable, although you can also prompt them to consider if they no longer had access to a ruler, is there a way they could use the information they already recorded to find this measurement.
Some students may struggle to organize the information. Prompt them to add a column to the table in the previous activity to record the side length of the squares.
Activity Synthesis
The goal of this discussion is for students to recognize that the relationship between the length of the diagonal and the area of squares of different sizes is not a proportional relationship.
Invite students to share their observations about the graph. Important points include:
- As the length of the diagonal increases, the area of the square increases.
- The points do not look like they lie on a line and definitely do not lie on a line that goes through \((0,0)\).
- The area of the square looks to grow at a faster rate for larger diagonals than for the short diagonals.
To reinforce that the relationship is not proportional, instruct students to calculate the quotient of the area divided by the length of the diagonal for their square. Consider displaying a table of their measurements and adding a third column to record their quotients. Students should realize that the differences between these quotients are too large to be accounted for by just measurement error.
| diagonal (cm) | area (cm2) | \(\text{area} \div \text{diagonal}\) |
|---|---|---|
| 8.2 | 33.6 | 4.1 |
| 4.2 | 9 | 2.1 |
| 6.8 | 23 | 3.4 |
| 2.2 | 2.4 | 1.1 |
| 12.6 | 77.4 | 6.1 |
If time permits, consider using this picture to reinforce that length scales linearly while area does not:
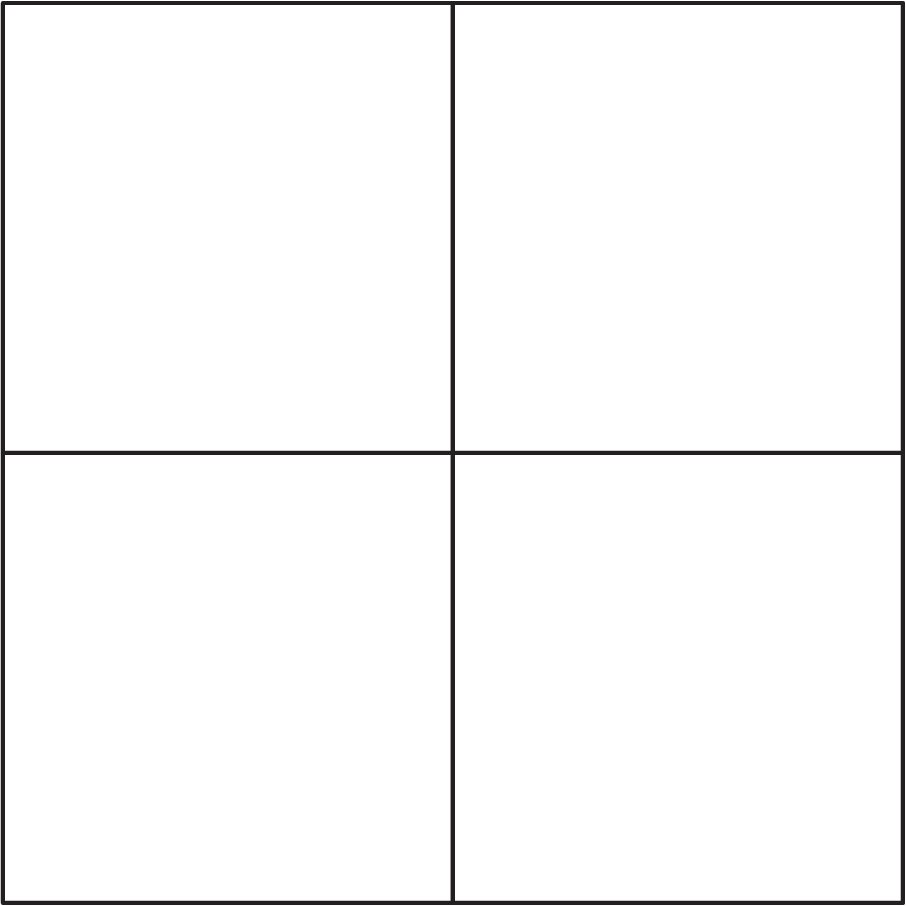
- “If the side length of the small square is \(s\), what is the side length of the large square?” (\(2s\))
- “If the diagonal of the small square is \(d\), what is the diagonal of the large square?” (\(2d\))
- “If the area of the small square is \(A\), what is the area of the large square?” (\(4A\))
- “Is the relationship between the diagonal and the area proportional?” (No, when the diagonal doubles, the area quadruples; if the relationship were proportional, both the diagonal and the area would double.)
Design Principle(s): Support sense-making
Lesson Synthesis
Lesson Synthesis
Key takeaways:
- When we measure the quantities in a proportional relationship, measurement error may make it look like there is not an exact constant of proportionality.
- A graph can be helpful to decide whether the points are close to lying on a straight line.
Questions:
- “What does the graph of a proportional relationship look like?” (A straight line through the origin.)
- “If we measure the quantities in a proportional relationship and graph our measurements, what will the graph look like?” (The points will probably lie close to a straight line through the origin, but not exactly.)
Consider displaying various graphs and asking students whether they think the quantities are in a proportional relationship.
1.4: Cool-down - Examining Relationships (5 minutes)
Cool-Down
For access, consult one of our IM Certified Partners.
Student Lesson Summary
Student Facing
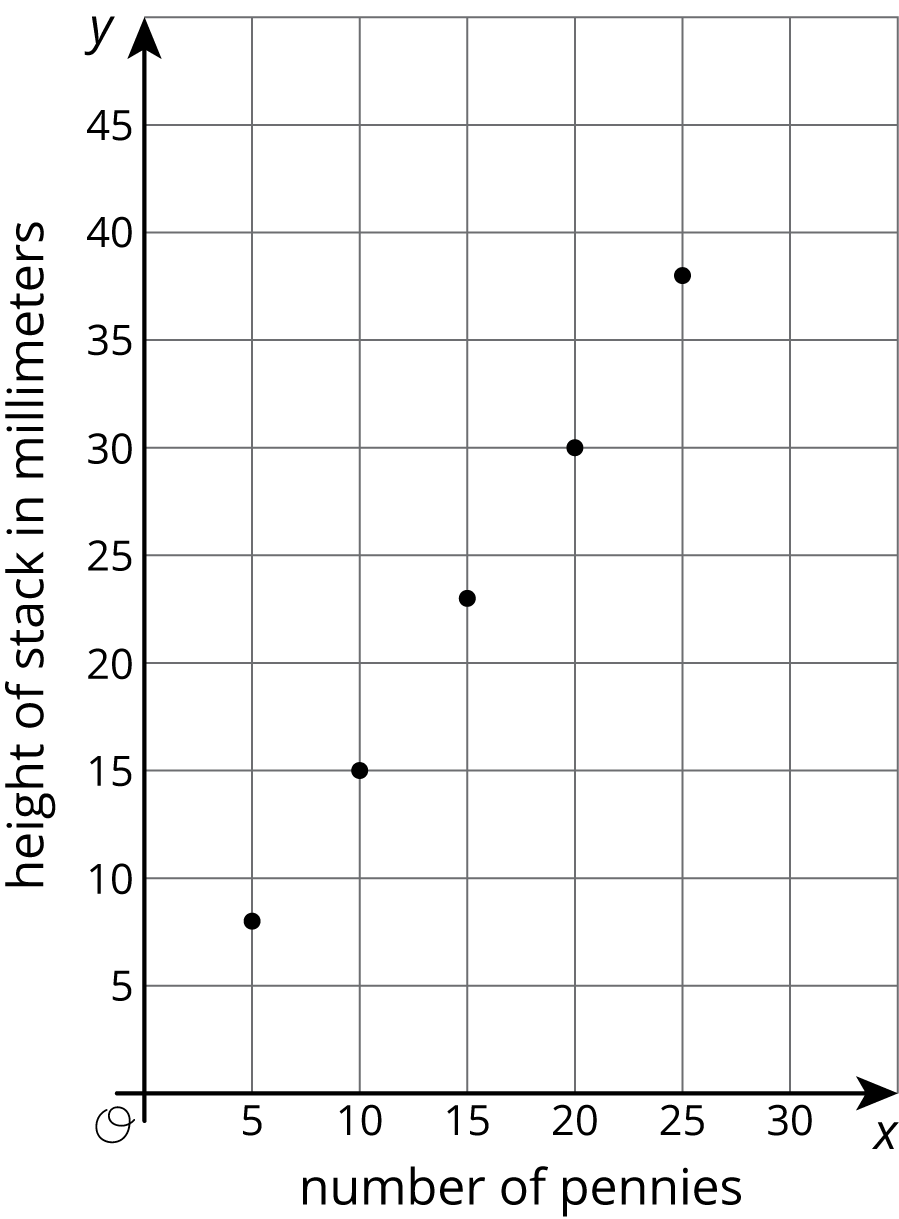
When we measure the values for two related quantities, plotting the measurements in the coordinate plane can help us decide if it makes sense to model them with a proportional relationship. If the points are close to a line through \((0,0)\), then a proportional relationship is a good model. For example, here is a graph of the values for the height, measured in millimeters, of different numbers of pennies placed in a stack.
Because the points are close to a line through \((0,0)\), the height of the stack of pennies appears to be proportional to the number of pennies in a stack. This makes sense because we can see that the heights of the pennies only vary a little bit.
An additional way to investigate whether or not a relationship is proportional is by making a table. Here is some data for the weight of different numbers of pennies in grams, along with the corresponding number of grams per penny.
| number of pennies | weight in grams | grams per penny |
|---|---|---|
| 1 | 3.1 | 3.1 |
| 2 | 5.6 | 2.8 |
| 5 | 13.1 | 2.6 |
| 10 | 25.6 | 2.6 |
Though we might expect this relationship to be proportional, the quotients are not very close to one another. In fact, the metal in pennies changed in 1982, and older pennies are heavier. This explains why the weight per penny for different numbers of pennies are so different!