Lesson 1
How Well Can You Measure?
Let’s see how accurately we can measure.
1.1: Estimating a Percentage
A student got 16 out of 21 questions correct on a quiz. Use mental estimation to answer these questions.
- Did the student answer less than or more than 80% of the questions correctly?
- Did the student answer less than or more than 75% of the questions correctly?
1.2: Perimeter of a Square
Your teacher will give you a picture of 9 different squares and will assign your group 3 of these squares to examine more closely.
-
For each of your assigned squares, measure the length of the diagonal and the perimeter of the square in centimeters.
Check your measurements with your group. After you come to an agreement, record your measurements in the table.
diagonal (cm) perimeter (cm) square A square B square C square D square E square F square G square H square I -
Plot the diagonal and perimeter values from the table on the coordinate plane.
-
What do you notice about the points on the graph?
Pause here so your teacher can review your work.
- Record measurements of the other squares to complete your table.
1.3: Area of a Square
- In the table, record the length of the diagonal for each of your assigned squares from the previous activity. Next, calculate the area of each of your squares.
Pause here so your teacher can review your work. Be prepared to share your values with the class.diagonal (cm) area (cm2) square A square B square C square D square E square F square G square H square I - Examine the class graph of these values. What do you notice?
- How is the relationship between the diagonal and area of a square the same as the relationship between the diagonal and perimeter of a square from the previous activity? How is it different?
Here is a rough map of a neighborhood.

There are 4 mail routes during the week.
- On Monday, the mail truck follows the route A-B-E-F-G-H-A, which is 14 miles long.
- On Tuesday, the mail truck follows the route B-C-D-E-F-G-B, which is 22 miles long.
- On Wednesday, the truck follows the route A-B-C-D-E-F-G-H-A, which is 24 miles long.
- On Thursday, the mail truck follows the route B-E-F-G-B.
How long is the route on Thursdays?
Summary
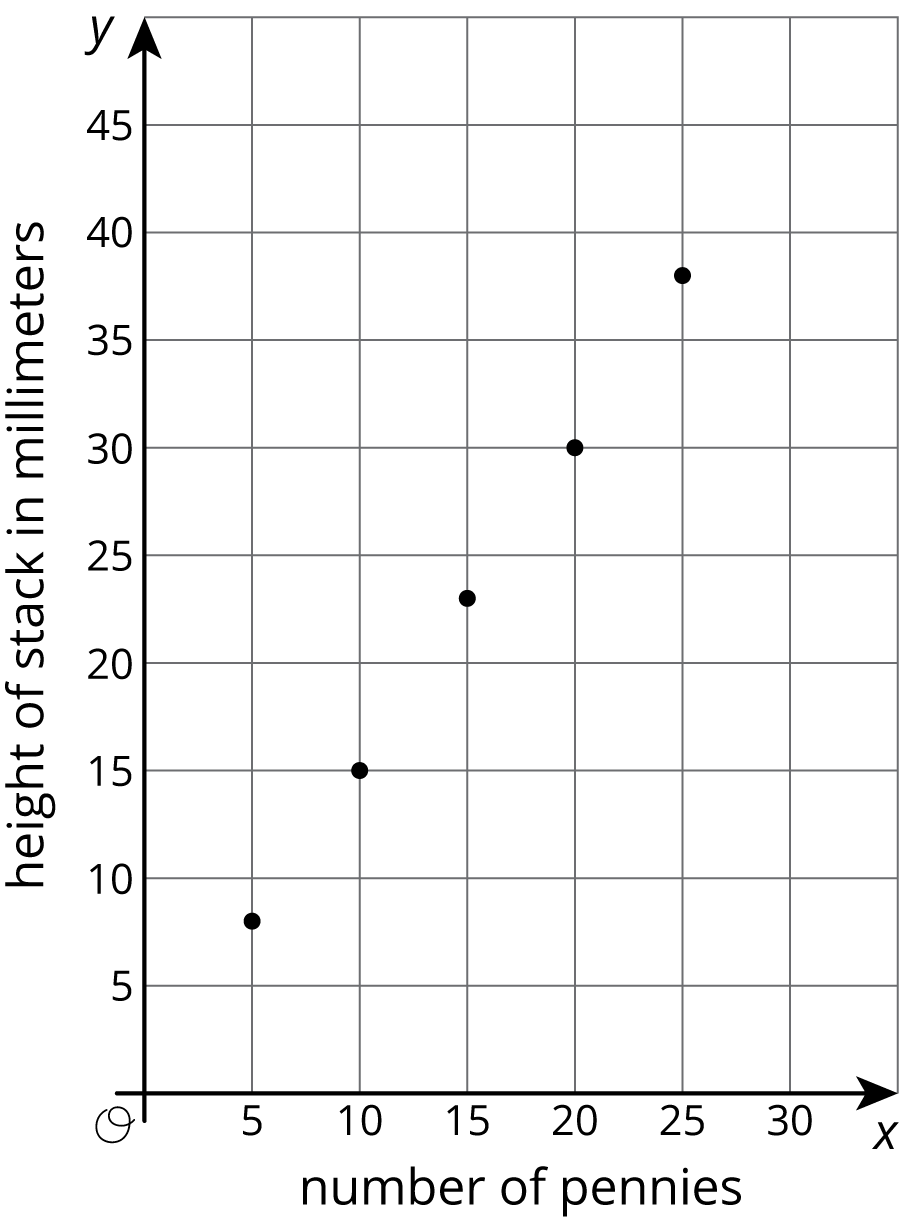
When we measure the values for two related quantities, plotting the measurements in the coordinate plane can help us decide if it makes sense to model them with a proportional relationship. If the points are close to a line through \((0,0)\), then a proportional relationship is a good model. For example, here is a graph of the values for the height, measured in millimeters, of different numbers of pennies placed in a stack.
Because the points are close to a line through \((0,0)\), the height of the stack of pennies appears to be proportional to the number of pennies in a stack. This makes sense because we can see that the heights of the pennies only vary a little bit.
An additional way to investigate whether or not a relationship is proportional is by making a table. Here is some data for the weight of different numbers of pennies in grams, along with the corresponding number of grams per penny.
| number of pennies | weight in grams | grams per penny |
|---|---|---|
| 1 | 3.1 | 3.1 |
| 2 | 5.6 | 2.8 |
| 5 | 13.1 | 2.6 |
| 10 | 25.6 | 2.6 |
Though we might expect this relationship to be proportional, the quotients are not very close to one another. In fact, the metal in pennies changed in 1982, and older pennies are heavier. This explains why the weight per penny for different numbers of pennies are so different!