Lesson 13
Tables and Double Number Line Diagrams
13.1: Number Talk: Constant Dividend (10 minutes)
Warm-up
This number talk helps students think about what happens to a quotient when the divisor is doubled. In this lesson and in upcoming work on ratios and unit rates, students will be asked to find a fraction of a number and identify fractions on a number line.
Launch
Display one problem at a time. Tell students to give a signal when they have an answer and a strategy. After each problem, give students 1 minute of quiet think time followed by a whole-class discussion. Pause after discussing the third question and give students 1 minute of quiet think time to place the quotients on the number line.
Supports accessibility for: Memory; Organization
Student Facing
Find the quotients mentally.
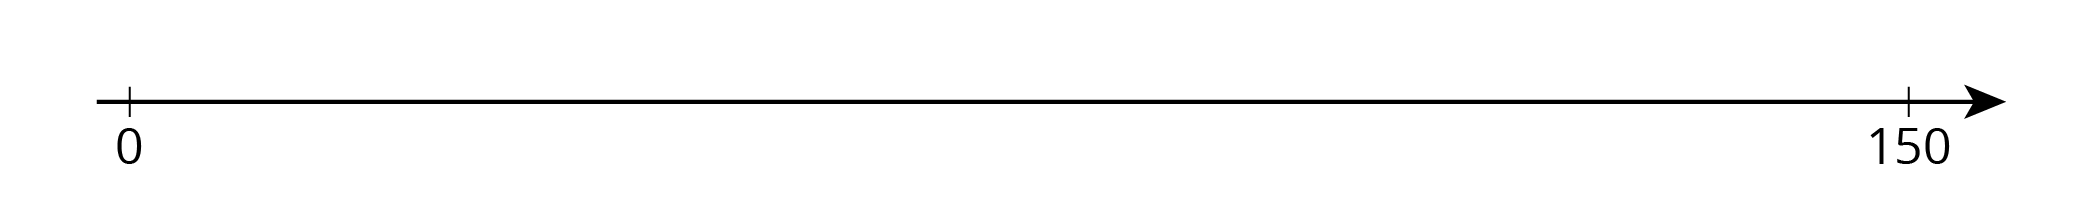
\(150\div 2\)
\(150\div 4\)
\(150\div 8\)
Locate and label the quotients on the number line.
Student Response
For access, consult one of our IM Certified Partners.
Activity Synthesis
Ask students to share their strategies for each problem. Record and display their explanations for all to see. To involve more students in the conversation, consider asking:
- “Who can restate ___’s reasoning in a different way?”
- “Did anyone solve the problem the same way but would explain it differently?”
- “Did anyone solve the problem in a different way?”
- “Does anyone want to add on to _____’s strategy?”
- “Do you agree or disagree? Why?”
For the fourth question, display the number line for all to see and invite a few students to share their reasoning about the location of each quotient on the number line. Discuss students’ observations from when they placed the numbers on the number line.
Design Principle(s): Optimize output (for explanation)
13.2: Moving 3,000 Meters (15 minutes)
Activity
In this activity, students use tables of equivalent ratios to solve three problems, with decreasing scaffolding throughout the activity. For the first problem, students start by examining a table of equivalent ratios, noticing that descriptive column headers are important in helping you use a table of equivalent ratios to solve a problem. For the second problem, there is an empty table students can fill in. The third problem does not provide any scaffolding, allowing students to choose their own method of solving the problem.
Monitor for students solving the last problem in different ways.
Launch
Arrange students in groups of 2. Give 3 minutes of quiet work time and then have students work with their partner.
Student Facing
The other day, we saw that Han can run 100 meters in 20 seconds.
Han wonders how long it would take him to run 3,000 meters at this rate. He made a table of equivalent ratios.
- Do you agree that this table represents the situation? Explain your reasoning.
20 100 10 50 1 5 3,000 - Complete the last row with the missing number.
- What question about the situation does this number answer?
- What could Han do to improve his table?
- Priya can bike 150 meters in 20 seconds. At this rate, how long would it take her to bike 3,000 meters?
-
Priya’s neighbor has a dirt bike that can go 360 meters in 15 seconds. At this rate, how long would it take them to ride 3,000 meters?
Student Response
For access, consult one of our IM Certified Partners.
Activity Synthesis
Select students with different methods for the last question to explain their solutions to the class. Highlight the connections between different strategies, especially between tables and double number line diagrams.
Design Principle(s): Support sense-making
13.3: The International Space Station (15 minutes)
Activity
This activity prompts students to compare and contrast two representations of equivalent ratios. Students work collaboratively to observe similarities and differences of using a double number line and using a table to express the same situation. Below are some key distinctions:
| double number line | table |
|---|---|
| Distances between numbers and lengths of lines matter. | Distances and lengths do not matter because there are no lines. |
| The numbers on each line must be in order. | Rows of ratios can be out of order; within a column, numbers can go in any order that is convenient. |
| Each value of a ratio is shown on a line. | Each value of a ratio is shown in a column. |
| Pairs of values of a ratio are aligned vertically. | Pairs of values of a ratio appear in the same row. |
You will need The International Space Station blackline master for this activity.
Launch
To help students build some intuition about kilometers, begin by connecting it with contexts that are familiar to them. Tell students that “kilometer” is a unit used in the problem. Then ask a few guiding questions.
- “Can you name two things in our town (or city) that are about 1 kilometer apart?” (Consider finding some examples of 1-kilometer distances near your school ahead of time.)
- “How long do you think it would take you to walk 1 kilometer?” (Typical human walking speed is about 5 kilometers per hour, so it takes a person about 12 minutes to walk 1 kilometer.)
- “What might be a typical speed limit on a highway, in kilometers per hour?” (100 kilometers per hour is a typical highway speed limit. Students might be more familiar with a speed limit such as 65 miles per hour. Since there are about 1.6 kilometers in every mile, the same speed will be expressed as a higher number in kilometers per hour than in miles per hour.)
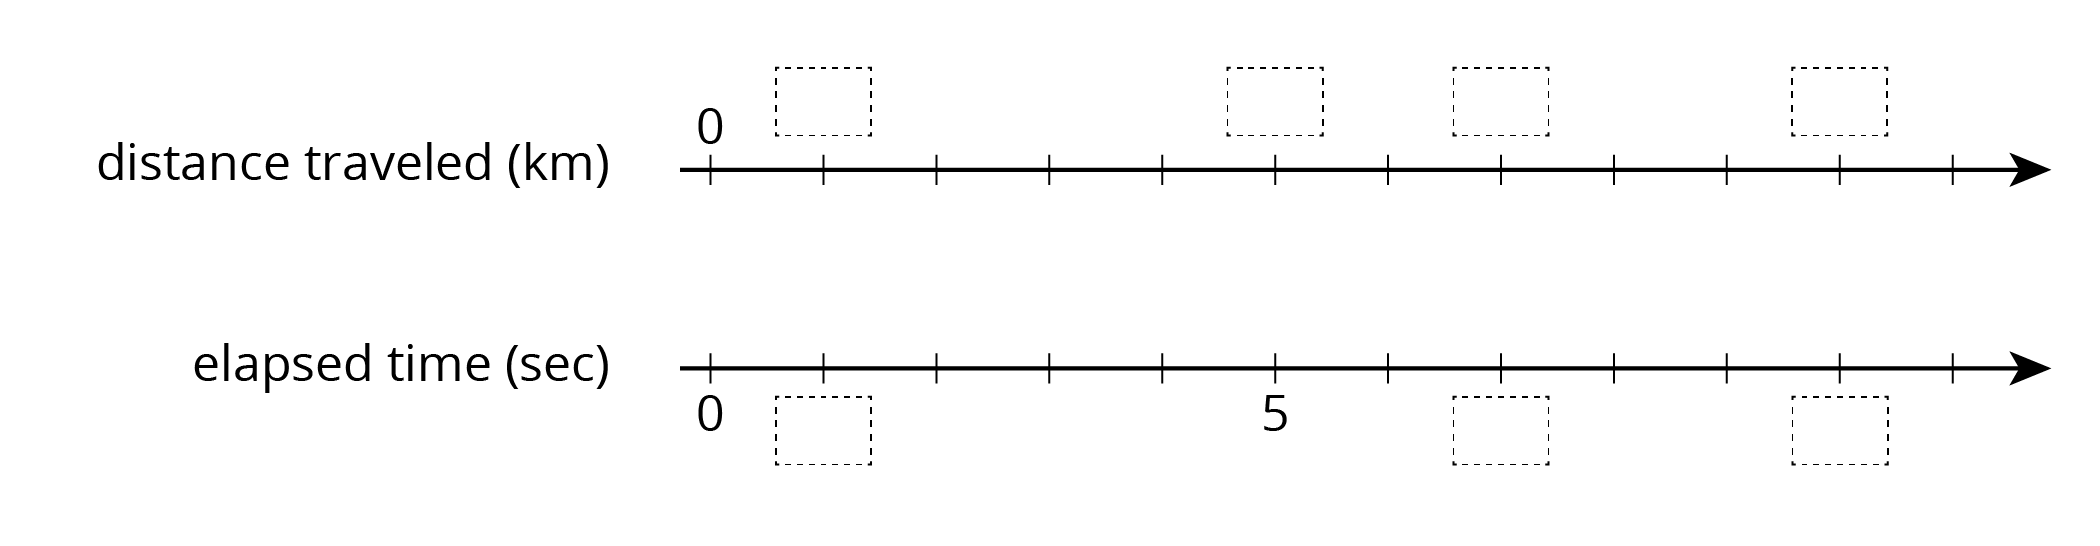
Arrange students in groups of 2. Give one person a slip with the table and the other a slip with a double number line (shown below). Ask students to first do what they can independently, and then to obtain information from their partners to fill in all the blanks. Explain that when the blanks are filled, the two representations will show the same information.
| distance traveled (km) | elapsed time (sec) |
|---|---|
| 0 | 0 |
| 80 | 10 |
| 1 | |
Student Facing
The International Space Station orbits around the Earth at a constant speed. Your teacher will give you either a double number line or a table that represents this situation. Your partner will get the other representation.

- Complete the parts of your representation that you can figure out for sure.
- Share information with your partner, and use the information that your partner shares to complete your representation.
- What is the speed of the International Space Station?
- Place the two completed representations side by side. Discuss with your partner some ways in which they are the same and some ways in which they are different.
- Record at least one way that they are the same and one way they are different.
Student Response
For access, consult one of our IM Certified Partners.
Student Facing
Are you ready for more?
Earth’s circumference is about 40,000 kilometers and the orbit of the International Space Station is just a bit more than this. About how long does it take for the International Space Station to orbit Earth?
Student Response
For access, consult one of our IM Certified Partners.
Anticipated Misconceptions
Students with the double number line representation may decide to label every tick mark instead of just the ones indicated with dotted rectangles. This is fine. Make sure they understand that the tick marks with dotted rectangles are the ones they are supposed to record in the table.
Activity Synthesis
Display completed versions of both representations for all to see. Invite students to share the ways the representations are alike and different. Consider writing some of these on the board, or this could just be a verbal discussion. Highlight the distinctions in terms of distances between numbers, order of numbers, and the vertical or horizontal orientations of the representations.
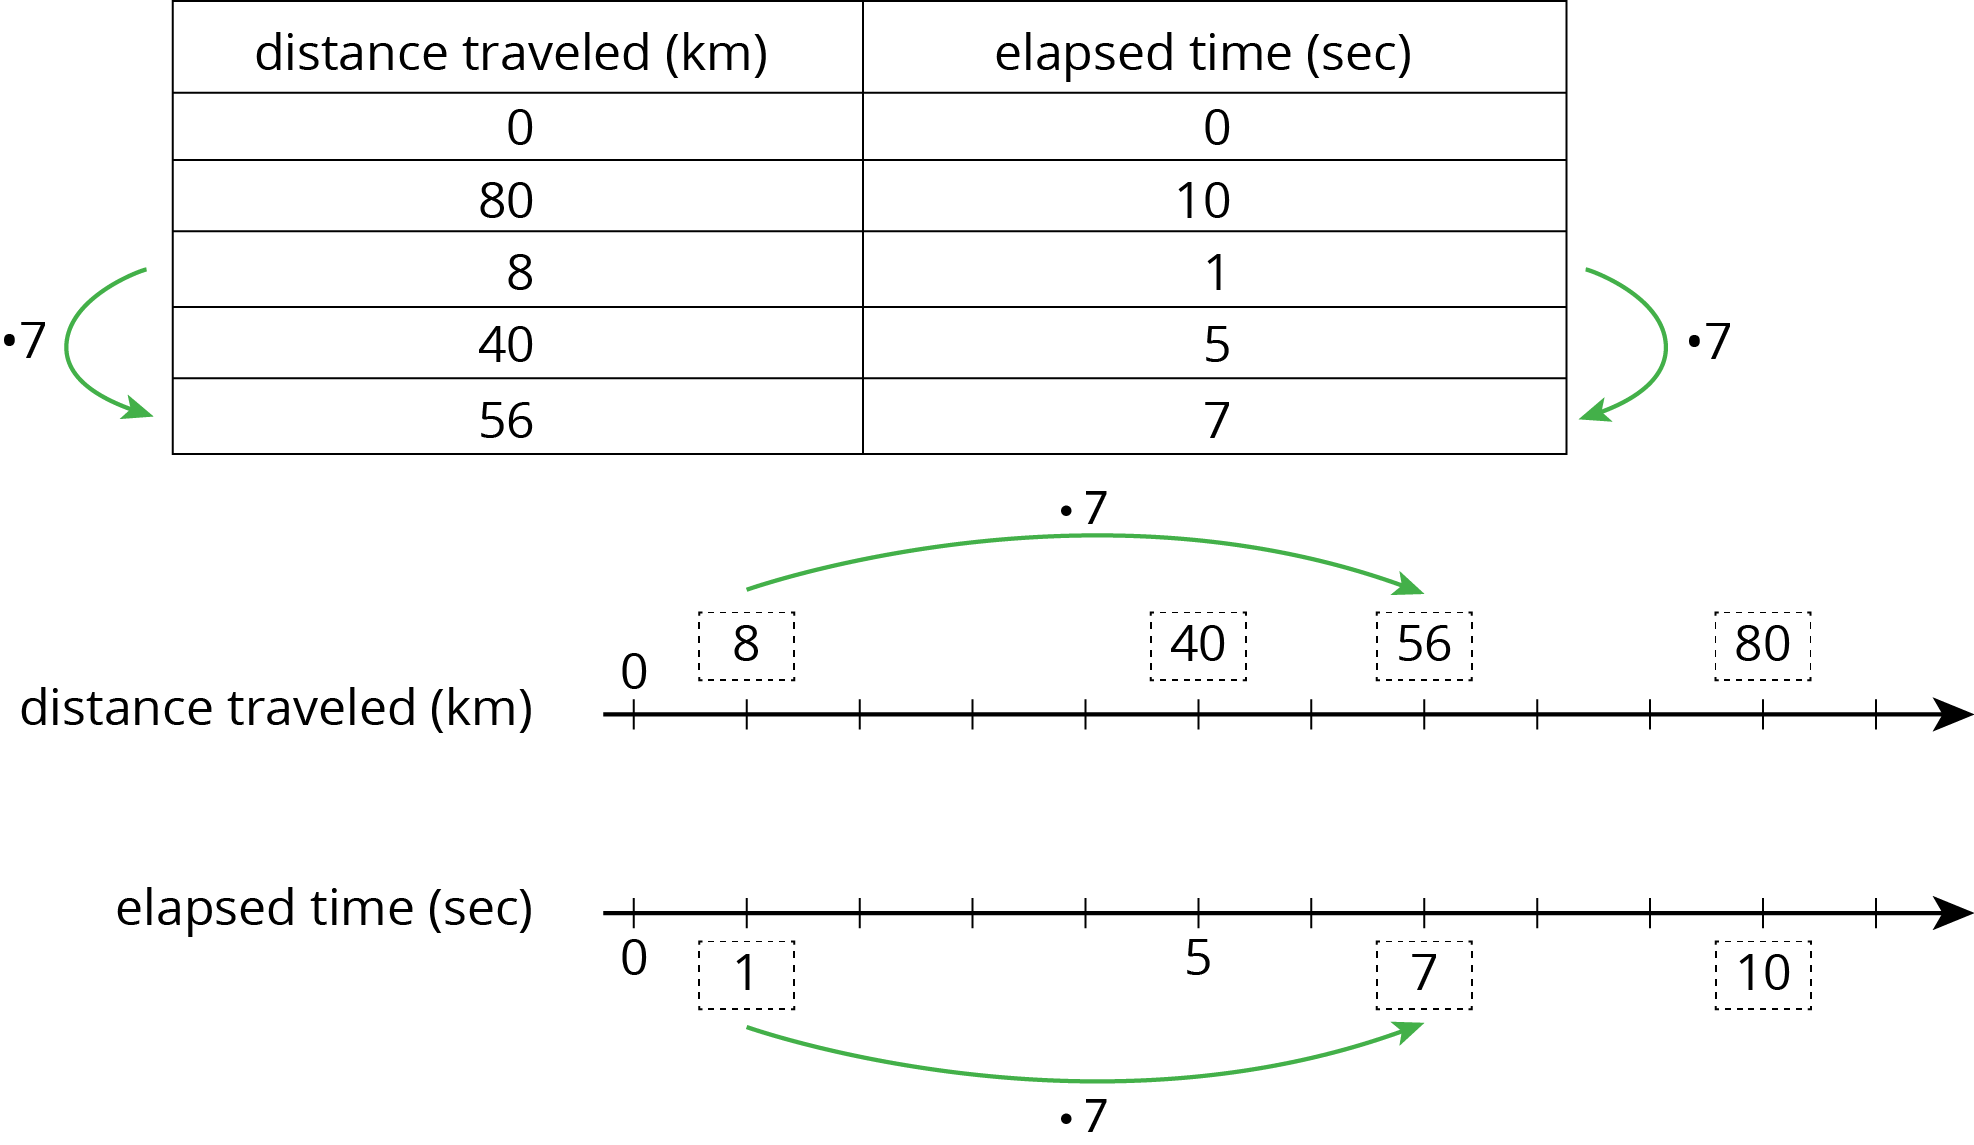
Although it is not a structural distinction, students might describe the direction in which multiplying happens as a difference between the two representations. They might say that we “multiply up or down” to find equivalent ratios in a table, and we “multiply across” to do the same on a double number line. You could draw arrows to illustrate this fact:
The vertical orientation of tables and the horizontal orientation of double number lines are conventions we decided to consistently use in these materials. Mathematically, there is nothing wrong with orienting each representation the other way. Students may encounter tables oriented horizontally in a later course. Later in this course, they will encounter number lines oriented vertically.
Supports accessibility for: Conceptual processing; Organization
Lesson Synthesis
Lesson Synthesis
Briefly revisit the two tasks, displaying the representations for all to see, and pointing out ways in which tables and double number lines are the same and different. Emphasize that tables are sometimes easier to work with.
- In one task, we looked at the distance the ISS travels in its orbit and the time it takes to orbit Earth. How are the table and the double number line similar to each other? How are they different?
- Why is it important to include descriptive column headers on tables?
13.4: Cool-down - Bicycle Sprint (5 minutes)
Cool-Down
For access, consult one of our IM Certified Partners.
Student Lesson Summary
Student Facing
On a double number line diagram, we put labels in front of each line to tell what the numbers represent. On a table, we put labels at the top of each column to tell what the numbers represent.
Here are two different ways we can represent the situation: “A snail is moving at a constant speed down a sidewalk, traveling 6 centimeters per minute.”
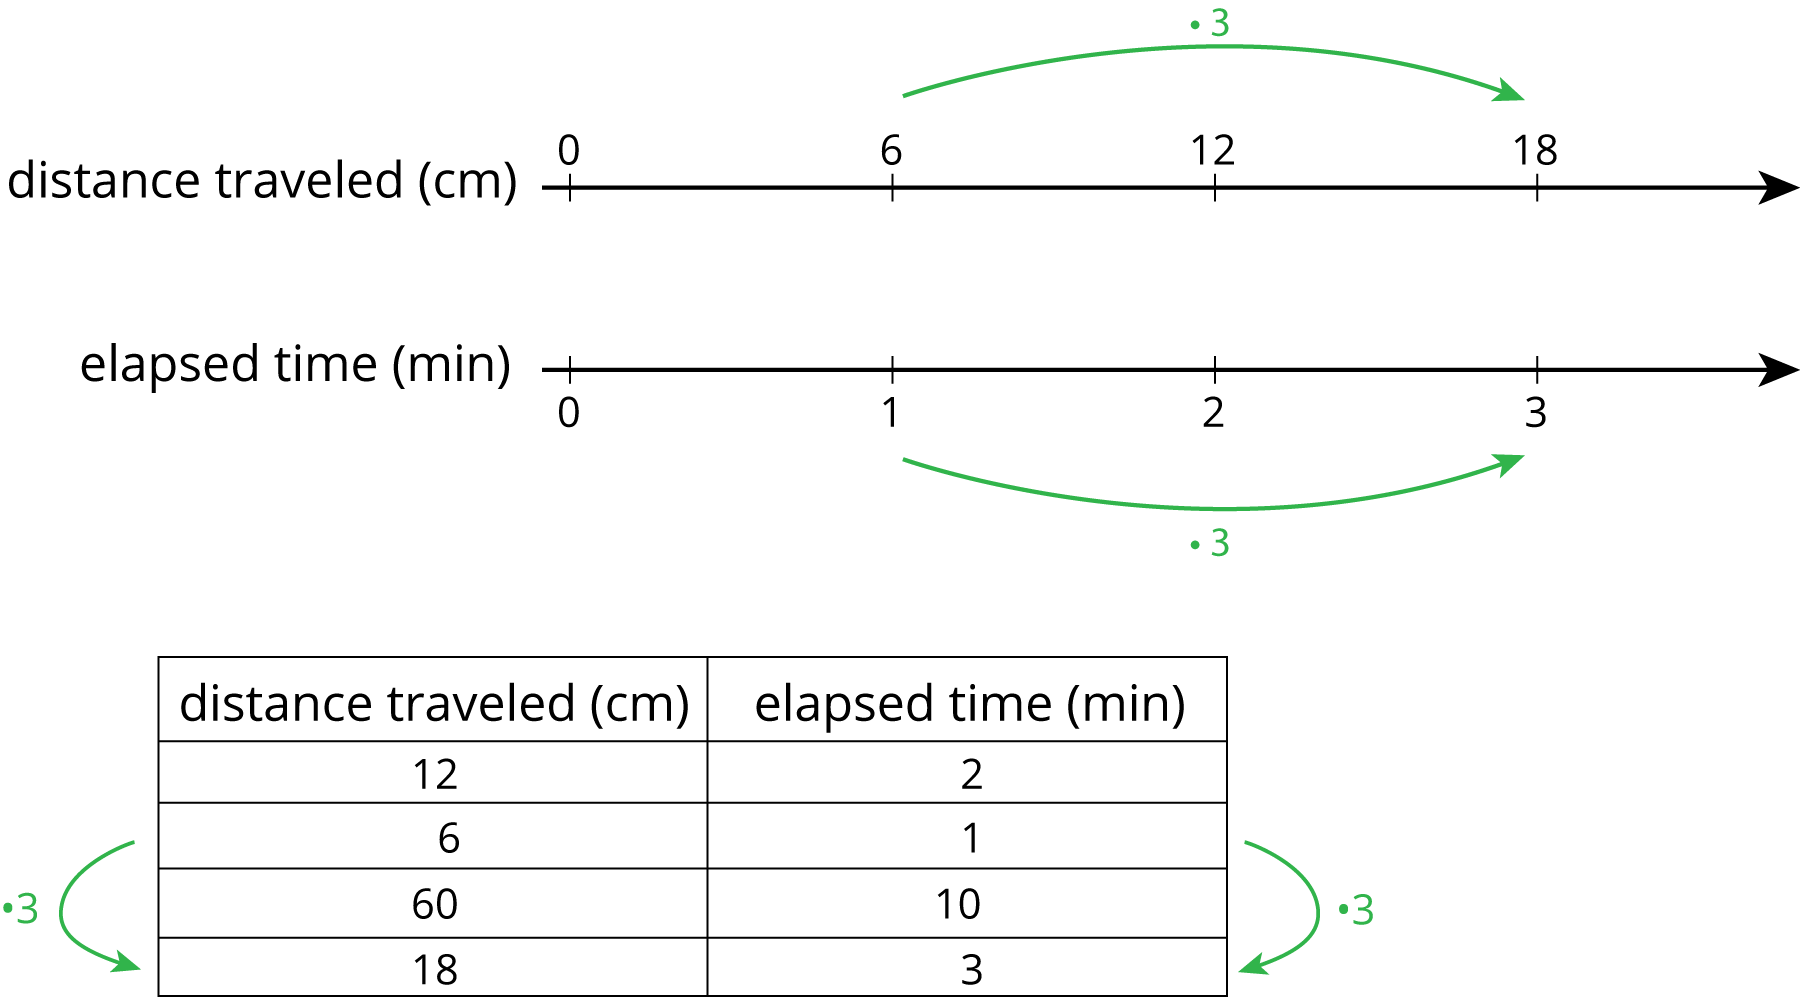
Both double number lines and tables can help us use multiplication to make equivalent ratios, but there is an important difference between the two representations.
On a double number line, the numbers on each line are listed in order. With a table, you can write the ratios in any order. For this reason, sometimes a table is easier to use to solve a problem.
For example, what if we wanted to know how far the snail travels in 10 minutes? Notice that 60 centimeters in 10 minutes is shown on the table, but there is not enough room for this information on the double number line.